Crypto Academy / Season 4 / Week 1 - Homework Post for @allbert (Trading with Strong, Weak and Gap Levels)
Hello All...
This week I will try to join professor @allbert's class, this week's lesson on Trading with Strong, Weak and Gap Levels. hopefully easy to understand and can be useful.
.jpg)

Difference between Weak and Strong Levels
Strong Support and Resistances
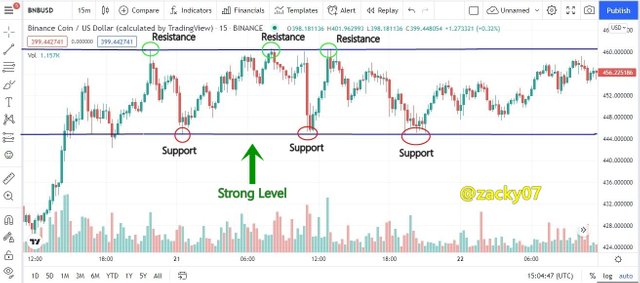
In determining a strong level, support and resistance analysis is needed. Strong levels can be characterized by reliable support and resistance in influencing the crypto asset being analyzed. so strong levels are characterized by support and resistance behavior that rejects the price several times. so market behavior can be seen with prices going up and down can be seen at the support and resistance levels.
 source from TradingView
let's see from the chart above, in the BNB/USD trading pair the price fluctuates in the market, we can see the price has increased several times from the support level to the resistance level, events like this are called strong levels. at strong levels, the market is very liquid which makes price trend changes. This is what makes the BNB/USD trading pair experience an increase and decrease in price involving support and resistance levels
Week Support and Resistances
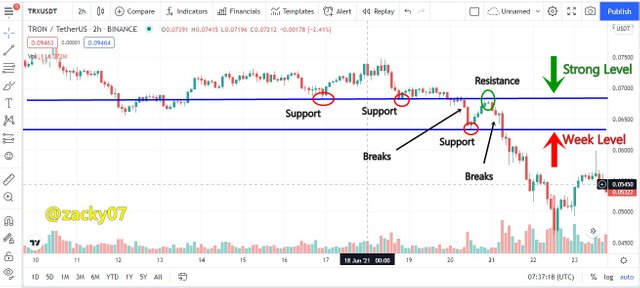
Weak levels can be characterized by unreliable support and resistance in influencing the crypto asset being analyzed. so the weak level is marked by the behavior of support and resistance which is only able to reject the price once and twice. so that when a weak level occurs, one of the support or resistance levels is damaged, causing the price of an asset to increase or decrease.
source from TradingView
let's see from the chart above, in the TRX/USDT trading pair the price increase from support to resistance levels only happened once, so it can be said that the market is at a weak level. this is all due to pending buy or sell orders on a smaller scale and low volume, thus making the price move in the opposite direction and in the TRX/USDT pair above the price breaks the support level causing the price to decline.
Gap
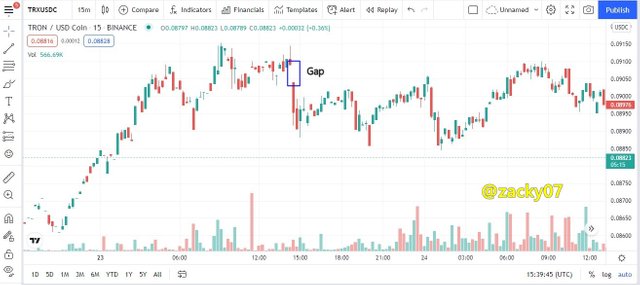
A gap is a price jump that has passed a certain level, but the price has just opened at another level without crossing the previous level, so there is a gap between the two candles.
 source from TradingView
let's see from the chart above, in the TRX/USDC trading pair during a bearish trend there was a price spike that occurred due to high trading volume, so there was a gap between the two candles. and it could be that when the Gap is formed many traders withdraw all their assets in the market suddenly.
The Types of Gap
Breakway Gap
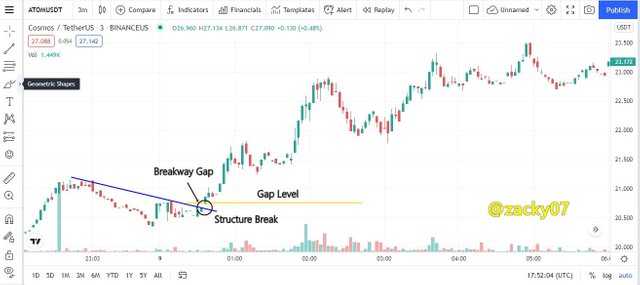
Breakway Gap is an event in the market that occurs when a trend changes the market, at the beginning of a new trend a breakout occurs in the market structure. this can be said to be a strong resistance and support level in the market
source from TradingView
let's see from the chart above, in the ATOM/USDT trading pair there is a trend reversal from bearish to bullish. and at the beginning of the bullish trend, a breakaway gap occurred.
Runaway Gap
Runaway Gap is an event in the market that occurs when a bullish or bearish trend continues. This event is also a strong level of resistance and support in the market.
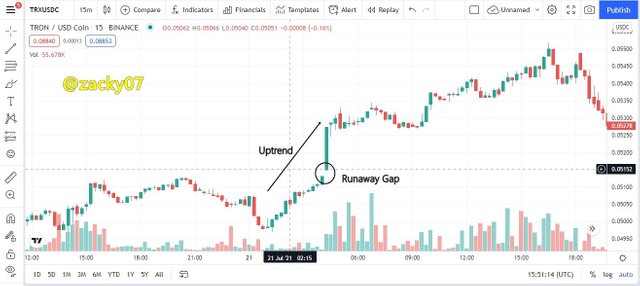 source from TradingView
Let's see from the chart above, the TRX/USDC trading pair is experiencing a bullish phase, and a gap is formed in the middle of the trend between the two candles, and in this event indicates a continuation of the bullish trend
Exhaustion Gap
Exhaustion Gap is an event in the market that occurs at the end of the trend and shows the last push, so that in the opposite direction of the trend the price will return again to cover the previous gap.
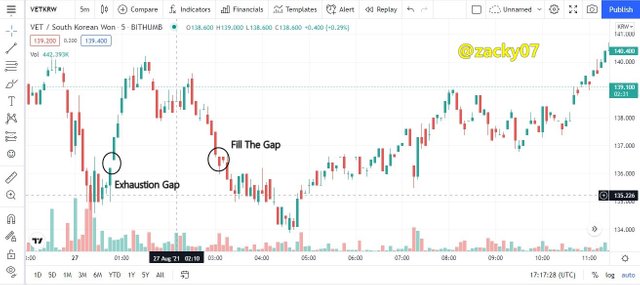
source from TradingView
let's see from the chart above, in the VET/KRW trading pair the price is rising in the bullish phase of the market, and on the reversal of the trend, the downward price movement can fill the gap in the previous bullish phase.
Practice the (Buy/Sell) Through Strong Supports and Resistances
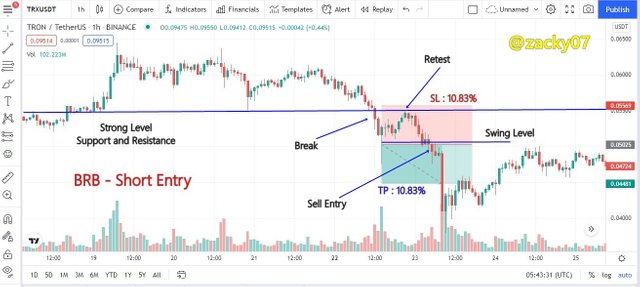
source from TradingView
In the TRX/USDT trading pair above I tried to set take profit and stop loss with a 1:1 ratio. I use a simple strategy that is BRB. in the chart above we can see together that the market has broken through the support and resistance levels and has created a swing point. here the price tries to rise again and forms a resistance level equivalent to the previous support level. when the price falls back past the swing point that's where we can place our sell entry.
Practice the (Buy/Sell) Through Gaps levels
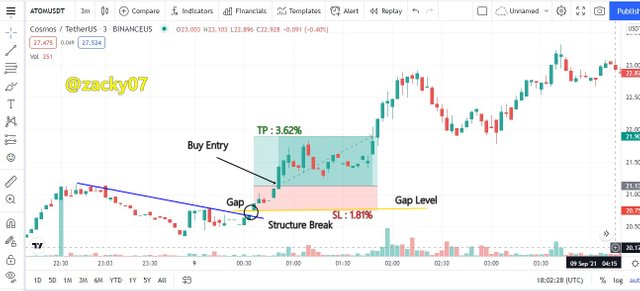
source from TradingView
In the ATOM/USDT trading pair above I tried to set stop loss and take profit with a ratio of 1:2. in the trading pair the price has experienced a trend change from bearish to bullish and at the beginning of the trend reversal a gap occurs, that's when we set a market entry strategy. I waited for the candle to pass the previous resistance level, after that, I placed a buy entry.
Conclusion
Support and resistance levels are very important in analyzing cryptocurrency assets on the market, in determining weak and strong levels of support and resistance it is very important to know the state of the market. So in analyzing a trader must know the direction of market movement before entering the market, so that the trades made have a high percentage of success
Hello @zacky07 Thank you for participating in Steemit Crypto Academy season 4 week 1.