Steemit Crypto Academy Season 3 - Intermediate Course| Week2: Trading with the Fibonacci Retracement levels
Fibonacci retracement levels are simply described as horizontal lines used to showcase the possible support and resistance levels on a trading chart. These are in percentage form including 23.6%, 38.2%, 61.8% and 78.6% plus 50% though 50% is not part of the retracement levels since its not derived from the Fibonacci sequence, however traders prefer watching the price action at the 50% level. The retracement levels are derived from the “Fibonacci sequence.” The Fibonacci sequence was ascertained by Leonardo Fibonacci an Italian mathematician in the 13th century hence named after him.
The Fibonacci sequence numbers include 0,1,1,2,3,5,8,13,21,34,55,89,144….These are obtained through summing up 2 preceding Fibonacci numbers. The initial numbers are 0 and 1 the rest of the numbers are simply a summation of the 2 prior numbers. For instance 0,1 then 0+1 =1, then 1+1 =2. Followed by 2+1=3, the next 2+3=5, and so on..The sequence continues to infinity.
Most importantly are the Fibonacci ratios/percentages derived from the above Fibonacci sequence. These are derived through a mathematical relationship. For now, I will not go into details of those calculations since the major focus of this lecture is to show you their applicability on the charts. Otherwise, you can check out how they are derived through this article
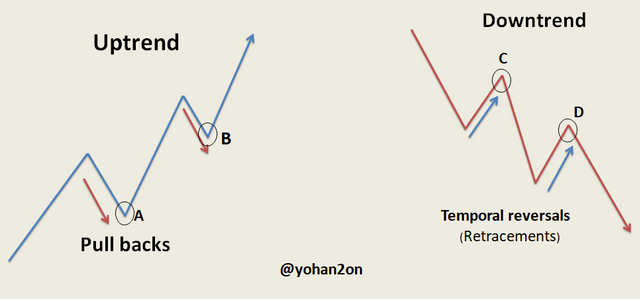
Retracements are simply defined as temporal price reversals from the major trend. A complete reversal happens when the market price completely changes direction from either a strong Uptrend to a Strong downtrend and the reverse is true.
How relevant are the Fibonacci Retracement levels in trading?
Fibonacci retracement levels are used by traders particularly in trending markets to identify possible reversal areas after the pullbacks. Let’s take for instance the price of an asset increases in value from $25 to $50 then it pulls back to about $40. By using a Fibonacci retracement tool, a trader can identify a possible reversal by taking note of the price action at one of the retracement levels(23.6%, 38.2%.....). He can then look for a buying opportunity in order to continue with the trend and make some profits.
Since the Fibonacci retracement levels have to do with support and resistance. Markets tend to respect the support and resistance areas by either bouncing off the retracement level or continuing with another new trend. The latter normally happens when the price retraces beyond 50% and 61.8% Fibonacci retracement levels.
Here is what to take caution of while using the Fibonacci Retracement levels
It’s very important to note that while Fibonacci retracement levels are useful, these do not guarantee 100% results since they just provide an estimated trade opportunity area to look out for and not an exact trade entry point. Therefore these should not be traded in Isolation; a trader should rather use them together with other trading indicators in order to make a concrete trade decision for high probability trades.
Applying the Fibonacci retracement tool on small price moves can avail a trader with lots of areas to focus on making it riskier to trade with the Fibonacci in such a scenario seeing that the levels are so close to each other.
How to apply the Fibonacci retracement levels for consistently profitable trading
First and foremost you must know that the Fibonacci retracement tool works best in strong trending markets (Uptrend or Downtrend). You should not apply it in ranging markets otherwise you will be indecisive on whether to go short or long on an asset. Basically, the tool ought to be applied on big price moves and not on smaller ones.
They are used in placing a good stop loss. Whenever price reverses going upwards after a pull back from the uptrend, a trader will have a good spot to place his stop-loss that is at the most recent swing low. By using the retracement levels, a trader is also able to place his profit target at a resistance level that is already demarcated by the Fibonacci.
A&B are pull backs or temporal retracements from the larger trend (Uptrend). Point A&B are also good buying opportunities. In the case of a Downtrend, C&D are the temporal retracements from the larger trend (Downtrend). They are also selling opportunities. These can easily be spotted using the Fibonacci retracement levels. They act as the support levels in the Uptrend and Resistance levels in a downtrend.
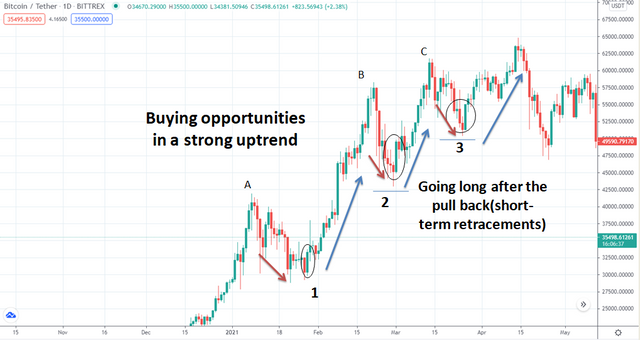
You have to make sure that you are trading temporal reversals and not a permanent change in the direction of the original trend otherwise you might end up in huge losses. To avoid the latter, You, therefore, need to apply some trade management through setting up a Stop loss for a very trade.
Set your stop loss a few pips(5-10) above or below the retracement level depending on whether you are buying in an uptrend or selling in the downtrend.
Locate 2 points on a trading chart “a higher point (Top) and lower point (bottom)”. This is where you will have to plot the Fibonacci retracement levels. Begin from the recent lower price point (bottom) stretch/drag it to the most recent higher price point (Pick price). That applies in an Uptrend.
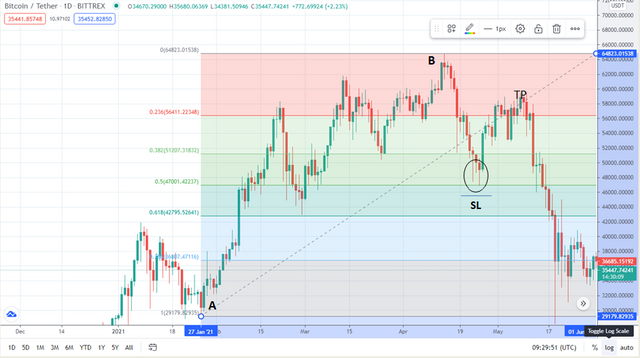
The following Screenshot showases BTC/USDT pair on a day trading chart. I located 2 points (Previous lower point and the most recent high point) tagged each of them with letters A&B. To find out the retracement level at point B, You plot the Fibonacci retracement levels from point A to point B as shown below.
From point B, the market price retraced up to 50% Fibracement retracement level. Take note of the price action at that level (there are long wicks that signaled a price rejection of lower prices and indicating that the price had just completed its temporal reversal and was getting ready to resume its major trend (Uptrend). Therefore, the circled area was a good buying position which was also confirmed by a strong bullish momentum candle signaling that the market price was heading upwards in a strong momentum.
Traders had to collect their profits at "TP" on about 1:2 risk-reward ratio. As traders kept looking for another retracement, the markets instead changed direction (reversed) into a strong downtrend. They noticed that when the market price retraced beyond 50 & 61.8%. They then had to position themselves for selling opportunities in the new direction(downtrend) of the market.
For a Downtrend, you will have to begin with a previous higher price point (Pick price) to the most recent lower price point (bottom). Here you want to know the levels of the temporal trend reversals so that you go for a good short position as the market resumes its strong downtrend. Your take profit target should be set on a 1:2 ratio.
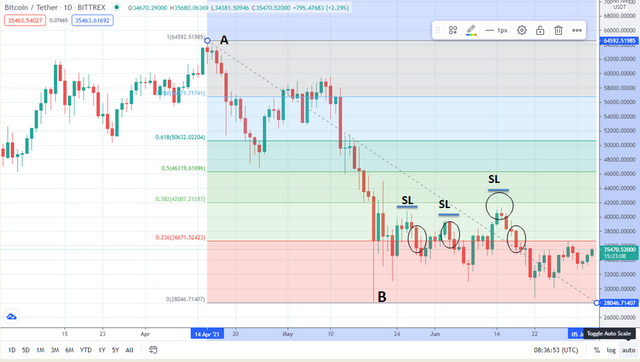
The screenshot below is a BTC/USDT pair on day trading chart. For the past weeks BTC has been in a stong downtrend. I located 2 points on the chart that is the previous top price and the most recent bottom price. I then plotted the Fibonacci retracement levels starting from the Top price to the bottom price indicated as "A&B." The market price has so far managed to retrace around 23% Fibonacci retracement level. We can take advantage of that retracement since its now acting as our resistance line.
The circled areas show selling opportunities as the price retraced (reversed temporarily) before resuming with the major downtrend. I have indicated the areas where you can set your stop loss(SL) as you go short in a bid to collect some profits. You should also have your target profits set on at least 1:2 reward ratio.
Trade Fibonacci retracements in combination with other trading indicators such as Price action (candlestick patterns) to increase the probability of having more profitable trades.
Homework task
- What are Fibonacci Retracement levels?
b. Practically demonstrate your understanding of the Fibonacci retracement levels using a Crypto trading chart of your choice. (Use trading view)
Here is what I will basically look out for in your work
- Interpretation of the information on the charts in relation to trading with the Fibonacci
- How you plot the Fibonacci retracement levels on the chart.
- Your Entry and exit strategy(price action, retracement levels)
- Trade management
- Other indicators used while trading with the Fibonacci retracement.
- Screenshots used
Rule and guidelines
- Post your homework article in the steemit Crypto Academy
- Only steemexclusive articles will be curated
- Your article should range between 300 – 1000words.
- Use an exclusive tag #yohan2on-s3week2 and also tag me @yohan2on so that I can easily find your article.
- Clearly reference your work in case you have directly borrowed any content from other sources. Otherwise, be original and as creative as possible.
- Plagiarism and spinning of other users’ articles will not be tolerated in the homework task. Otherwise repeat offenders will be blacklisted and banned from the Crypto Academy.
- Use only copy-right free images and showcase their source.
- To participate in this task, you should have a minimum of 250SP and your reputation score should not be less than 55.
- This homework task runs till 10th/07/2021, Time: 11:59 pm UTC.
my homework task.
https://steemit.com/hive-108451/@hibbanoor/crypto-academy-season-3-week-2-homework-post-for-professor-yohan2on
Hello prof. Here's my assignment post
https://steemit.com/hive-108451/@uchescrib/crypto-academy-season-3-week-2-homework-post-for-yohan2on
You have done well with this lecture prof. I love the way you split the explanation. Thanks a lot for the good work. My entry will land before the deadline. One love
Okay, thanks for the appreciation. I will be eagerly waiting for your work.
Great lecture. Thanks very much Prof.
Thanks so much for the appreciation.
I want to joy this program. But my report issued is less than 55. So I think early I will participate this community very early. I think ok this is very very amazing for us
Hello professor @yohan2on here's a link to my Assignment
Thank you
Professor,
I think you misplaced retracement levels C & D in the downward trend( refer to 1st photo of article).
I think C & D are placed at the upper spikes of price movement.
Correct me if I am getting it wrongly.
It is a great lecture that explained complicated things in a simple and precise way.
Thank you!!!
Hi
Thanks so much for that observation. I have rectified it. I am looking forward to your work.
hello, prof. here is my homework post:
https://steemit.com/hive-108451/@unyime/crypto-academy-season-3-week-2-homework-post-for-yohan2on-fibonacci-retracement-level
Hello Professor @yohan2on. I really enjoyed your class. Please sir, here is a link to my assignment.
https://steemit.com/hive-108451/@whileponderin/crypto-academy-season-3-week-2-homework-post-for-professor-yohan2on-topic-trading-with-the-fibonacci-retracement-levels
hello professor
here is my assignment link.
Hope you have a good read