Technical Indicators.-Crypto Academy / S4W2- Homework Post for @reminiscence01".
Hello Steemians!
I hope you are doing fine in your respected life. I hope you are keeping your health in this pandemic as first priority. This is my homework post on Technical Indicators provided by our professor @reminiscence01 . So let's get started.
Question no 1(A)
a) In your own words, explain Technical indicators and why it is a good technical analysis tool.
According to me and the knowledge I have gained from the professor explanation, technical indicators really help us predicting its price, or I can also call it the next movement and strategy on the chart. The indicator is really a handy strategy to apply to trade because they make trading a lot easier and the trader is more confident while using the technical indicator. Basically technical indicators come up after the psychology of others, here I mean that the indicator has all the information of other traders that how to used their strategy in the market for trading.
As our professor explained in the homework post that the indicators are created by an idea of price data points means that the indicator generates a great future signal by knowing the bid-ask price or buying and selling price from other trades of traders.
yes, it is a good analysis tool., it really helps in predicting the future price but it cannot be correct all the time because the market also depends upon other things that's why we cannot rely on it . But we can take the suggestion of price from it, it makes the trader more confident.

b) Are technical indicators good for cryptocurrency analysis? Explain your answer.
The same goes here as I explained earlier in the above part that technical indicators really help in predicting future prices, so does it help us in cryptocurrency trading for future price signals.But the person or the trader in crypto currency cannot rely on it all the time. the trader's personal analysis is required and after that, he may take the future signals from the indicator to confirm it and be confident about his analysis for trade.
C) Illustrate how to add indicators on the chart and also how to configure them. (Screenshot needed).
To illustrate how to add indicators I went to this website called "trading view" where I am registered. It is a great site to practice with indicators for trading.
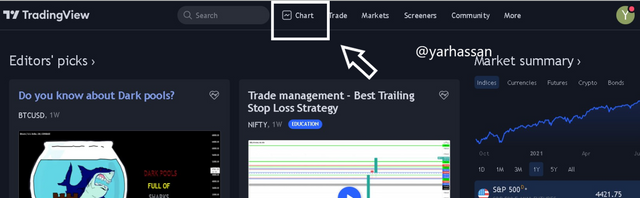
Firstly I went to select the chart, to proceed to the chart portion where we will apply indicators
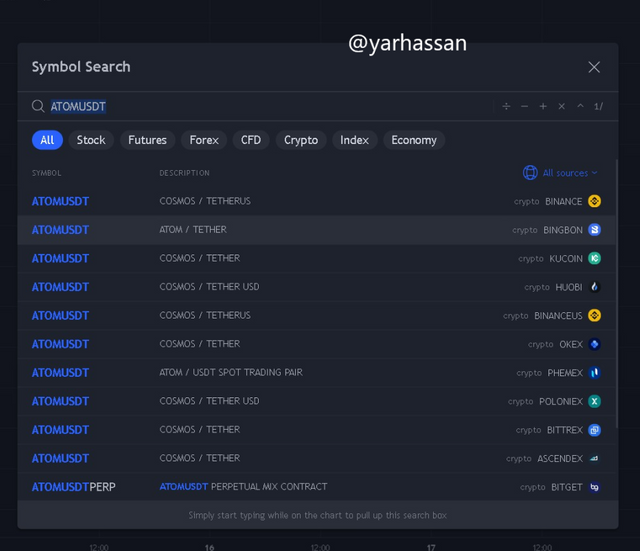
After that, I selected the coin that I want to use for trading purposes.
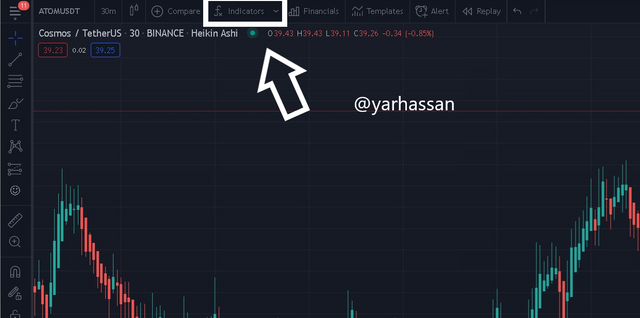
After that, as you can see in the picture that I clicked on the indicator button from where we get to select indicators.
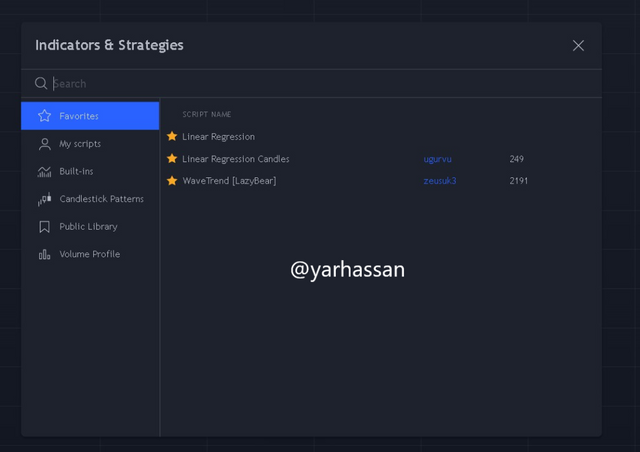
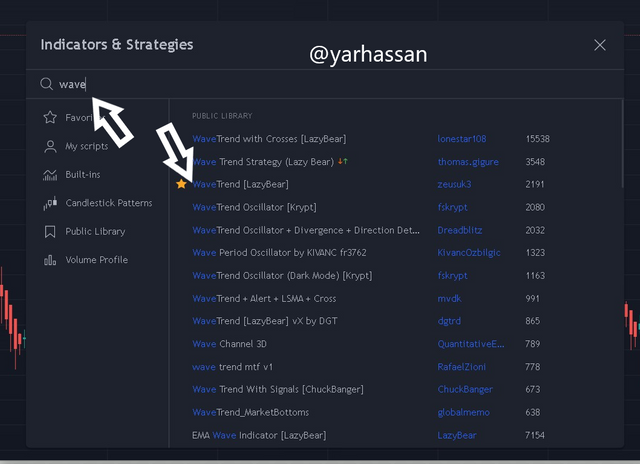
As you can see in the picture that I have selected the indicator. when I click on it the indicator is applied.
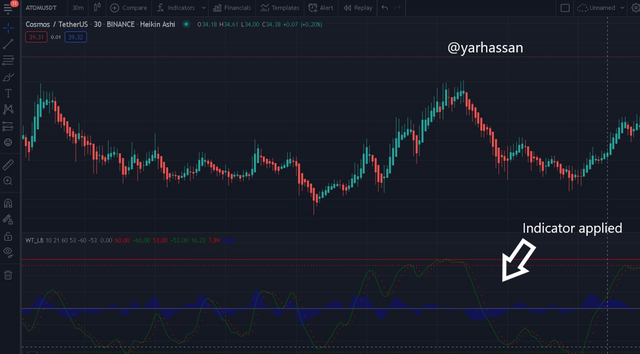
you can see in the above picture that the indicator is applied and it is in the form of a wave. The area above the white line is for selling and the area below the white line is for buying.
Question no 2
a) Explain the different categories of Technical indicators and give an example of each category. Also, show the indicators used as an example on your chart. (Screenshot needed).
There are three types of indicators that are used;
- Trend based indicator
- Volatility Based indicator
- Momentum-Based indicator
Trend based indicator:
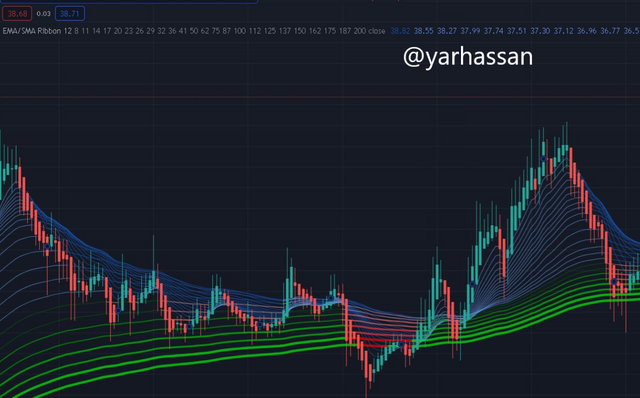
According to the explanation provided by our professor and my research, the trend-based indicators are those indicators that follow market trending strategy, they are also known as trend-following indicators. It helps the traders to get in the flow of trends going through the market. through this indicator, you can predict that how much longer the trend will carry on the market.
Example:-
Moving Averages ( Simple/Exponential).
Trading view
Volatility Based indicators:
The volatile-based indicators are simply that works for market swings mean uptrend or swing and downtrend or downswings. These indicators are used to analyze the fluctuation issue in the market the bullish and bear behavior of the market. these indicators are really helpful for traders to buy at a low price and book a huge profit by selling at a high price.
Example:-
Average True Range (ATR)
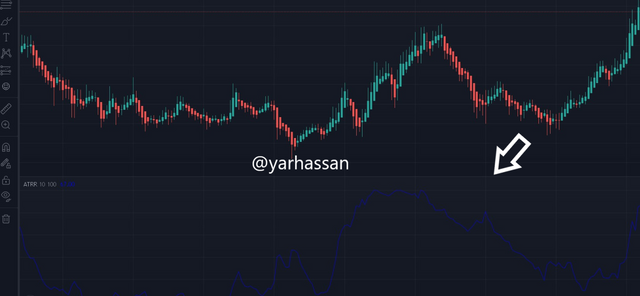
Trading view
Momentum-Based indicators:
The second name of momentum-based indicators is Oscillators. These types of indicators help us to study that how far the asset can go in its high swing and if it is worth it to buy it in its high swing or not. It helps us to understand whether it is overrated for its price or not.
Example:-
Moving Average Convergence Divergence (MACD)
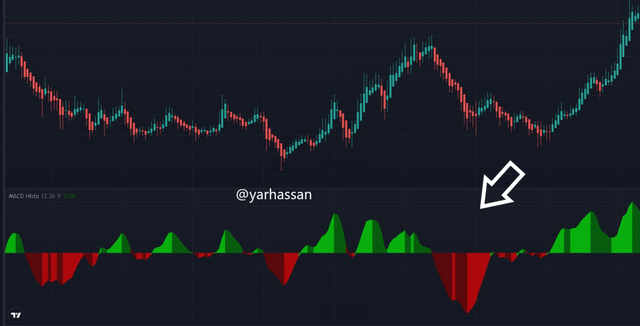
Trading view
b) Briefly explain the reason why indicators are not advisable to be used as a standalone tool for technical analysis.
As I have explained in question one that indicators are not advisable to be used as a standalone tool for technical analysis
because Technical indicators are quite useful in anticipating future prices, and they may also be used to predict future price signals in cryptocurrency trading. However, a cryptocurrency trader cannot rely on it all of the time. The personal examination is necessary of the trader, after which he may take future signals from it.It can't be true all of the time because the market is also influenced by other factors, so we can't rely on it. However, we may take the price suggestion from it, which gives the trader greater confidence.It can't be true all of the time because the market is also influenced by other factors, so we can't rely on it. However, we may take the price suggestion from it, which gives the trader greater confidence.
c) Explain how an investor can increase the success rate of a technical indicator signal.
An investor can increase the success rate of a technical indicator signal by doing his own technical analysis. He should study and make a technical analysis of his own by searching the market trends and other things and after that, he should take help from indicators to confirm his technical analysis.
Conclusion :
I conclude my post with the homework provided by our professor was very well explained and it was a wonderful overview. I learned new things about technical indicators and their types. And I'm looking forward to a new homework post from our professor.
Hello @yarhassan, I’m glad you participated in the 2nd week Season 4 of the Beginner’s class at the Steemit Crypto Academy. Your grades in this task are as follows:
Recommendation / Feedback:
Thank you for participating in this homework task.