Steemit Crypto Academy Season 4- Dynamic Course for Beginners - Week 2 | Basic trading strategy using the Harmonic AB = CD + Fibonacci pattern
Logo made on Wix logo maker
I hope you are doing fine in your respected life. I hope you are keeping your health in this pandemic as first priority. This is my homework post on Basic trading strategy using the Harmonic AB = CD + Fibonacci pattern in provided by our professor @lenonmc21. So let's get started.
Q1 Define in your own words what Harmonic Trading is?
As we all know, analysis plays a critical role in the market. It's either cryptocurrency or stocks. The analysis is crucial, and it is also necessary to reach the profit level. We all know that there are two sorts of market analysis. Fundamental analysis is the first, while technical analysis is the second. However, today's topic was Harmonic Trading Analysis.
Harmonic trading is a sophisticated technical analysis approach that allows traders to profit. However, this trading analysis is unique in that it is based on Fibonacci retracements. Fibonacci retracements are a basic word that refers to the collection of previous market data, both up and down. and it predicts what will happen in the future based on this information.
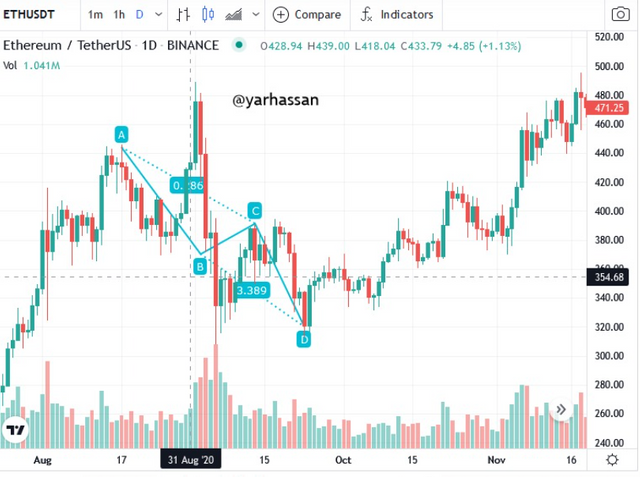
Harmonic trading works in the same way as it does in our everyday lives. It is based on past highs and lows. Cycles are the term for these highs and lows. This cycle established the trend. as well as lows See the graph for a better understanding.

Q 2 Define and Explain what the pattern AB = CD is and how can we identify it?
This tool is created by the HM Gartley. this is an advanced technical analysis tool. with the help of this tool, we can draw wave-like patterns to initiate our trade. now, let's discussed what are the ABCD and how we can identify it. so, the answer is very simple. there are 4 Movements patterns known as A, B, C and D. these four movements set the position of buying and selling long. if the price is low so, there is the possibility it goes up. and similarly, when the price is high, so it's reverse happen price goes down.
In this wave-like pattern. they repeat themselves again and again so, here we need to practice ourselves what is the buying or the selling position. the position clarifies the bullish or the bearish candles. this wave-like pattern is also used for stock or forex markets. the scenario is the same and also the pattern is the same.
how can we identify it?
There are two types of identification. the very first is in the Bullish Scenario and the Second is the Bearish scenario. let's discussed both of these, one by one.
Bullish AB=CD:
In Bullish AB=CD we have to must identify the point at which the price is lower lows. and at this point, we draw the 4 points. A, B, C, and D. the point C is the very critical point.
Bearish:
the 4 developments are going in reverse. Check the legitimacy of developments with the "Fibonacci Retracement" procedure.
Q3 Clearly describe the entry and exit criteria for both buying and selling using the AB = CD pattern?
Entry Criteria (Buy and Sell):-
To establish our first initial configuration, identify the four points A, B, C, and D.
We must validate that C of the Fibonacci Retracements is between 61.8 and 78.6.
For the four points to be legitimate, D must be between 127.2 percent and 161.8 percent.
If this does not occur, we must ignore this pattern because it is invalidated, and we must hunt for another AB = CD pattern combination.
We enter the market as soon as point D converges with our Fibonacci levels of 127.2 percent and 161.8 percent and the price start to form a bearish candle.
Exit Criteria (Buy and Sell):
- To exit the market, the ideal is that we arrange our "Stop Loss" with 2% above or beneath our point D, to enter the market. on the off chance that we have a danger of 2% above or beneath our point From the passage point, which is point D, our "Take Profit" should be 2% away from it.
Q 4 Make 2 entries (Up and Down) on any cryptocurrency pair using the AB = CD pattern confirming it with Fibonacci.
you can see I'm using AB=CD in a Bearish trend
Using AB=CD in a Bullish Trend
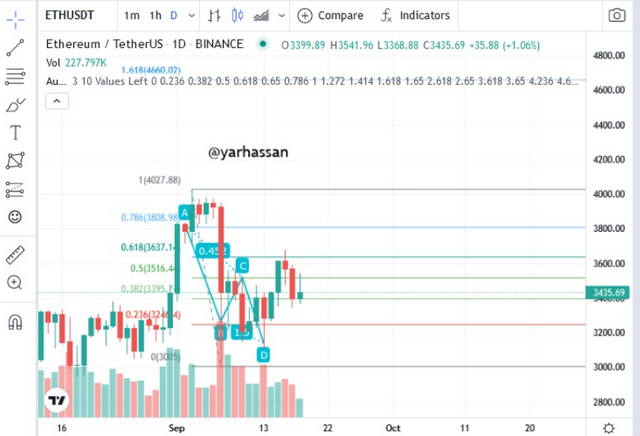
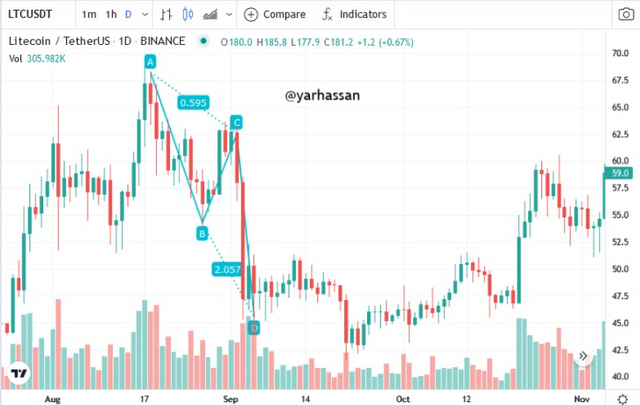
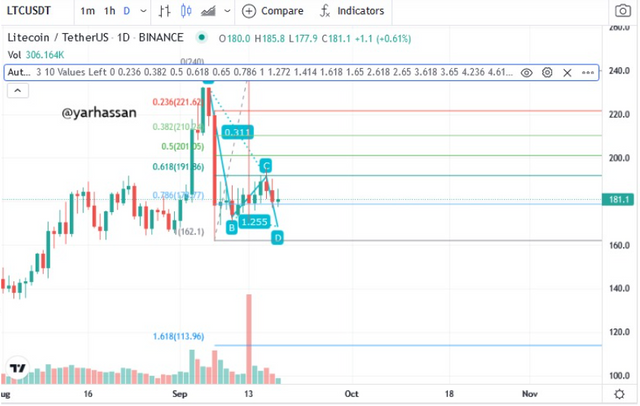
the coins I used in these pictures are Ltcusdt and Ethusdt.
Conclusion:
I conclude it with that We saw that with the AB=CD pattern that in a next bearish candle to sell and in a next bullish candle to buy. Harmonic Trading is a technical analysis that deals with price patterns and the repetition of market cycles, and we saw that with the AB=CD pattern that in a next bearish candle to sell and in the next bullish candle to buy. Although it was a very well explained homework from our professor.