Heikin-Ashi Trading Strategy || Crypto Academy /S4W2 || Homework Post for Professor @reddileep.
Hello Everyone:
myself @yarhassan today, I read the new trading strategy article which is delivered by prof. @reddileep. in this article prof. explains each and everything about Heikin-Ashi Trading Strategy and how to improve this strategy with 55-EMA. so, let's starts with today article:
Created on canvas
1. Define Heikin-Ashi Technique in your own words.
The origin of the Heikin-Ashi technique is from Japan in the 17 century. it is a modified version of the Japanese Candlestick charts. but it is slightly different because in candlestick the next candle is formed by the market trends either it is uptrend or downtrend. but if we saw the Heikin-Ashi it reduces the noise and ignores them. this Heikin-Ashi technique highlight all types of trends in a more clear way.
with the help of this technique, the appearance of the chart is very clear or we can say that more smoother. which is very easy to understand to the trader to take the next step about the market trends and reversals. this technique reduced the difference between the price and the market data.
Heikin-Ashi technique is also applicable to the forex and stock market. working is the same for both of these markets. I will show you the graph of the Heikin-Ashi pattern.
2- Make your own research and differentiate between the traditional candlestick chart and the Heikin-Ashi chart. (Screenshots required from both chart patterns)
As I previously discussed that this pattern is the same as the candlestick pattern. but Heikin-Ashi is slightly different first, I will show you the graph so, you have been clearly seen whats the difference b/w is. and then I will describe the difference b/w them.
In my scenario, I will consider the Cardano Ada chart in 1 min time frame.
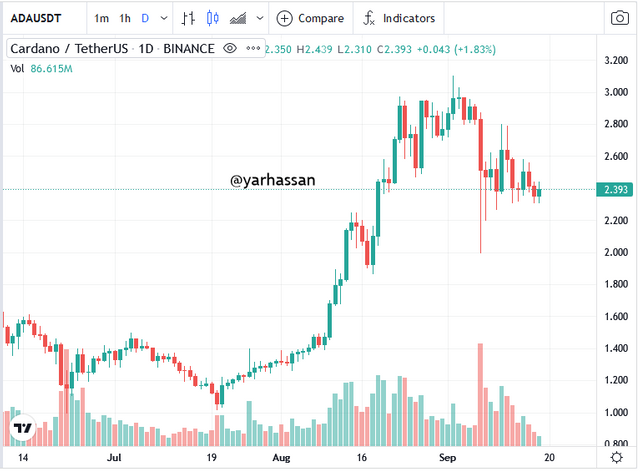
Simple candlestick chart edited on coinmarketcap.
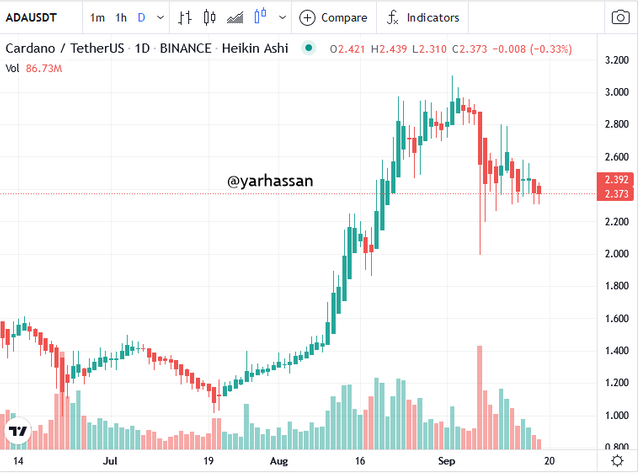
Heikin-Ashi chart pattern same time frame.
In both of these charts, I have noticed the following points. let's discussed:
traditional candlestick chart:
it is a very simple chart pattern. even when a price is slightly changing the colors of candles are also change. which is very confusing to a trader to take the trade.
The impact of the very small amount of the price is very fast even the slightly different price is increasing or decreasing the colors of candles become red or green.
traditional candlesticks pattern the new candle is open when the previous is closed.
The price of the traditional candlesticks is the same as the current price of the market.
Heikin-Ashi candlesticks pattern:
this chart pattern is a bit change as compare to the traditional candlesticks. the specialty of this chart pattern is that they do not change its color and properties immediately.
this chart pattern ignores all types of noises b/w the candles. and make it more clear to its user by taking the average price.
Heikin-Ashi chart pattern opens the new candle by taking the previous candle data in the middle.
Heikin-Ashi chart pattern considers the average price it doesn't take any type of current market price.
3. Explain the Heikin-Ashi Formula. (In addition to simply stating the formula, you should provide a clear explanation about the calculation)
In the Japanese candlestick pattern, there are four states open, close, low, and high, and these all steps identified the price value of assets. similarly, in Heikin-Ashi the same scenario is applied to it, but a slight change in Heikin-Ashi it takes the average value of candles .
first, of all, we need to identify the opening of the candle. here it is the formula:
open = (Open of a pre candle + close of a pre. candle)/2
open:
it is a value that takes the data of the previous candle both in opening and close.
close:
close = (open of current+high of current+low of current+close of current)/4
The close of the candle is captured by sum up of open, high, low, and close and divided by four. note that all terms are in the current candle.
high Candle:
high = maximum of current candle(high, open, close)
The high of the candle is obtained by the maximum of high, open, and close.
Low Candle:
Low candle = minimum of the current state of the candle(low, open, close).
The low of the candle is obtained by the current of the minimum candle.
4. Graphically explain trends and buying opportunities through Heikin-Ashi Candles. (Screenshots required)
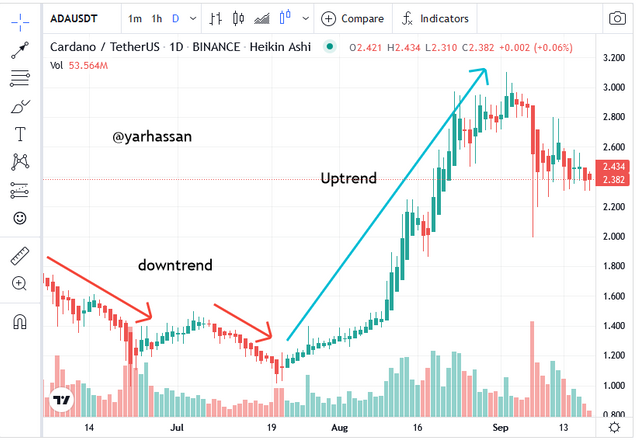
Trends
In Heikin-Ashi trends, the trends are clearly identified because the Heikin-Ashi provides a better UI experience to its user and also reduces the noise in the market. the unique property of the Heiken-Ashi is considered the average price in the market that really helps us to identify the trends and reversals.
In my view, the one of the most important or the unique feature of the Heikin-Ashi is that, its show the strength of the trend through its shadows. if we see a green candle in Heikin-Ashi so, we don't have the lower shadows that really help us to identify that it is a very powerful bullish trend.
see in the graph, so, you understand better.
The opportunity of buying trade:
With the help of the Heikin-Ashi pattern, we can identify that what is a good time to enter the market and also what is a good time to exit the market. In the Heikin-Ashi pattern, the main point is the shadows in the Bullish market. if the bullish trend is reverse the bearish trend comes in the bearish trend the shadows appear below the candle. here is one more candle that's called the indecisive candle. if this candle appears so, it means you have the perfect time to consider, a buy trade.
see in the graph:
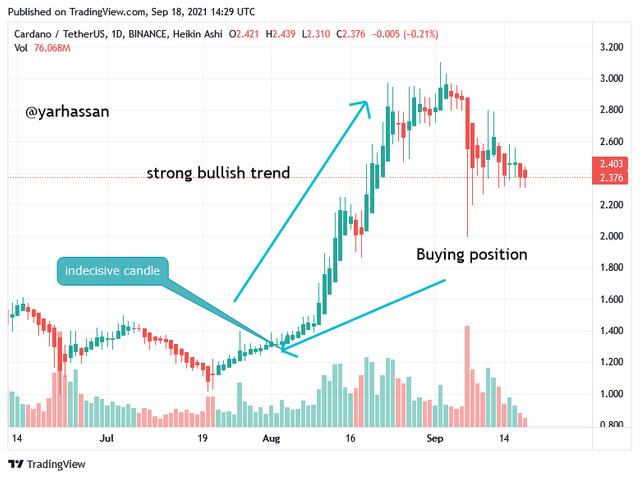
In the above picture, you will clearly see the strong buying position. that's the point is the point that help's you to take the trade.
5. Is it possible to transact only with signals received using the Heikin-Ashi Technique? Explain the reasons for your answer.
my answer is yes, the reason is Heikin-Ashi provides better signals to its trader. but, sometimes it is not good because of the market situation. so, at this point, you will use the pair of another indicator. so, then you will have a good signal to consider your trade and make this trade as simple.
the pairing indicator which we will use in our Heikin-Ashi based trade is the Exponential Moving Average EMA. basically, it has two types one is 55-EMA and another its 21-EMA. if you apply this indicator in your Heikin-Ashi trade so, you will clearly identify the false signals and omit them.
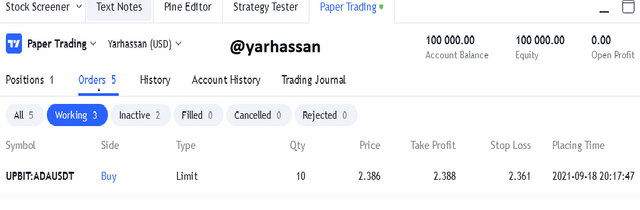
6. By using a Demo account, perform both Buy and Sell orders using Heikin-Ashi+ 55 EMA+21 EMA.
Buy trade of Ada Cardano:
In my scenario, I would consider Ada Cardano. after selecting this coin I set an indicator EMA-55 or 21. after all of this stuff I would log in to my trading view account and select the paper trading.
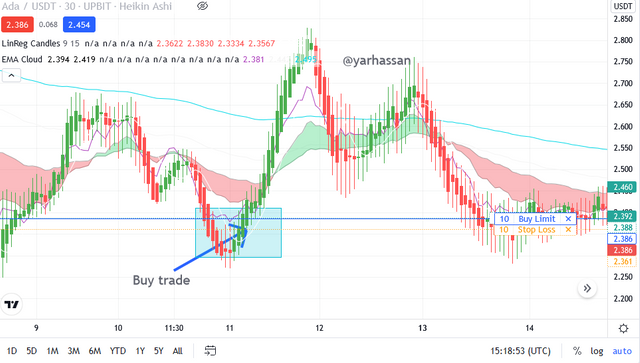
Trade execute:
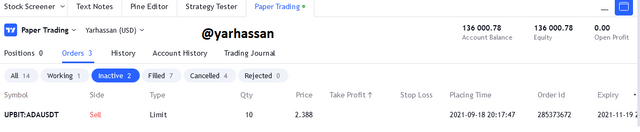
Sell trade of Ada Cardano:
In my scenario, I would consider the same Ada Cardano. after selecting this coin I set an indicator EMA-55 or 21. after all of this stuff I would log in to my trading view account and select the paper trading. here is the snap:
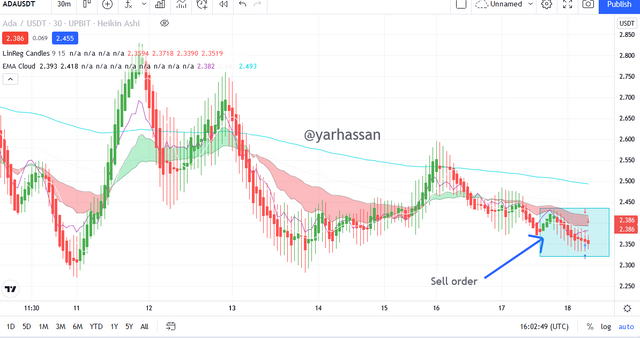
Trade execute:
Conclusion:
In the end, I would say that this trading strategy is really helping me as a newbie trader. In the whole post, I learn new concepts and also learn what is the difference b/w Japanese candlestick and Heikin-Ashi. so, that's it for today's post catch you guys in the next post.

regards:

#reddileep-s4week2 #cryptoacademy #heikin-ashi #trading-strategy #pakistan