Crypto Academy Season 4 | Intermediate Level Course for Week 5 : [ Trading with Accumulation / Distribution ] by @allbert
made on @canva
Hello Steemians!
I hope you are doing well in your life. I hope you are keeping your health in this pandemic as first priority. So this is my homework post for @allbert. The topic today is Trading with Accumulation / Distribution (A/D) Indicator, so let's get started.


QUESTION 01
Explain in your own words what the A/D Indicator is and how and why it relates to volume. (Screenshots needed).
ANSWER:
The A/D indicator is a commonly used indicator by traders in technical analysis developed by Marc Chaikin. Though it may not be that efficient in giving out sharp signals, it is still quite popular and useful when it comes to spotting possible reversals and identifying strong and weak trends or the market and is very useful in spotting divergences too. The A/D is quite indicator if you ask me because it determines the volume of money flowing in or out of an asset. Let us dig deeper and find out more about this indicator.
ACCUMULATION AND DISTRIBUTION CYCLE
Among many cycles of the market there is another cycle termed as accumulation and distribution cycle. The both words are quite opposites of the other.
"Accumulation" means gradual gathering of something, and it is quite the same in financial terms too and can be interpreted in these types of markets as the gradual gathering/building or in other words buying of a certain asset to take its price up in an uptrend. These little by little building of volume of money in an asset is what's called "Accumulation"
The exact opposite of Accumulation is Distribution
"Distribution" means sharing out or giving something and in financial terms and especially in the A/D indicator it means the volume of money outflowing of an asset to give the asset a bearish trend. It is the same as accumulation but just the opposite which is the gradual selling or in other words distribution of an asset. This little by little flowing out of money and decreasing volume is called "Distribution"
How and why it relates to volume?
Well the answer to this question is quite simple that is when the money flows in a certain asset, it builds the volume of that certain asset too and when it flows out of the asset, the volume of that certain asset experiences a downfall or decrease in volume
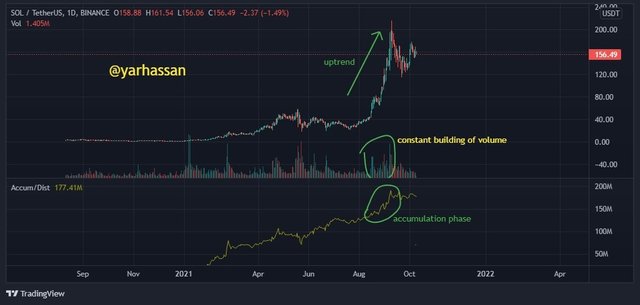
screenshot taken from @tradingview
we can see here in this screenshot it is quite clear when the Accumulation period of Solana started and then the constant building of its volume and a visible and massive uptrend in its price. This all points out towards the Accumulation phase of Solana that the investors were flowing their money in this certain asset and keeping it there. The same goes for the Distribution phase contrary to the above one the volume decreases here and the selling of the asset increases.
QUESTION 02
Through some platforms, show the process of how to place the A/D Indicator (Screenshots needed).
ANSWER:
I will be using my favorite platform @tradingview for this one.
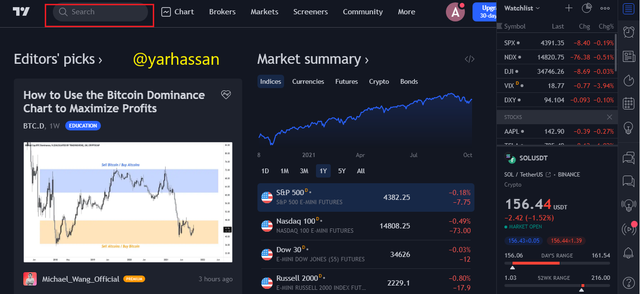
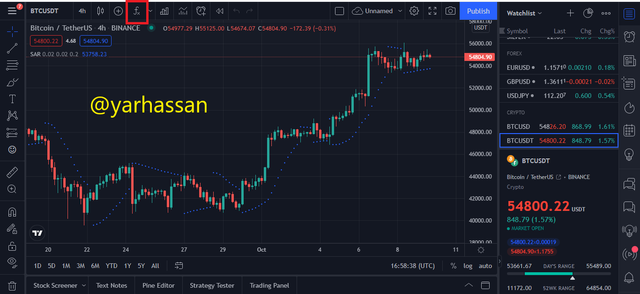
- Open tradingview on your desktop or on you mobile phone (I'll be using my desktop) and on the top left corner there is a search bar, select it.
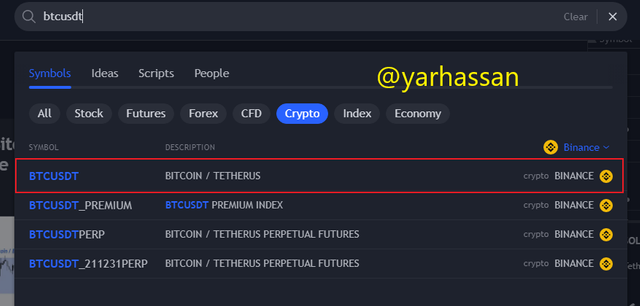
- Search the pair of your choosing (I'm choosing BTC/USDT).
- On top there is a panel which has fx (indicators and strategies) written on it, select it.
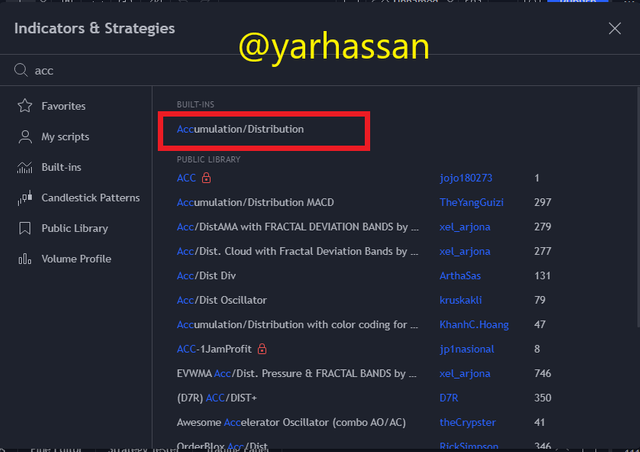
- Search Accumulation/Distribution, click on it.
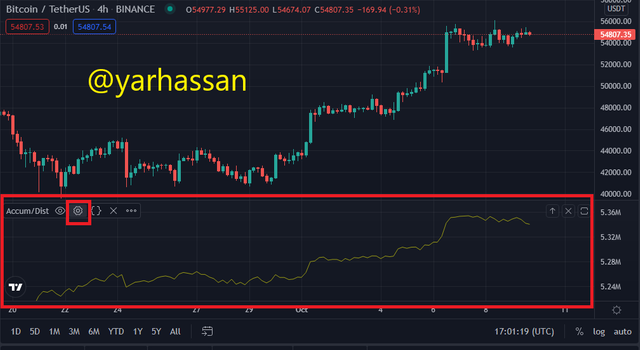
- The indicator is applied on the chart, now there is a settings option on it, select it.
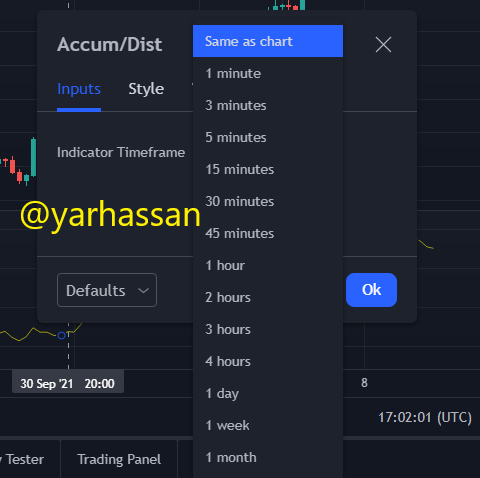
- This popup will open with three options namely inputs, style and visibility (style and visibility are like every other indicator that we've studied before), inputs has only one option which is the timeframe, choose the timeframe (I'm choosing same as chart)
QUESTION 03
Explain through an example the formula of the A/D Indicator. (Originality will be taken into account).
ANSWER:
The A/D indicator formula can be simplified if we break it into components.
The first one is Money Flow Multiplier (MFM)
MFM= (Closing Price – Low Price) – (High Price – Closing Price) / (High Price – Low Price)
The second one is Money Flow Volume (MFV)
MFV= MFM * volume at current period
The third one is Accumulation/Distribution line or A/D line
A/D line= Previous A/D + MFV
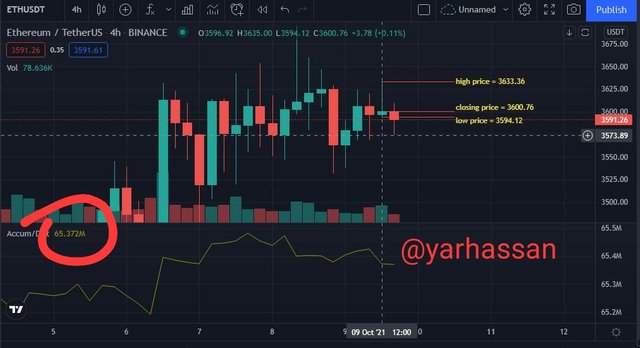
here the pair is of ETH/USDT and the prices are as following
high price = 3633.36
low price = 3594.12
closing price = 3600.76
we can calculate MFM from these prices
MFM= (3600.76– 3594.12) – (3633.36 – 3600.76) / (3633.36 – 3594.12)
MFM= 6.64 - 32.6 / 39.24
MFM= -25.96 / 39.24
MFM= -0.6615
now, to calculate MFV
MFV= MFM * volume at current period (at the time of writing it is 43.02)
MFV= -0.6615 * 43.02
MFV= -28.4607
To calculate A/D line now,
A/D line = Previous A/D + MFV
A/D line = 65.372 (can be seen in the ss above) + (-28.4607)
A/D line = 36.911
QUESTION 04
How is it possible to detect and confirm a trend through the A/D indicator? (Screenshots needed)
ANSWER:
A/D indicator works on the basic principle of volume of money flowing in or out of an asset. Which means it works on the basic principle of supply and demand like the price action of any stock, crypto or asset. The more money gradually comes in the more A/D indicator indicates the strong uptrend, vice versa for the distribution as we discussed earlier.
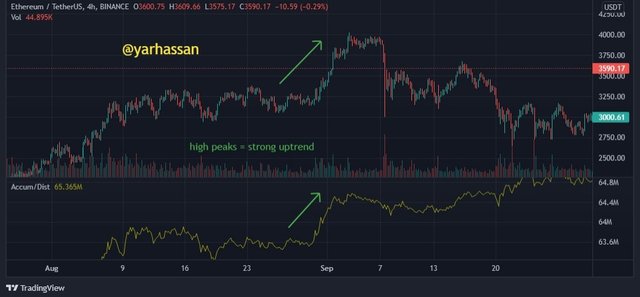
screenshot taken from @tradingview
here we can see in this screenshot that the A/D indicator is showing the strong uptrend movement with its high peaks and below is a screenshot for the bearish or downtrend.
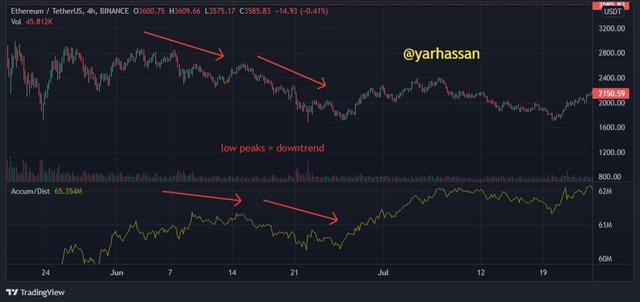
in this screenshot we can see that the price action of ETH/USDT is following a downtrend which means that the A/D indicator is in distribution phase right now and the same can be seen on the indicator's movement too.
QUESTION 05
Through a DEMO account, perform one trading operation (BUY or SELL) using the A/D Indicator only. (Screenshots needed).
ANSWER:
I have a demo account on OKEx, to take a trade we had to first recognize the divergences because the A/D indicator is quite useful when it comes to divergences and possible trend reversals of the market. For that purpose I opened ADA/USDT on @tradingview and below is the screenshot of that.
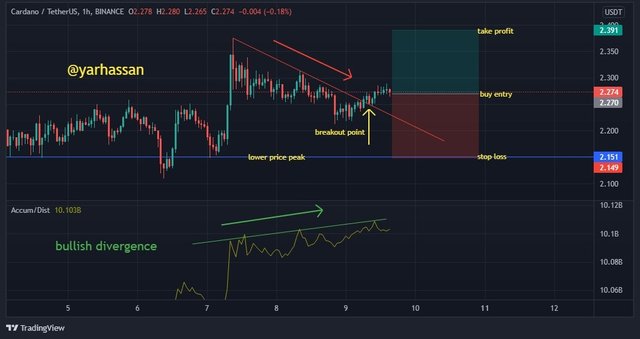
Ada showed a signal in confluence with A/D indicator, here we can see that the price action is downwards which is denoted by the trend line but the A/D indicator is moving in higher highs which is clearly showing a bullish divergence and Ada may breakout from here as it has already broke the trend line. So, I'll play safe and will buy the current market price and will take a risk to reward ratio of 1:1, the stop loss here is at the lowest peak point so it'll be more safe that way.
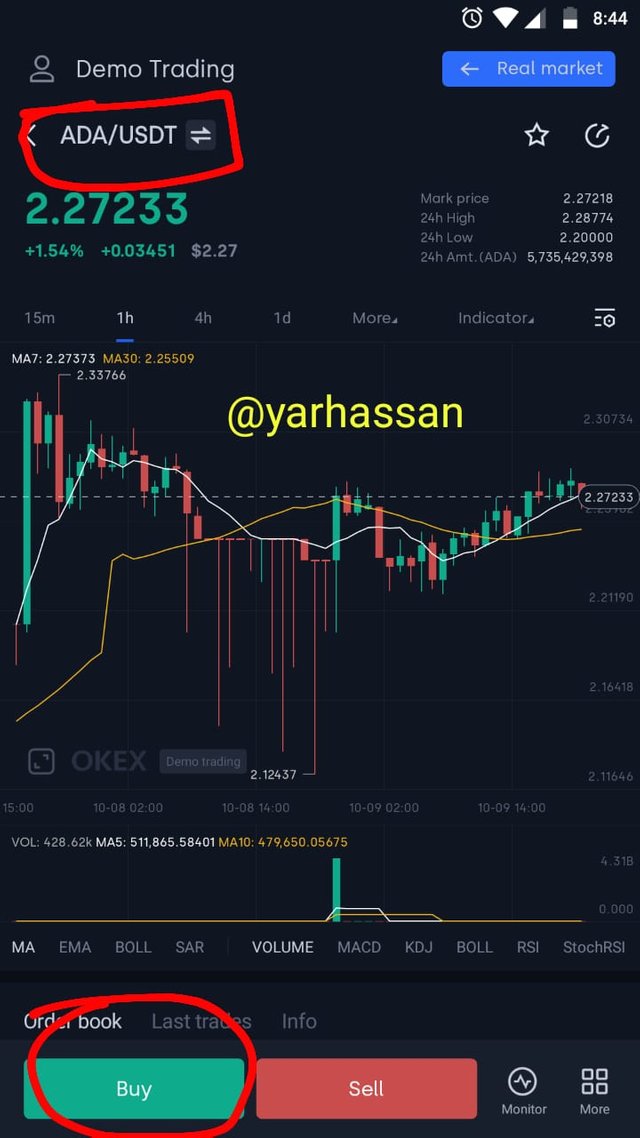
here I selected ADA/USDT on my demo account and then select buy.
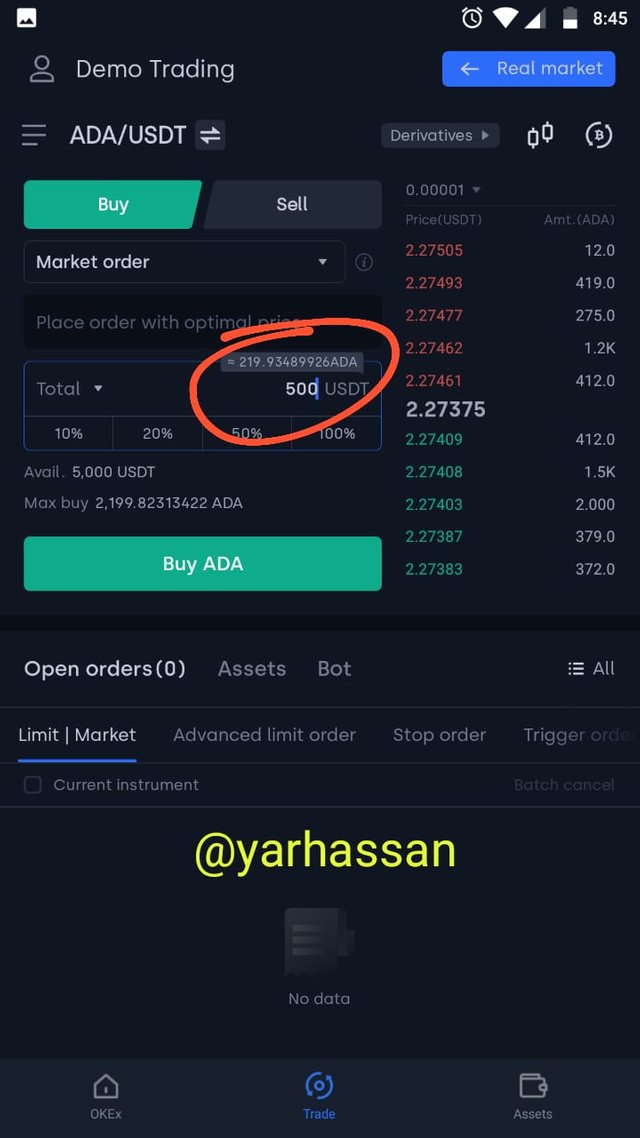
filled in the amount which is 500$ USDT which makes 219.93 Ada tokens, then select buy Ada
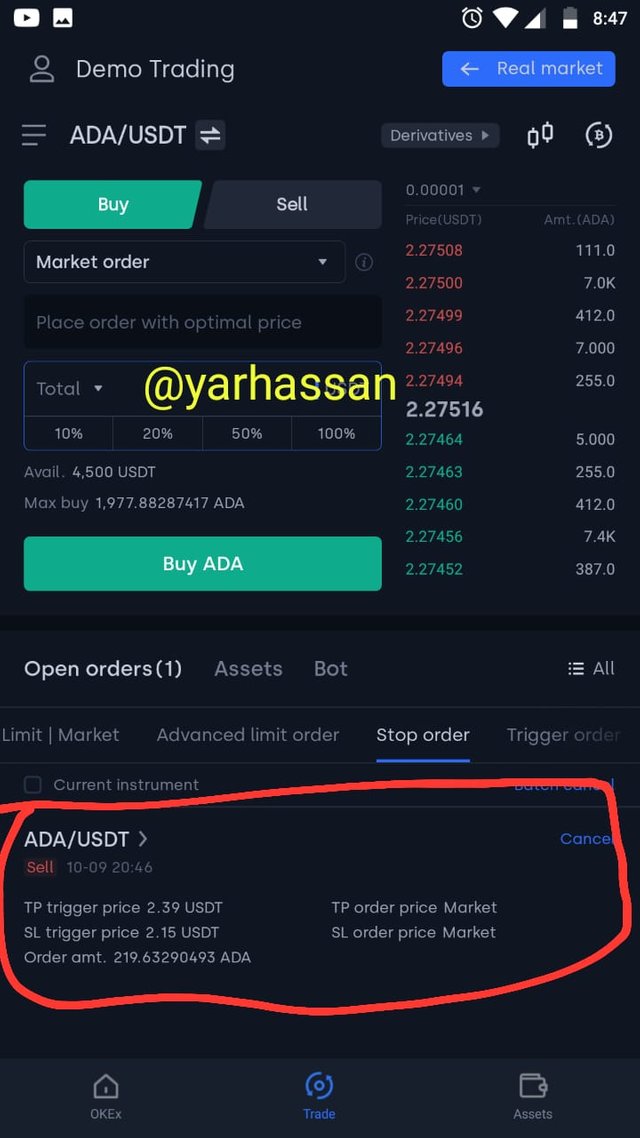
filled my stop loss and take profit limit which I showed in the earlier screenshot.
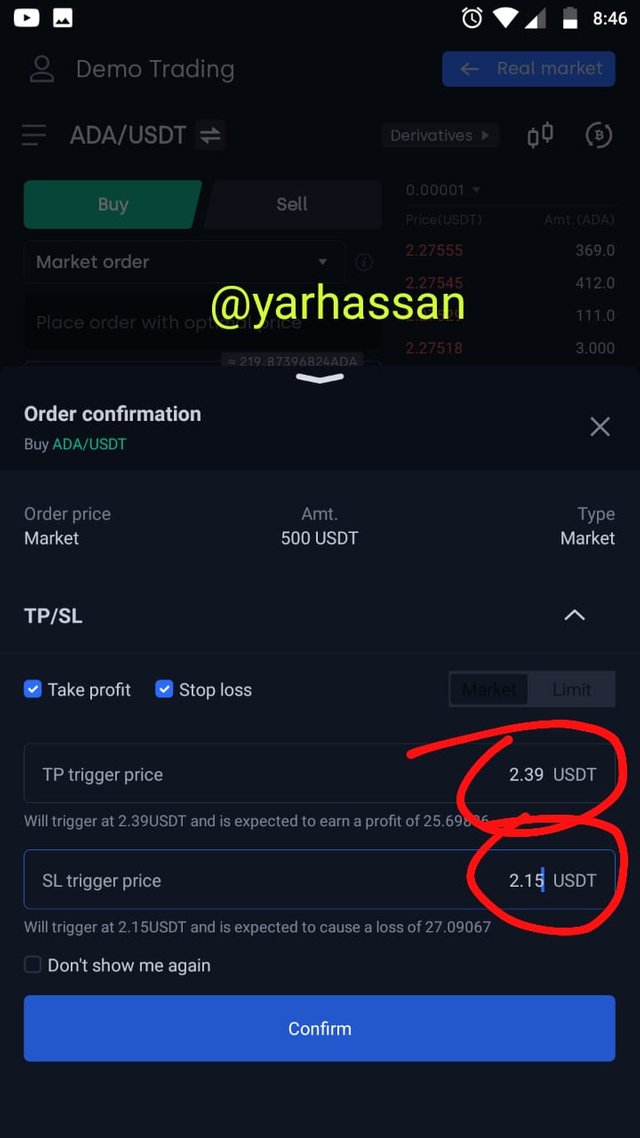
- the order is filled with SL/TP limits at 2.15 and 2.39 respectively
QUESTION 06
What other indicator can be used in conjunction with the A/D Indicator. Justify, explain and test. (Screenshots needed).
ANSWER:
Not every indicator is 100% correct. A/D has its own flaws too. It is not a sensitive indicator and does not react to slight signals. It takes its time and sometime even after a trend has started gives out the signal. We can also say that it is a lagging indicator. Its best use for spotting divergences, but this isn't true always too. Below is a screenshot of ETH/USDT.
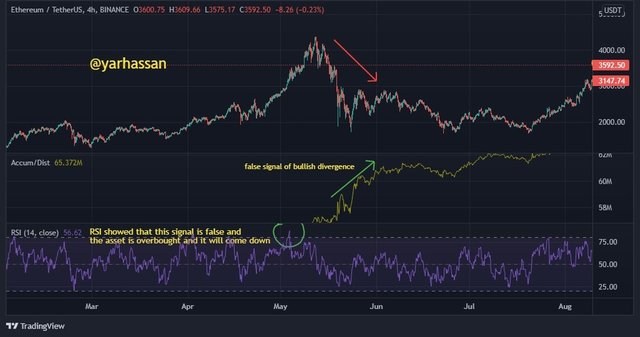
from this screenshot, we can see the importance of confluence in the crypto market as there are false signals every now and then. This screenshot clearly shows that A/D gave out the false signal of bullish divergence and upon doing confluence with RSI we filtered out the false signal and made the right decision to not enter the market.
CONCLUSION
A/D indicator as we learned today is a quite good one if we talk about the volume of money flowing in or out but it shouldn't be used alone but with the confluence of other indicators like RSI, Stoch, MFI etc. We learned that A/D indicator is used to understand the strong or weak trends of the markets, possible reversals, and breakouts and is very helpful in detecting divergences.