Crypto Academy / Season 3 / Week 8 - Homework Post for Professor @cryptokraze. Trading Sharkfin Pattern
Assalam-o-Alikum to all my Steemit Family:
I hope you are fit and fine and enjoy your life full of fun. yet, again this is me @yarhassan. today, I learned a new trading pattern. this article is delivered by prof. @cryptokraze. In this article prof. described the working of this new market chart pattern with full explanation. after reading this article I starts working on it.
so, without wasting any time let's get started:
Edited on Canva!

1. What is your understanding of Sharkfin Patterns? Give Examples (Clear Charts Needed)
The Cryptocurrency market is a highly volatile market. and due to this volatility, the risk factor is also high. to avoid these risk factors we introduced the different types of indicators. sometimes the market shows the Higher highs and sometimes the market shows the lower lows. both of these conditions can be determined through the pattern. one of the important chart patterns which we will today, discussed is "Sharkfin Patterns".
The Sharkfin Patterns make immediate. if the pattern starts lower lows to higher highs then it makes the V-shaped. and if the pattern starts from higher highs to lower lows then it makes the Inverted V. both of these patterns V and Inverted V is called the Sharkfin Pattern.
here, are some graphs that show of these V's.
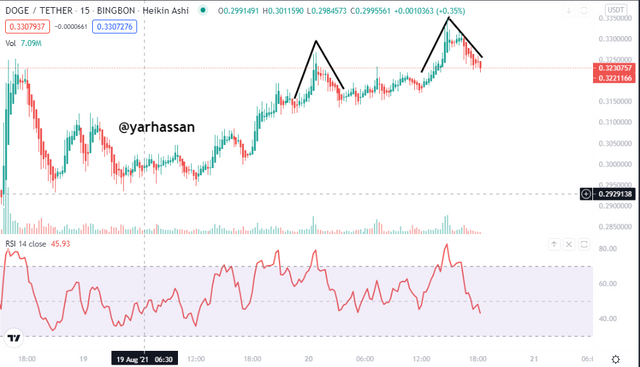
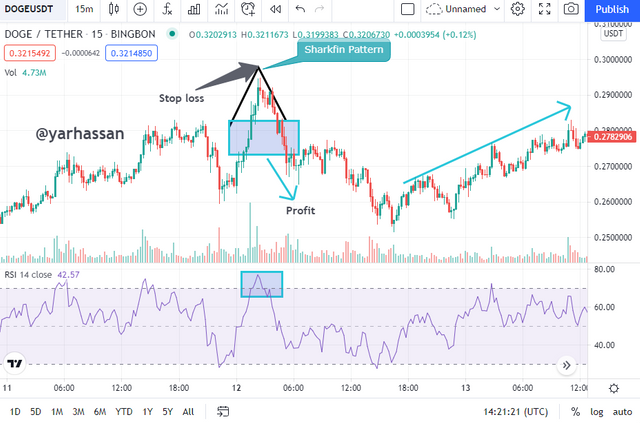
Figure 1.1
In figure 1.1 you will clearly see that the price is decreasing and Inverted V is formed. we can also say that the inverted V is a sign of a downtrend and this downtrend shows the bear market.
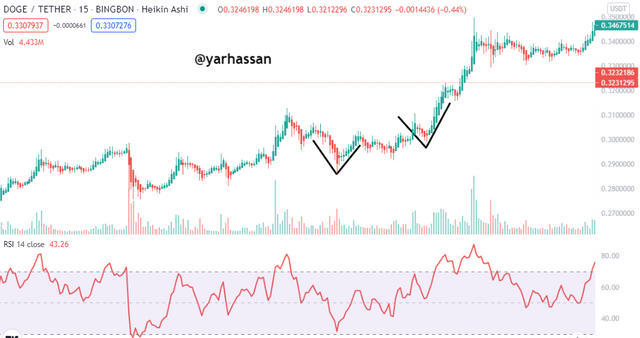
Figure 1.2
The figure 1.2 is the opposite of figure 1.1. In figure 1.2 the price is incresing and simple V is form. so, here we conclude that the possitive V is the sign of Bull market.
2.implement an RSI indicator to spot shark fin patterns. (Clear Charts Needed)
various types of indicators and chart patterns that help us to analyze the market in terms of technical analysis. many times in the chart the fake signal exists. due to this fake signal, many traders face losses. Sharkfins patterns are also facing fake signals. to avoid the fake signals we introduced the indicators.
To study the chart pattern in a more clear way the RSI indicator is used with the help of this indicator we avoid fake signals. and only observe the correct signals. RSI indicator applied with their default settings between 30 to 70 range. In this range(Lower and higher) we examine the pattern in a more clear way.
there are two possibilities of fake signals one is when the market is up and it generates fake. the second possibility is when the market is down and it generates fake signals. I will discuss both of this one by one:
Possibility # 01(When market in Uptrend and show fake signals):
In the very first case, the market is in a downtrend but this downtrend ends, and after this trend, the reverse trend is starting means the uptrend is starting. so, at the closing point of the red candle, there is the possibility that a fake signal is generate.
see in the graph:
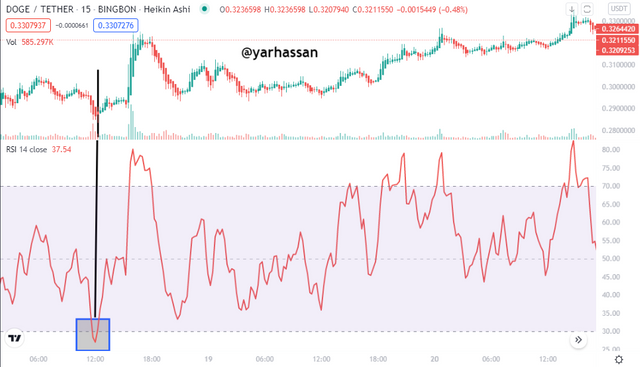
In the graph, you see when the market is in a downtrend so, it will face the fake signal because the range of RSI is below 30. so, here the trader waits to correct the market.
Possibility # 02(When market in Downtrend and show fake signals):
This occurs when the market ends with the uptrend. after this uptrend market will rebounce and starts going downward. at the point when it starts down so, there is a chance of a fake signal. because it starts downward.
see in the graph:
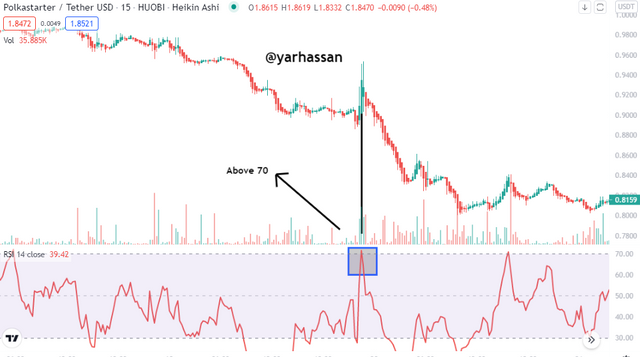
In the graph, you will understand what happens. the market is going up and again it starts going down. during this process we observed the chart with the help of RSI indicator. at one point it crosses its limits above 70. after some time it going down.
3.Write the trade entry and exit criteria to trade sharkfin pattern (Clear Charts Needed)
Trade Entry Criteria:
In trade the entry and exit point matters. the reason is that if you don't know what is the best point to take trade and what is the best point to leave the trade.so, your faces hurdles. so, as in the Sharkfin pattern. I will explain the best point in detail.
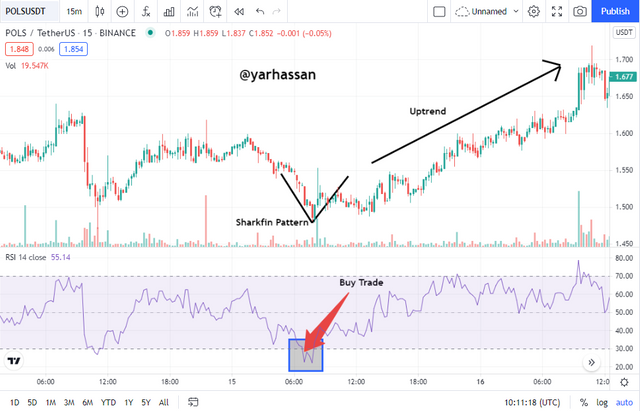
Trade Entry Criteria for Buy Position:
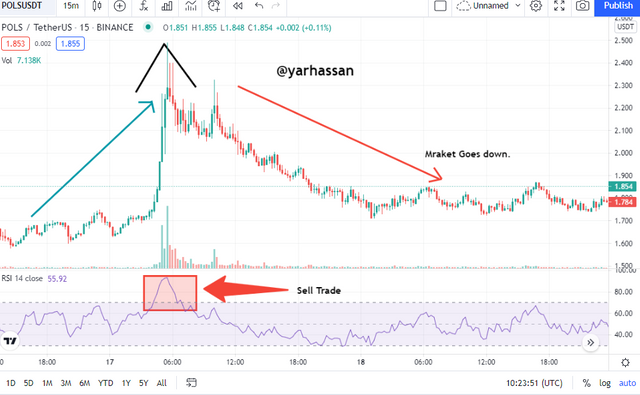
Trade Entry Criteria for Sell Position:
Trade Exit Criteria:
In the trade exit criteria. we deal with two terms stop loss and take profit.
For Buying:
Trade exit criteria:
Some important points regarding the trade exit criteria are as follows:
For Selling:
4. Place at least 2 trades based on sharkfin pattern strategy (Need to actually place trades along with Clear Charts)
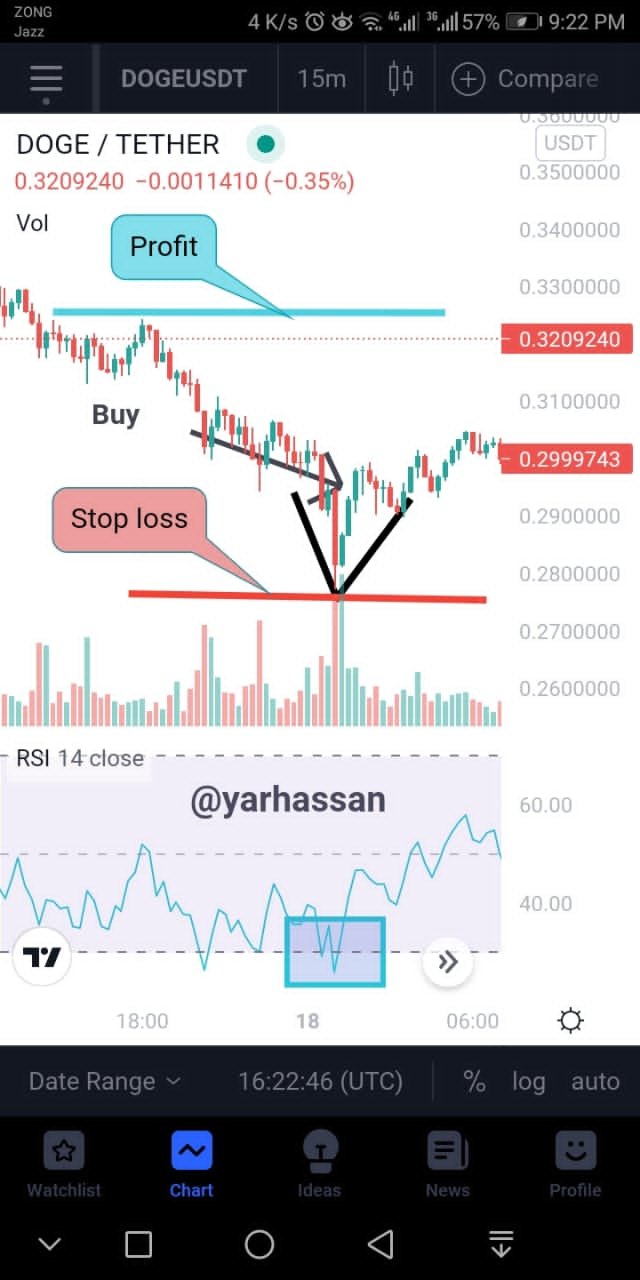
Here, first coin which I discussed is Polkastarter and Doge.
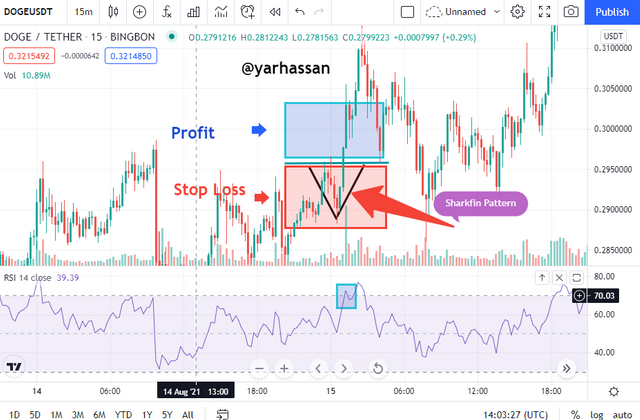
Coin # 01:( Sharkfin pattern)
Coin # 02:( Sharkfin pattern)
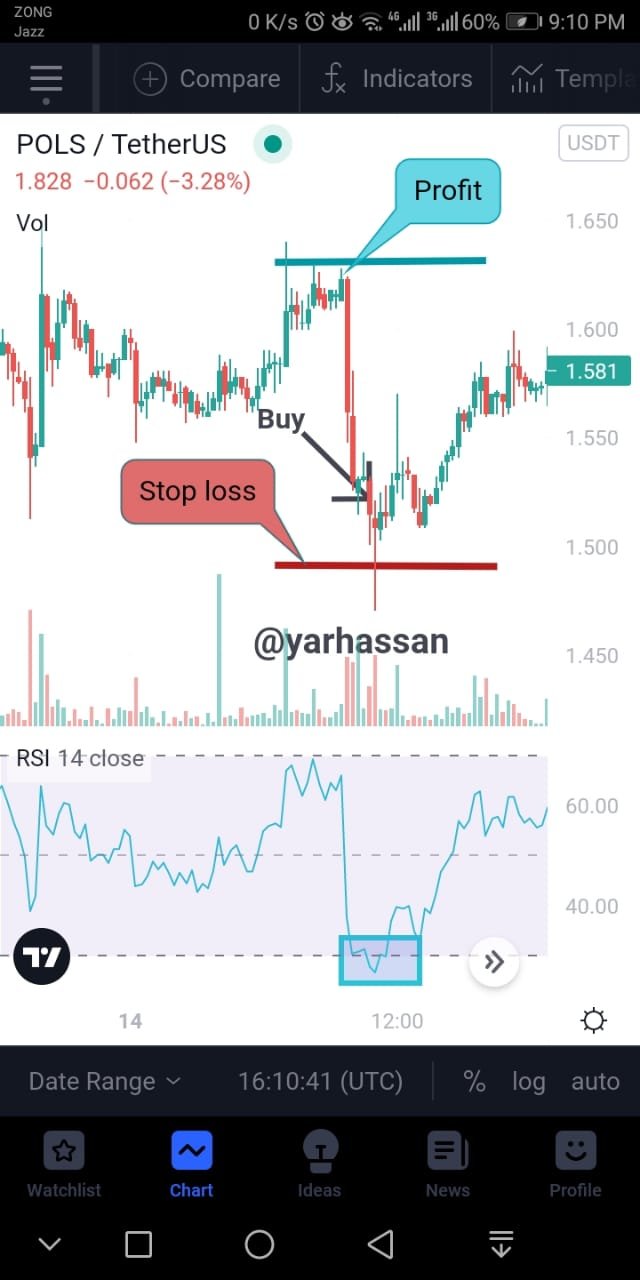
Both of these above screenshots shows that the stoploss, profit and buying. these terms helps us as a trader to make a trade in a well manner.
Conclusion:
We learned about another approach in this lecture, and it has to do with trading Sharkfin Pattern. For both Buy and Sell Positions, we discussed section rules as well as leave measures. Finally, I've given several shots of live trading captured using the Sharkfin Pattern methodology.
That's it for today's article I hope you like it.
Regards!
#cryptokraze-s3week8 #cryptoacademy #pakistan #steemit #steemexclusive