Basic EMA Strategy + Trend Line Break - Crypto Academy / S4W6 - Homework post for @ lenonmc21

made on canva
Hello Steemians!
I hope you are doing well in your life. I hope you are keeping your health in this pandemic as first priority. So this is my homework post for @lenonmc21. The topic today is Basic EMA Strategy + Trend Line Break. So, let's get started.
QUESTION 01
Define and Explain in detail in your own words, what is the Strategy of the EMA + Breakout of the Trend line?
ANSWER:
As we all know there are certain strategies in the crypto market that are very beneficial amid the current situations but to master these you have to practice a lot. Then comes the strategies that are very useful for beginners and are quite easy to understand and master and help you to make the right investment decisions.
Among these strategies is the EMA + Breakout of the trend line strategy which is quite a good and very effective strategy when it comes to making good investment decisions. It is a basic knowledge and very common that the first and the most basic indicator is the price action itself, this strategy is all about it, although we'll use a single technical indicator to effectively implement the strategy which is another basic and very commonly used indicator EMA (exponential moving average) which is the first component of this strategy and the second one that we'll use is another basic and beginner level tool that is trend line. Let us breakdown the two.
- EMA:
The "Exponential Moving Average" as the name suggests itself is an indicator which averages a certain amount of data for a specified period of time of our choosing in the input panel of the indicator's setting tools. EMA significantly uses the recent price action that is occurring at the current time to give signals and eradicate the false ones.
- Trend line:
Trend line is the line which is used to determine the current trend of the market by connecting the higher and lower points of the candles in favor of the trend. Trend lines help us to identify the strong or weak trend of the market and also the possible market reversals and breakouts. However, in this strategy we'll use it oppositely i.e., in the opposite direction of the trend.
HOW TO IMPLEMENT THESE TWO IN THE EMA + BREAKOUT OF THE TREND LINE STRATEGY:
- Take any chart at any timeframe of any cryptocurrency pair. I've taken SOL/USDT at 45 min timeframe. Apply the EMA 100 indicator on it.
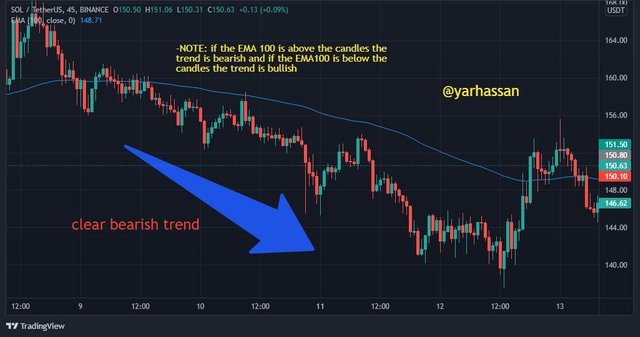
screenshot taken from tradingview
- Now, for the trend line, after recognizing the current trend we draw the trend lines against the market's current trend and wait for the candle to break above or below it and then take entry/exit in the market.
screenshot taken from tradingview
QUESTION 02
Explain in detail the role of the 100-period EMA in the EMA + Trendline Breakout Strategy?
ANSWER:
ROLE OF 100-PERIOD EMA IN THE STRATEGY:
The role that 100-period EMA plays in this strategy is of determining the general trend of the market and make decisions according to it. As we mentioned earlier that it gives us the average price action of the market during the period of time that we choose which in this case is 100 days.
To determine the trend of the market as we mentioned earlier in the screenshot that if the candles are closing below the EMA line, the trend is bearish and if the candles are closing above the EMA line, the trend is bullish. This helps us in taking decisions if favor of the market.Here is another screenshot of EMA indicating the current bullish price action of ADA/USDT at 30 min timeframe.
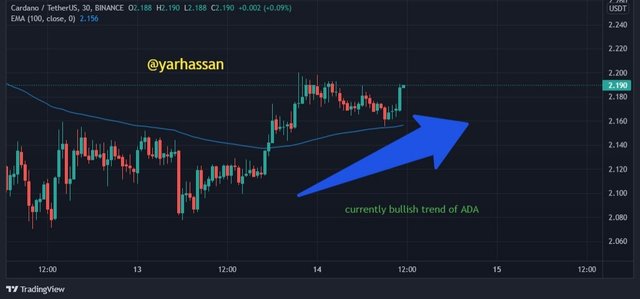
screenshot taken from tradingview
QUESTION 03
Explain in detail the role of the "Trend Line" in the EMA + Breakout Trendline Breakout Strategy?
ANSWER:
ROLE OF TREND LINE IN THE STRATEGY:
- The role of the trend lines in the strategy is quite simple. They provide us with the breakout points in favor of the market's trend.
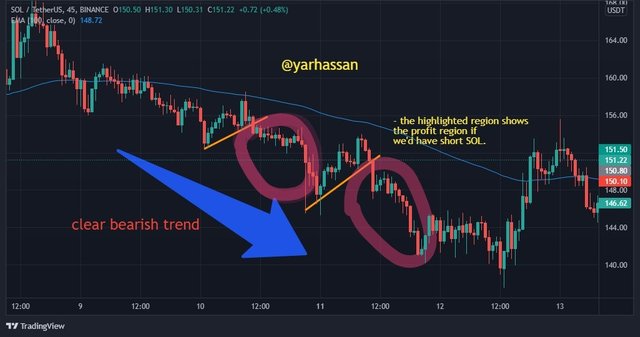
The implementation of trend lines in this strategy though is different than we normally use. In this strategy we draw the trend lines against the current trend of the market i.e., if the trend is bearish we'll draw the trend lines as bullish connecting the higher highs of the market's price action and the opposite is true when the trend is bullish (the trend lines will be bearish then)
screenshot taken from tradingview
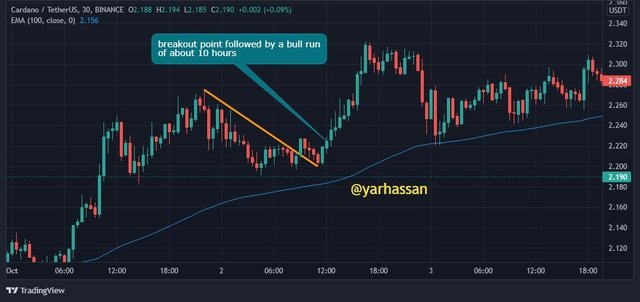
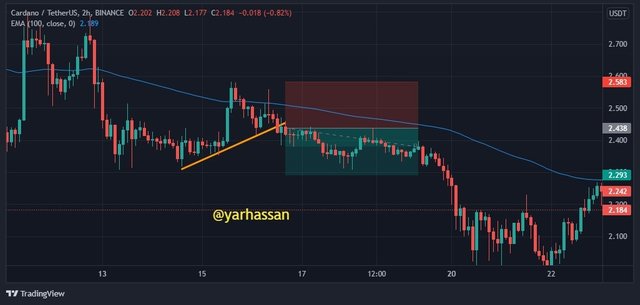
- In the screenshot above, the above discussed strategy of drawing the trend lines is proven true when on the breakout of the bearish drawn trend line in an already bullish trend is followed by a bull run of about 10 hours. So, as beginner traders we can make the right decisions using it.
QUESTION 04
Explain the step by step of what needs to be taken into account to execute the EMA + Trendline Breakout strategy correctly?
ANSWER:
During the implementation of this strategy, the following things must be taken into account before you make any type of trade order in order to successfully and profitably enter and exit the trade.
Step no. 01 (EMA-100):
Step 01 would be placing the EMA 100 on the chart, this way we will have an average price action of that certain cryptocurrency for a period of 100 days. Now, as we discussed earlier that if the price action is below the EMA line the trend will be bearish and we'll look for sales now or short. Vice versa for if the price action is above the EMA line we'll look for purchases or long.
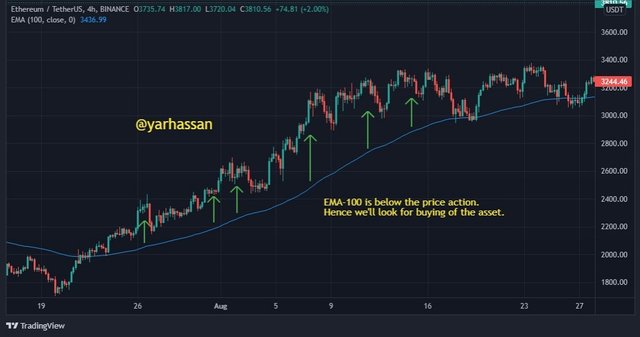
screenshot taken from tradingview
Step no. 02 (Market structures and cycles):
Step 02 would be identifying the harmony and market structure and cycle. This is done correctly by making a zig-zag pattern. For example, if the price of an asset is above the EMA-100 (uptrend) then we'll be drawing a price structure connecting the highs and lows higher and higher i.e., the next high/low will be above the previous one.
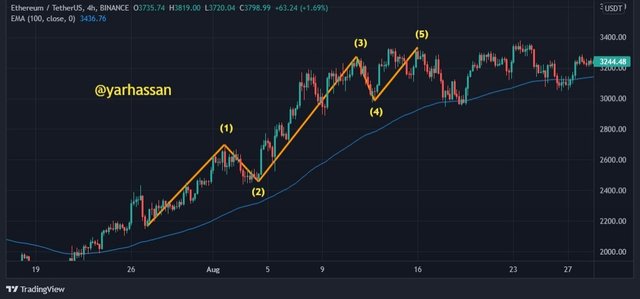
screenshot taken from tradingview
In a downtrend market we'll be drawing a price structure connecting the highs and lows lower and lower i.e., the next high/low will be below the previous one.
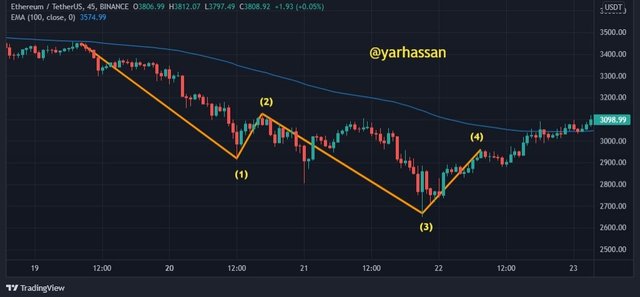
screenshot taken from tradingview
Step no. 03 (Trend line traces):
Step 03 is drawing trend lines. As we mentioned earlier after identifying the trend either bullish/bearish by EMA-100 and understanding the market harmony the next step is drawing the trend line against the current trend (if bullish, trend line will be bearish and if bearish, trend line will be bullish). This will help us to get the signal of selling or buying when the candle will close above or below it. As it is seen in the screenshot below.
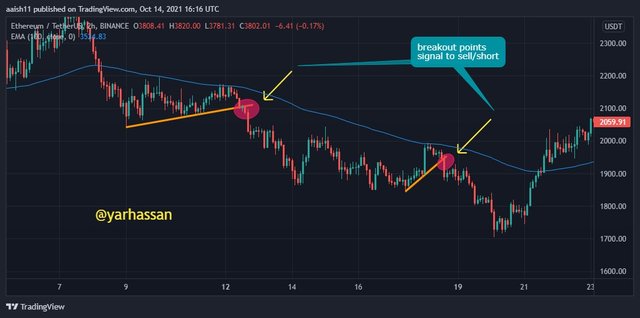
screenshot taken from tradingview
QUESTION 05
What are the trade entry and exit criteria for the EMA + Trend Line Break strategy?
ANSWER:
COMPLETION OF THE THREE STEPS
- The first thing we must bear in mind is the price action being above or below the EMA-100, whatever it is we must check then the market cycle / harmony whether it is taking place perfectly or not, if it is healthy or not. After doing so the next thing we must do is draw the trend lines against the dominant trend and wait for the candle to break it and close above or below it. All these steps must be done and not eliminate any one of them in order to perfectly execute the strategy and enter or exit the market.
LATERALIZATION OF PRICE ACTION
- The second thing that we must look out for is the not perfectly executing of price harmony in a healthy trend that is in other words called price being lateralized. The price action must not be lateralized in order to execute this strategy. If it is lateralized then we must wait for the next bullish or bearish trend to start.
PLACING 1:1 TP/SL
- As the discussed strategy is easy to use and can be used by beginners it is best to place a take profit / stop loss at a ratio of 1 to 1. With our entry point being the one where the candle breaks the already drawn trend line and closes above or below it. (I've done it in the bearish trend below)
screenshot taken from tradingview
Practice (Only Use your own images)
Make 2 entries (One Bullish and one Bearish) in any pair of "Cryptocurrencies" using the "EMA Strategy + Trend Line Break" (Use a Demo account, to be able to make your entry in real time at any timeframe of your choice, preferably low temporalities)
- BULLISH ENTRY:
screenshot taken from tradingview
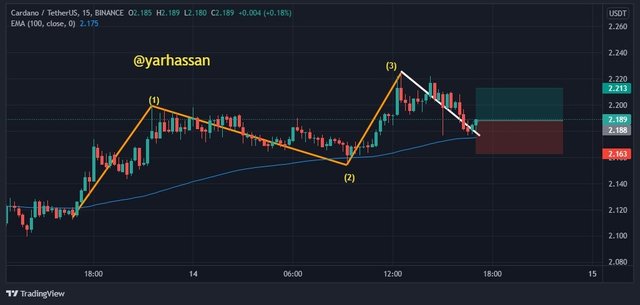
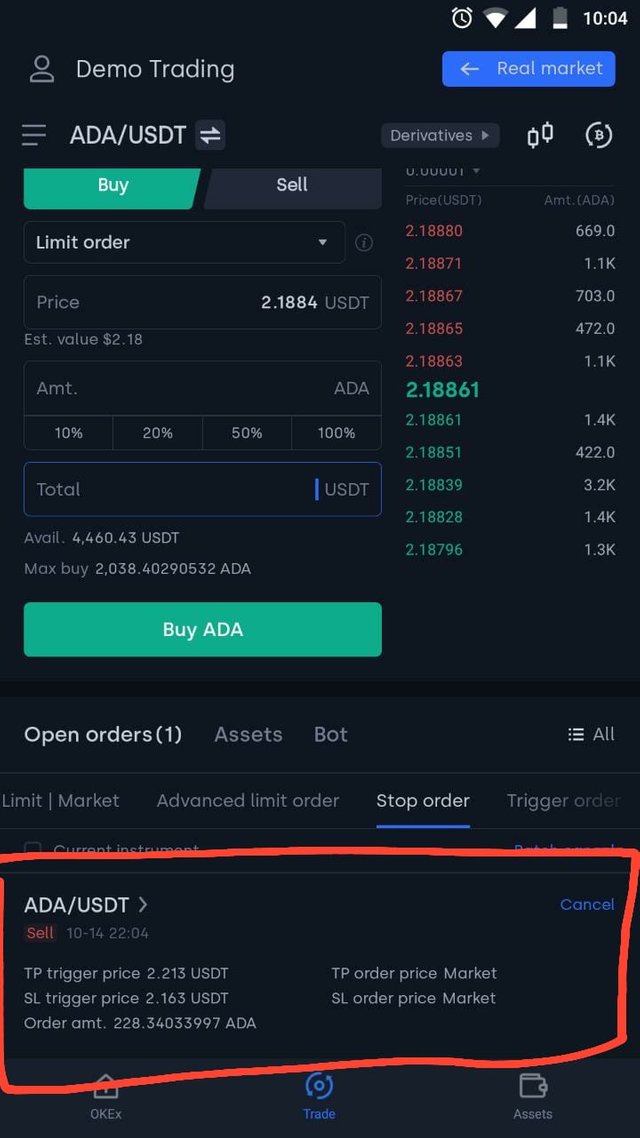
Here we have ADA/USDT pair, as we have been mentioning above here we can see that ADA has a bullish market structure, the harmony is good and the price action is above the EMA-100. So, we draw the trend line against the bullish trend and wait for the price to break it and close above it to place the order at 2.194 with stop loss at 2.163 and take profit at 2.213
- BEARISH ENTRY:
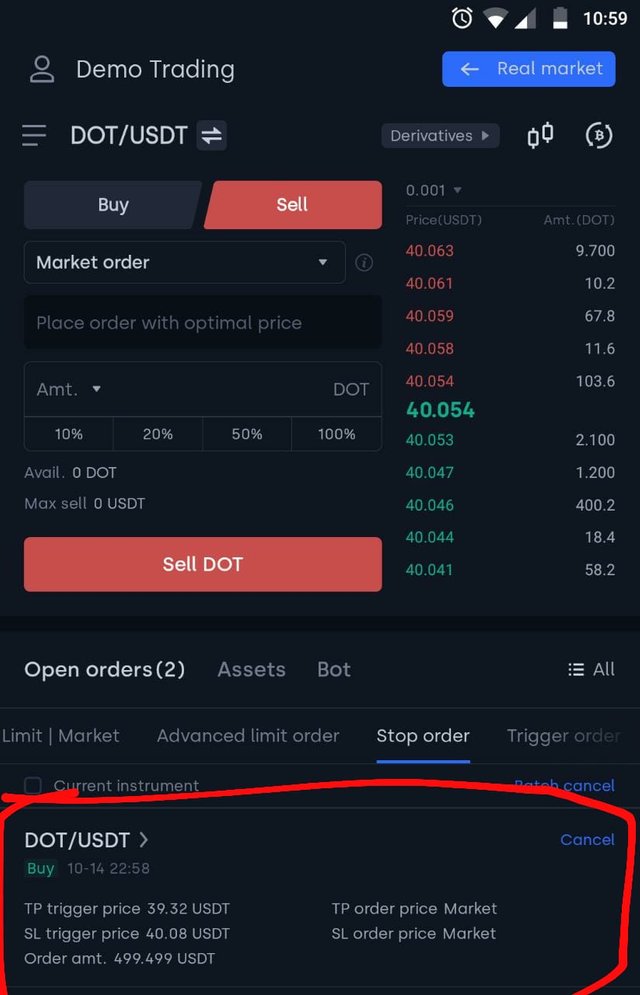
screenshot taken from tradingview
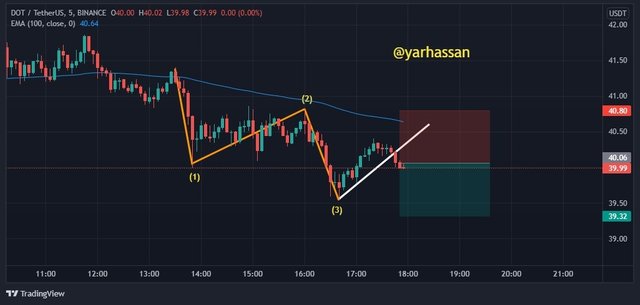
Here we have DOT/USDT pair, as we have been mentioning above here we can see that DOT has a bearish market structure, the harmony is good and the price action is below the EMA-100. So, we draw the trend line against the bearish trend and wait for the price to break it and close below it to place the sell order at 40.06 with stop loss at 40.80 and take profit at 39.32.
CONCLUSION
Here, in this homework task today we learned about a simple and beginner level strategy that is very easy to implement and practice. We learned that the most basic indicator is the price action itself and when it is combined with simple steps like implementation of EMA-100, trend lines and market cycles and structures it can provide you with very good investment decisions.
cc: @lenonmc21
@tipu curate
Upvoted 👌 (Mana: 3/4) Get profit votes with @tipU :)