Understanding trends - Crypto Academy / S5W3- Homework Post for @reminiscence01
Here is my homework post for beginners course in the steemit's Crypto academy season 5 week3 by professor @reminiscence01
what is Trend Reversal.
Trend reversal is the general pull back of a graphic direction in a chart of a particular asset, this changes the course of progression that the chart initially follow. This chart is referred to the price trend and the change in the chart can be from either a bullish which is an increasing price flow to a bearlish which is a decreasing price flow or a bearlish to a bullish flow.
Cryptocurrency is said to be a volatile asset has it possesses a consistent change in trend direction. This means Cryptocurrency has a lot of trend reversal within short period of time. This trend reversal has been studied and it is been known that some trend operations most times occur before there is a break in the market structure.
From my own understanding of consistent study of some Cryptocurrency, I noted that a increasing price trend can not just continue without a little retracement or reversal. The same is the case for a decreasing price trend. This therefore makes the chart of Cryptocurrency to have its zigzag lines either progressive or the other way.
What is the benefit of identifying reversal patterns in the Market?
The major benefits of identifying a reversal pattern in the market structure Is to know when to take profit from the market and to know the perfect times to enter a trade.
Another benefit of identifying these reversal in the market is to study the time frame that is needed to stay within a trade or holding of a particular Cryptocurrency. The study of the reversal pattern also tell us whether to enter the trade for a short period or a long term.
How can a fake reversal signal be avoided in the market?
Fake reversal are a result of little pull back in direction of a price trend, either an uptrend or a down Trend. Fake reversal have to been identified before they can even be avoided at all, This is the first thing to noted about. A trend reversal tryely begin with a pullback before a new graph pattern can be form but this pullback has to be noted if is a little pull back or a major reversal in the price trend.
The time frame of the price trend might indicate if it is a little pull back or a trend reversal as the time frame is adjusted it would be noticed that the long term chart will not be after by the little pullback. Before a reversal can occur it is required in most cases that a new low low or a new high high must be formed before a trend reversal can occur.
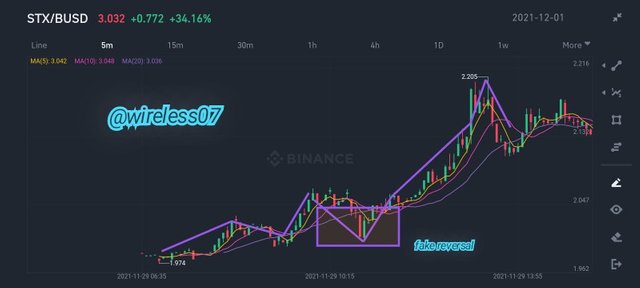
The reason for patience is to know for sure that the reversal is fake by not producing a new lower low that makes the price trend change into a new trend flow.
explanation on the following Trend reversal identification and back up your explanation using the original chart.
Give a detailed explanation on the following Trend reversal identification and back up your explanation using the original chart. Do this for both bullish and bearish trends (Screenshots required).
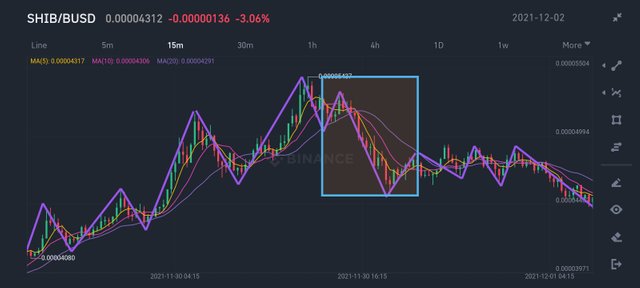
Break of market structure.
A break in the market structure is the change of the state of the market pattern to stop the formation of higher high and a high low in an increase market or the creation of a lower low or a low high in a decreasing market. When a market structure either a uptrend or a downtrend want to change, the order of Their progression will change which will break the normal market structure. Examples of both the bearlish and bullish break in market .
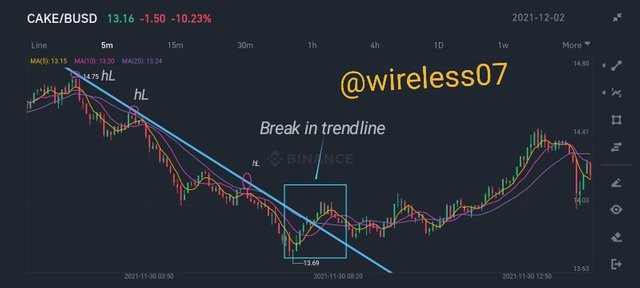
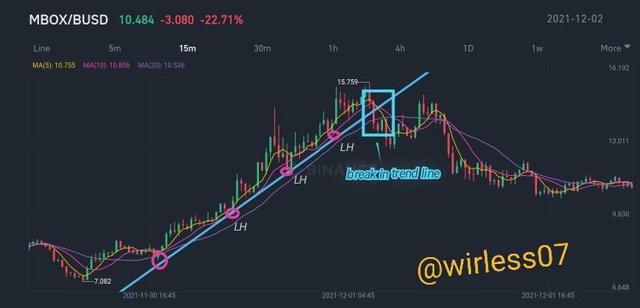
Break of Trendline.
A trend line is a straight line on the chart linking the higher low of a downward trend or the lower high of the upward trend. A break in this lines is use to strongly indicate a trend reversal as it is believed that a reversal will break out of these lining trend lines as it does not obey the normal flow of the trend. This break in the trend lines will be in an opposite direction to the normal flow of the trend making a break through the trend lines.
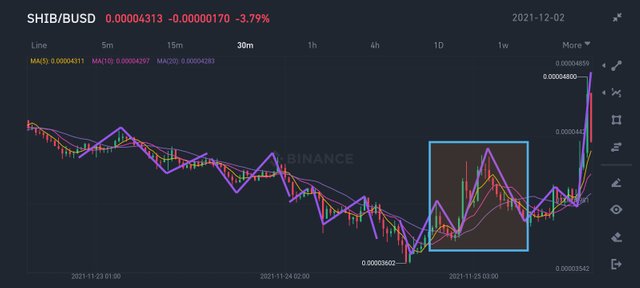
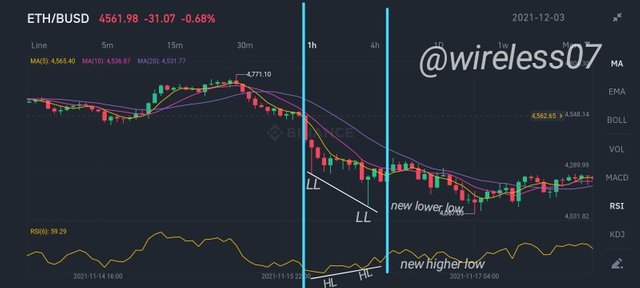
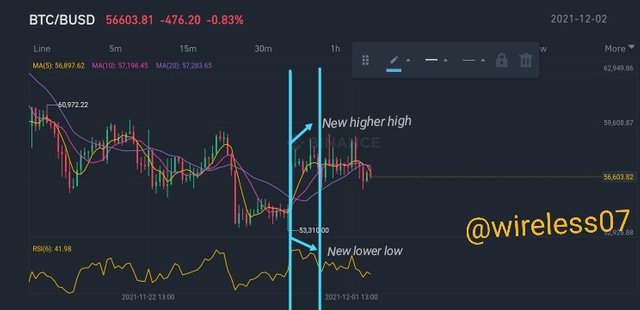
Divergence
Divergence occurs when the relationship of the market price trend contradict with the market indicator give out opposite suggestion of possible market trend. In simpler terms, when the market price trend tends to Create new lower high and the indicator used for the same chart indicate a higher low the results are not in agreement and this is known as divergence. Divergence sometime might be caused as a result of the volume of the Cryptocurrency and these results in a trend reversal afterwards. Divergence is an indication of a trend reversal as the trend reversal usually comes after an occurrence of divergence.
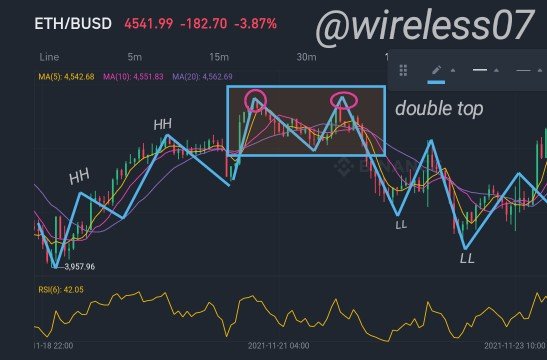
Double top and Double bottom
Another good indication of a trend reversal is seen in the formation of a double top or double bottom.
A double top is formed when a uptrend market want to change direction. It occur as a result of little pullback in the chart which will then give a increase in the chart that result in the same level of the last high higher in the chart. The new increase must not be greater then the last higher high neither must it be less then the last higher high. This type of chart formation is usually followed by a change in the direction of the trend and in this case a downward trend is formed.
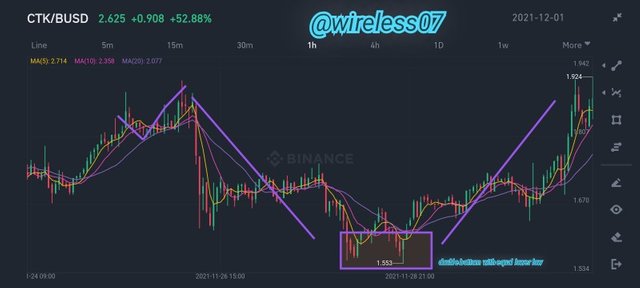
A double bottom is formed when a downward trend market want to change direction. It occur as a result of little pullback in the chart which will then give a decrease in the chart that result in the same level of the last lower low in the chart. The new decrease must not be lesser then the last lower low neither must it be greater then the last lower low. This type of chart formation is usually followed by a change in the direction of the trend and in this case a upward trend is formed.
Demo trading using trend reversal
place a demo trade using any crypto trading platform and enter a buy or sell position using any of the above mentioned trend reversal/continuation pattern.
The trend reversal pattern to be considered for the demo trade is the break of trendline which causes change of price trend from bullish to bearish in this case.
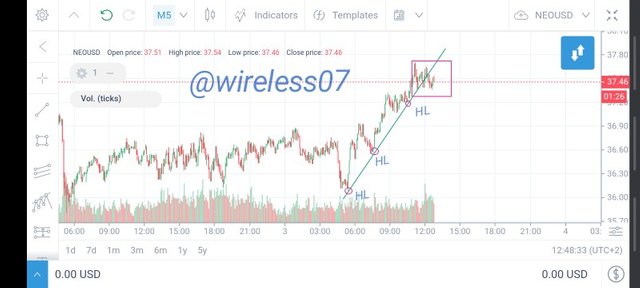
The chart shows the bullish trend for neo/USD in a 5 min interval. After the break of the trend line, it is expected for the price trend to run bearish which means to gain profit on a trade you have to sell and make sure the range is not a price that will touch the trend line.
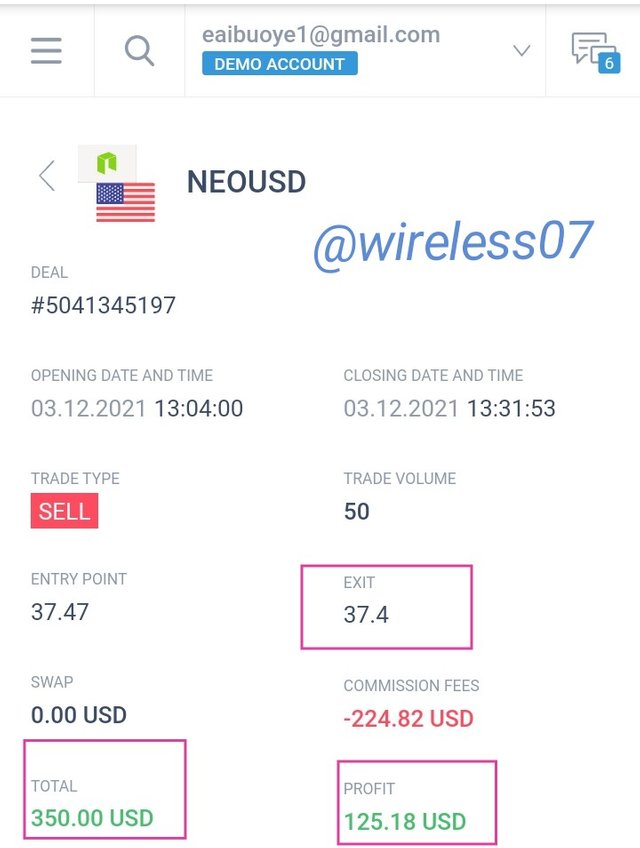
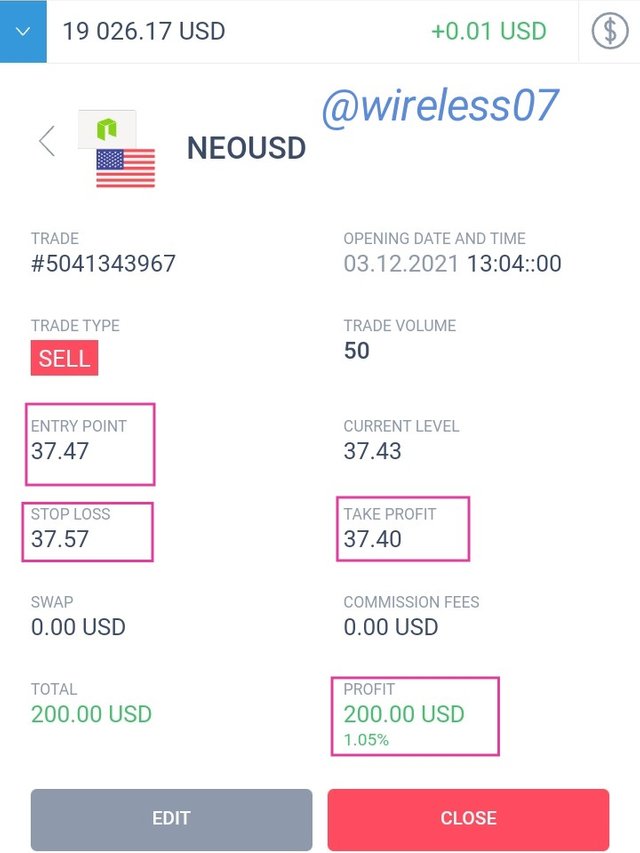
From the chart, the current price is 37.47 and I enter the sell market and used a stop loss of 37.57 which is below the bullish trendline and a take profit of 37.40 and from the first screenshot above, it can be seen that progress has been made toward the analysis with 200usd gain and the second screen shot shows that the trade has been completed with a total gain of 350 USD.
Note: Information discussed in this lesson is for educational purposes and not financial advice. Ensure you make your research and employ good risk management before investing in any crypto asset. Cryptocurrency investment is very risky due to the highly volatile nature of the market.
Hello @wireless07 , I’m glad you participated in the 3rd week Season 5 of the Beginner’s class at the Steemit Crypto Academy. Your grades in this task are as follows:
Observations:
This chart is wrong for divergence. Please revisit the lesson to understand how to identify divergences on the chart.
Recommendation / Feedback:
Thank you for submitting your homework task.