[Technical Indicators] - Crypto Academy / S4W2- Homework Post for @reminiscence01
Hello Steemian !!
In this article, I will discuss the homework provided by @reminiscence01 which is about Technical Indicators.
Question 1
a. In your own words, explain Technical indicators and why it is a good technical analysis tool.
In my personal opinion, technical indicators are a very good technical analysis tool to use because a lot is considered before the price of an asset's features can be predicted. Technical indicators also relate to the previous collection of price data and these indicators will use them to analyze and predict those features. So technical indicators are tools that will help us in achieving our goals in trading.
Technical indicators are representations of market price movements that traders and investors can understand well. What we need to know is that there are previous market movements that will be used as considerations to calculate the next price movement or it can be made as a prediction of future market price movements. Technical indicators refer to the use of past market movements elsewhere to predict future market movements. Talking about why it is a good technical analysis tool, we have seen that the necessary factors for price prediction have been taken into consideration namely price records and past trend movements. However, there is one thing that must be understood that there is no single tool that can guarantee our success in trading. Therefore, technical indicators are our tools to help us see things that we do not understand, such as in terms of price movements through mathematical and computerized.
.png)
b. Are technical indicators good for cryptocurrency analysis? Explain your answer.
.jpg)
I would say that technical indicators are a very suitable tool for cryptocurrency analysis. Technical analysis is very suitable for short-term and medium-term traders such as scalping and swing traders. I can say this because the cryptocurrency market is a market that has a very high level of volatility so it will be very suitable for traders to take advantage of this very fast cryptocurrency price movement.
Although I say that technical indicators are good for analyzing the market, we need to know that no tool can be 100% accurate in providing signals or decisions in trading the cryptocurrency market. We must remain cautious due to the level of market volatility and the frequent occurrence of sudden trend reversals in cryptocurrencies.
Technical indicators will be used as a tool to identify market prices, but for better results and in order to reduce the risk of failure it is recommended to use several technical analysis indicators, combining several indicators will increase the percentage of success in cryptocurrency trading. There are several combinations of analytical indicators that can be used to trade on the cryptocurrency market, I will answer them in the next question later.
c. Illustrate how to add indicators on the chart and also how to configure them. (Screenshot needed).
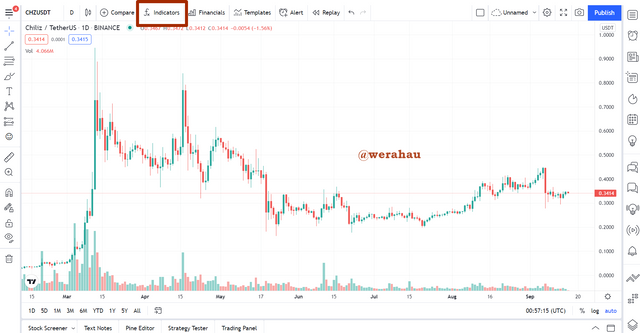
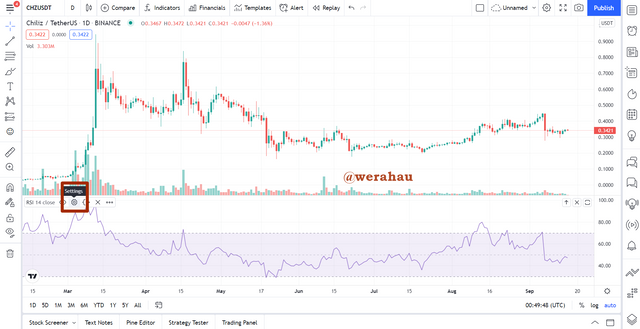
When we open a crypto chart on TradingView, we will only be shown a chart and the default indicator, namely the volume indicator, which you can see in the CHZ/USDT chart image below. To add more indicators to the chart we just need to select the Indicators option at the top of the chart.
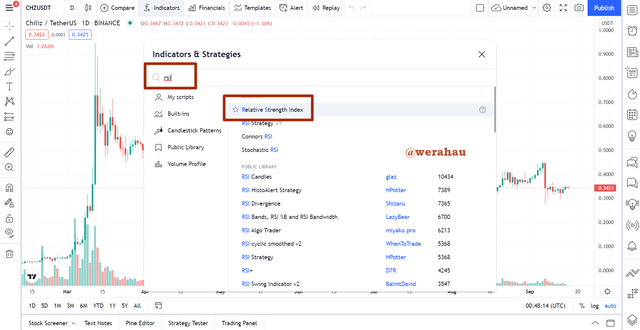
After that, we look for the indicator that we want to add to the search field, for example, I will add the RSI indicator here. After that, we select the top indicator option.
Then the RSI indicator that I selected earlier has been entered into the chart section as shown in the box drawn below.
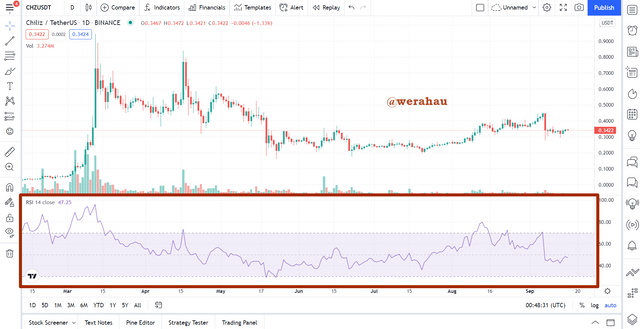
To adjust the existing configuration on the RSI indicator, we just need to select the settings symbolized by the wheel icon at the top of the indicator.
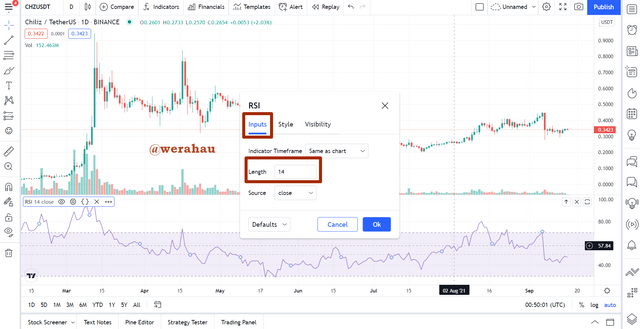
In the inputs section we can change the length of the RSI indicator, by default the RSI will be bolted to a length of 14.
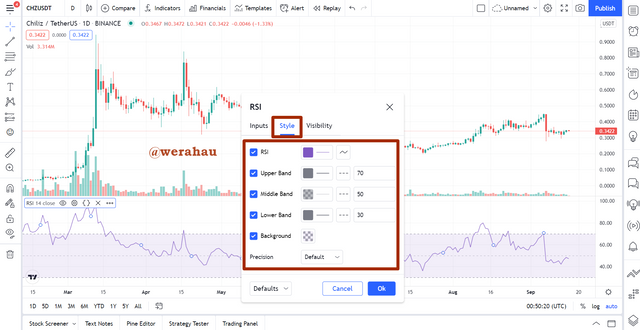
Then the style section we can change several things such as the color and thickness of the line and background from the RSI indicator, then we can also change the level of the upper band, middle band, and lower band.
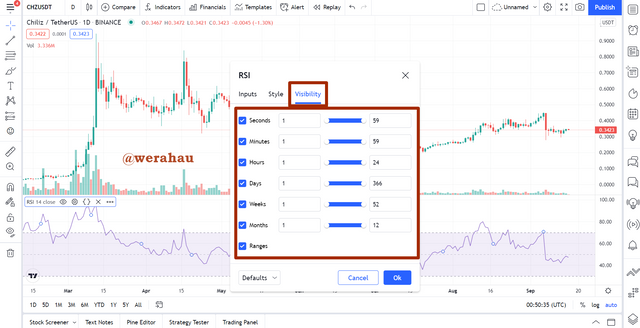
Finally, in the visibility section, we can change the timeframe that will be shown on the indicator.

Question 2
a. Explain the different categories of Technical indicators and give an example of each category. Also, show the indicators used as an example on your chart. (Screenshot needed).
Trend Based Indicators
Every market has a trend, a trend is a thing/moment that is happening in a market for a period, the trend that is meant here is a bullish trend and a bearish trend which indicates whether the market is being dominated by sellers or buyers.
Traders, especially the short-term type, must always be sensitive to the trend that is happening in the market because it will affect the results of the trades they make because it is normal for us traders to not fight the ongoing trend because it will increase the risk. failure. Each current trend has its own strength level, sometimes it is weak and sometimes strong, there is an indicator that can show the strength of the ongoing trend in the market, the name of this indicator is Average Directional Index (ADX).
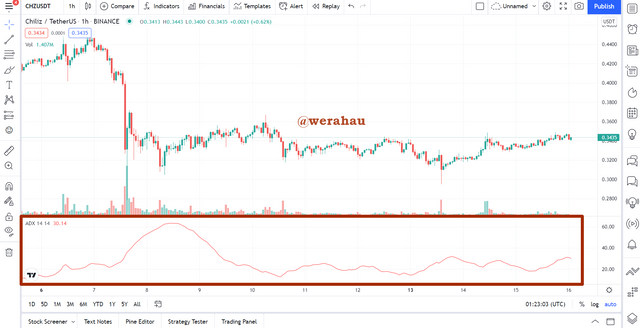
ADX is an indicator that is presented with a trend line that will show traders the current trend and the indicator will show the strength of the trend through the numbers indicated by the line, the range of numbers used in this indicator is 0 to 100. If the ADX indicator line shows at 0 - 25 then the trend that is happening at that time is weak, then if it shows at 25 - 50 then there is a trend in the market, then if it is at 50 - 75 then the trend is strong, and lastly, if it shows at 75 - 100 then the trend is very extreme.
Volatility Based Indicators
Volatility is the most common thing in the crypto market, many traders start to enter the crypto market because they see the level of volatility or asset price changes are very high and fast. There is an indicator that traders often use to profit in crypto price movements, the name of this indicator is Bollinger Band.
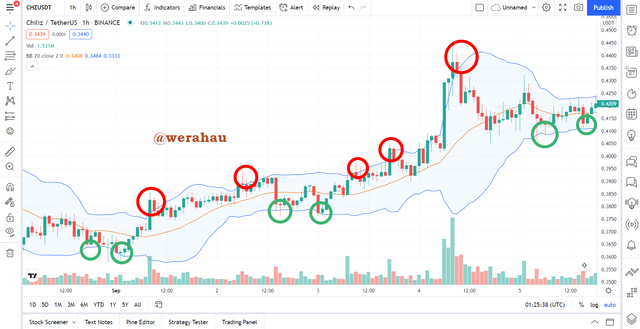
Bollinger band is an indicator that shows the level of price volatility of crypto by using 3 band lines, including Lower Band, Basis Band, and Upper Band. If the candle touches the lower line it can be indicated that the price of the crypto has fallen deep enough and signals that the price will increase in the near future, for example, we can see in the graphic image above which is shown by the green circle. Meanwhile, if the candle touches the upper line, it can be indicated that the price of the crypto has gone up far enough and gives a signal that the price will decline in the near future, for example, we can see in the red circle.
Momentum-Based Indicators
Momentum is what every trader and investor looks forward to, everyone wants to enter every trade they make in the best position. If we want to make a purchase, of course, we want to buy it at the lowest price, while if we want to sell we want to sell it at the highest possible price, see this momentum there is an indicator that we can use so that we don't miss the momentum, the name of this indicator is Relative Strength Index (RSI).
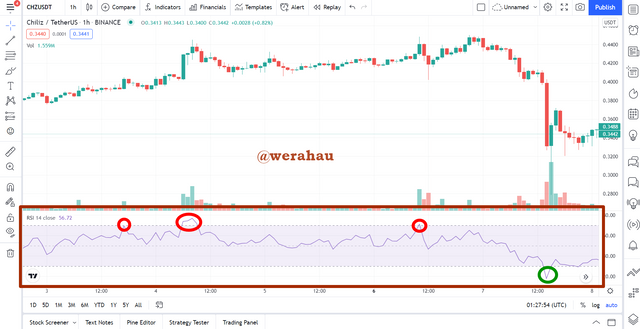
RSI is an indicator that shows the momentum of a crypto asset whether it is overbought or oversold. To show this it has a line in the middle which will follow the trend movement then there will be 2 other auxiliary lines namely Lower Band and Upper Band. If the line in the middle touches the Lower Band, it can be indicated that the price at that time was oversold and it was good to make a purchase entry. Meanwhile, if the line touches the Upper Band then the current market conditions are overbought so we are encouraged to sell our crypto assets. For more details, you can see in the chart above, overbought conditions are shown in red circles while oversold conditions are shown in green circles.
b. Briefly explain the reason why indicators are not advisable to be used as a standalone tool for technical analysis.
An indicator is an auxiliary tool, not a tool that can ensure success in trading, we are never recommended to use it as a standalone tool, this is because the results produced by the indicator are not completely accurate, then as smart traders, we are always advised to combine two or more technical indicators on trading to be sure about the predictions we make. If we only use one indicator, then we will often get false signals which cause us to often fail when trading. Technical indicators cannot be relied on frequently as a whole because many times they tend to have price differentials, buy or sell signals at points that are not large enough to trade.
What we must mention is that trading on crypto-assets has a very high risk even exceeding the risk of trading on other assets such as gold, oil, etc. Therefore, we must remember to combine several analytical tools so that the trading decisions we take are more accurate.
c. Explain how an investor can increase the success rate of a technical indicator signal.
The first thing that traders and investors must do is to really understand the indicators that will be used to analyze a cryptocurrency because there are still many traders and investors who only use an indicator but do not really understand the usefulness of the indicators they use.
Then traders must also be able to choose indicators that match their trading style. not all indicators match one's trading style, we must continue to learn and try until we find indicators that match our trading style, do not use too many indicators because it will have a negative impact on us.
And the last one should always combine several indicators before making a decision in trading. Never only use 1 indicator, always combine and combine the indicators that we use with other supporting indicators so that the decisions we take have a greater percentage of trading success than we do.
Conclusion
Indicators are a very good tool to use before we make decisions in trading, using technical indicators will make us more confident in making trading decisions. The level of success that we will get in trading will also increase. but we also have to remember to always combine several indicators in order to reduce mistakes in making decisions and reduce the rate of trading failure.
I thank prof @reminiscence01 who has created a very unique discussion topic like this, I think topics like this will make learning about blockchain and cryptocurrency more interesting to follow.
CC:
@reminiscence01
Hello @werahau , I’m glad you participated in the 2nd week Season 4 of the Beginner’s class at the Steemit Crypto Academy. Your grades in this task are as follows:
Recommendation / Feedback:
Thank you for submitting a quality content on technical indicators.
Thank you prof.