Trading using Fibonacci Retracement Levels
Hey Steemian friends!

| 👉 Explain the concept of Fibonacci retracement as a technical analysis tool and how it is applied in crypto markets. |
|---|
You must be familiar with Fibonacci sequence from your math class or if you are a fan of "The Da Vinci Code" that decode a password using Fibonacci. It always cool how this pattern of numbers that emerges and its connection to patterns in natural world and human behavior. More importantly Fibonacci sequence has used in various fields, including mathematics, computer science, and art.
The sequence is portrayed as a key element in solving puzzles related to hidden messages and symbols. So why not use it in the trading! Someone must have thought like that 😊
Now how does the sequence work, pretty simple.
You start from 0 and then 1 and thereon you are just keep adding the previous two numbers to make a new number.
0, 1, 1, 2, 3, 5, 8, 13, 21, 34, 55, 89, 144.. any guesses for the next one?
As I said just add last two,
89 + 144 = 233 and then 144 + 233 = 377, can do all day right?
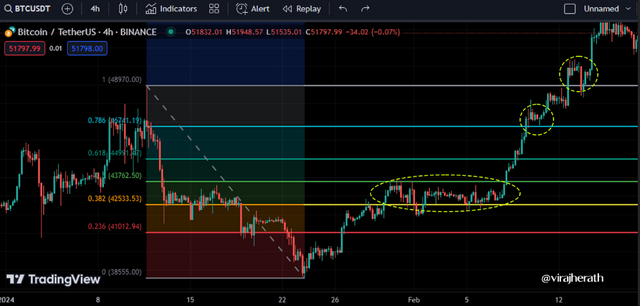
But we have different numbers in our tool! 0.236%, 0.382%, 0.5 and 0.618% What’s happening here? 👀 I will discuss that on the third question. Let's focus why we have these levels for now.
 Fibonacci Retracement Levels
This gives us the following Fib levels:
| Fib levels | Price Predictions |
|---|---|
| 23.6% | 49,450.40 |
| 38.2% | 47,368.30 |
| 50% | 45,685.50 |
| 61.8% | 44,002.70 |
| 78.6% | 41,606.85 |
Now these price points can be used as a strong support and resistance levels according to the price action in the market.
The main uses of these levels are to plan entries, determine stop-loss levels, or set price targets and exits. Traders often use these retracement levels as support or resistance during a price correction within a broader trend.
| 👉 Utilize Tradingview to illustrate Fibonacci retracement levels on the BTC/USDT, ETH/USDT, and STEEM/USDT pairs. (Include screenshots to showcase retracement levels during both uptrends and downtrends). |
|---|
I just showed BTC/USDT uptrend, so I will start with the downtrend.
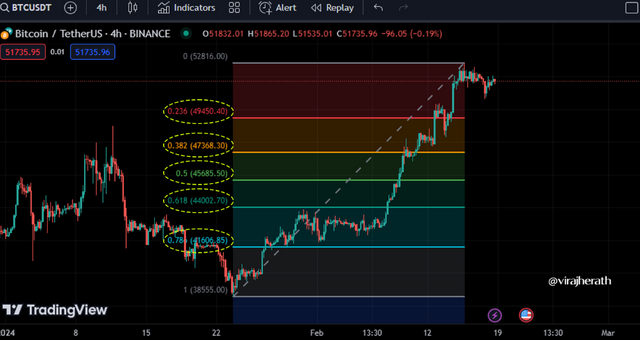
| Crypto pair | BTC/USDT |
|---|---|
| Time Frame | 04 hrs |
| Tool | Fib Retracement |
| Point 01 | 48,970 |
| Point 02 | 38,555 |
 BTC/USDT downtrend analyze
| Fib levels | Price Predictions |
|---|---|
| 23.6% | 41,012.94 |
| 38.2% | 42,533.53 |
| 50% | 43,762.50 |
| 61.8% | 44,991.47 |
| 78.6% | 46,741.19 |
In above levels we can see price moving side by side respecting 50% & 38.2% levels as a support & resistance level. In the next 02 points we also can see price reset at the levels before new trend begins. This is a good example to showcase how good this Fibonacci Retracement Levels are for traders.
| Crypto pair | ETH/USDT Uptrend |
|---|---|
| Time Frame | 01 Day |
| Tool | Fib Retracement |
| Point 01 | 1,370 |
| Point 02 | 2,138 |
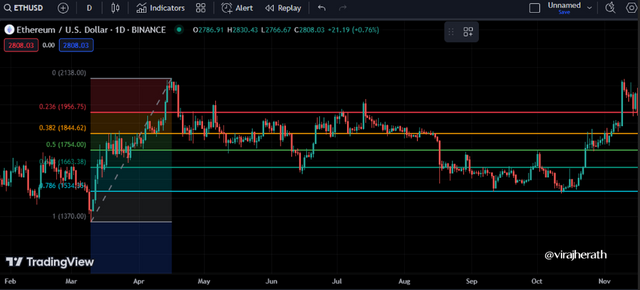 ETH/USDT Uptrend analyze
In this example it clearly demonstrates how good these levels have been as resistance and support levels.
| Crypto pair | ETH/USDT Downtrend |
|---|---|
| Time Frame | 04 hrs |
| Tool | Fib Retracement |
| Point 01 | 48,970 |
| Point 02 | 38,555 |
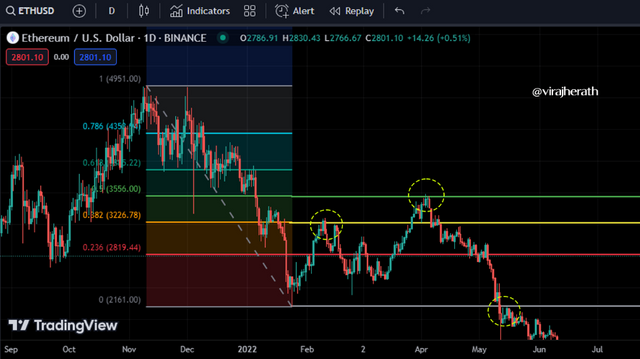 ETH/USDT Downtrend analyze
Once again we can see that price is respecting support and resistance. In the level 0 we can see trend is continuing as a downtrend after a retesting the level making it a strong resistance for the next uptrend.
| Crypto pair | STEEM/USDT Uptrend |
|---|---|
| Time Frame | 04 hrs |
| Tool | Fib Retracement |
| Point 01 | 0.1709 |
| Point 02 | 0.3322 |
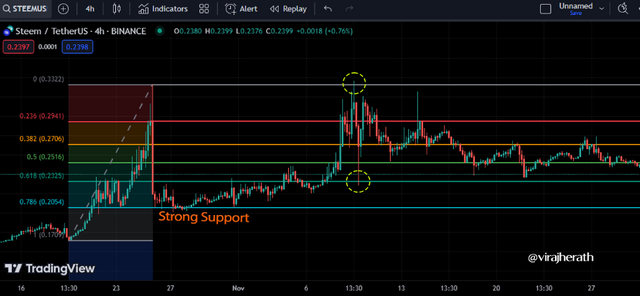 STEEM/USDT Uptrend analyze
It's truly amazing to witness how these levels work like a charm at times. After hitting 0.3322 price dropped within 04 hours to its strong support line, which is at 78.6% level. When the price broke above all the levels to hit the previous high , the support moves to the next at 61.8%.
| Crypto pair | STEEM/USDT Downtrend |
|---|---|
| Time Frame | 01 hrs |
| Tool | Fib Retracement |
| Point 01 | 0.2417 |
| Point 02 | 0.1982 |
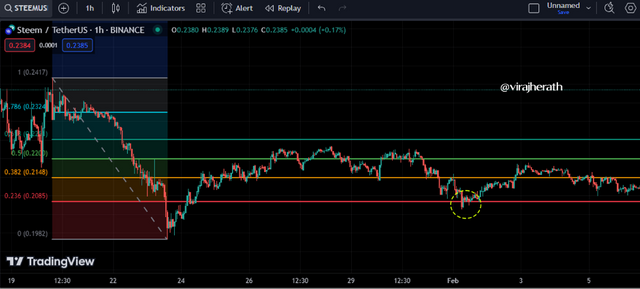 STEEM/USDT Downtrend analyze
Looking at the one hour chart, we can see that price is not respecting fib levels as much as on longer time frames. But even here we can see strong support to break at the 23.6% level.
| 👉 Break down the significance of key Fibonacci levels (e.g., 0.382, 0.500, 0.618) and explain how traders interpret these levels for potential support and resistance areas. |
|---|
0% (No Retracement):
This level represents the starting point of the retracement. It's not derived from the Fibonacci sequence but is included as a reference point.23.6% Retracement:
This level is calculated by taking a Fibonacci number and dividing it by the number two places to the right (e.g., 21 / 89 = 0.236).
Since this is the first retracement level, traders expect consolidation over this level before a bounce or pull back. If the price bounce or pull back from this level and hold it path, it could suggest that the trend is strong and likely to continue on same direction.38.2% Retracement:
This level is found by taking a Fibonacci number and dividing it by the number one place to the right (e.g., 34 / 89 = 0.382).
Traders often see this level as a significant area where a trend might find support or resistance. If the price holds above this level, it usually an early signal for a continuation of the trend.50% Retracement:
This level is not directly derived from the Fibonacci sequence but is included as a psychological midpoint between the starting point and the endpoint.61.8% Retracement:
This level is found by taking a Fibonacci number and dividing it by the number one place to the left (e.g., 55 / 89 = 0.618).
This level is considered a strong retracement level hence a bounce or reversal at the 61.8% level can be a signal that the trend is likely to resume to same direction as bounced or reversed.78.6% Retracement:
This level is found by calculating the square root of 0.618. The 78.6% retracement is derived as a more shallow retracement level before the full retracement at 100%. Hence this level too consider as a strong support and resistance area.
| 👉 Explore the synergy of Fibonacci retracement with other technical indicators (e.g., Moving Averages, RSI). Discuss how a combination of tools can provide a more robust analysis. |
|---|
Unlike any indicator, Fibonacci retracement tool can give us a specific idea about a potential support and resistance level in the future price action. But the problem is, like any other indicator or tool this is too not 100% accurate. So, if you are not careful enough to have backup technical analysis tools to identify potential areas to make more informed decisions, more often you will regret that decision.
So let's use RSI as an experiment to see whether we can support the levels we find from the Fibonacci Retracement tool.
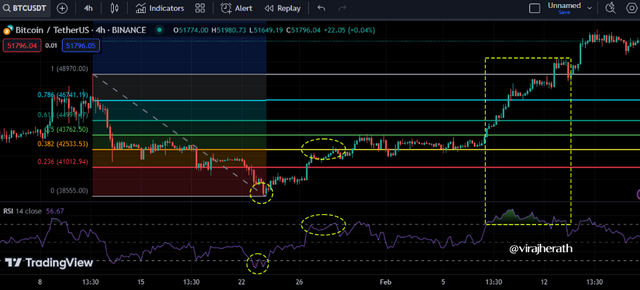 Can RSI helps Fibonacci for more robust analysis?
The points where highlighted as ellipses, we can see the price action reacting to levels and oversold & overbought scenarios. Hence giving us confidence in our decision to help Fibonacci Retracement levels.
However, can you see the highlighted rectangle area where the RSI has an overbought indication but there's no reversal of price action. This is a good example that PA does not always respect the technical tools but market at that instance.
Hence, it is always advisable to keep a strong risk management strategy in place if things go south than expected.
| 👉 Specifically analyze the recent price action of STEEM/USDT using Fibonacci retracement. |
|---|
| Crypto pair | STEEM/USDT |
|---|---|
| Time Frame | 01 hr |
| Tool | Fib Retracement |
| Point 01 | 0.1982 |
| Point 02 | 0.2561 |
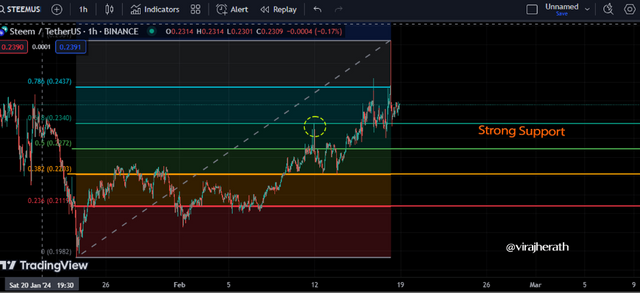 STEEM/USDT Uptrend analyze
Today we saw Steemit shoot to 0.25+ after some sometime. This is a good point to analyze and understand the next support levels. It is noticeable strong support is there at 61.8% level. It was a strong resistance the week before, so we can argue this level is strong and might hold the line for an uptrend. Let's keep our fingers crossed for that prediction.
Thank you for this interesting contest @crypto-academy. Looking forward to taking on the next week’s challenge. I would like to invite @tenguhatanga, @crisvera & @morgan76 to participate in this contest.
Thank you.
Peace to all 🙏
The cover image has been developed by Midjourney. All other images are taken from trading view as screen shots and edited in photoshop.
You're absolutely right. The Fibonacci retracement tool is really helpful in giving us an idea about potential support and resistance levels in the future. However, it's important to remember that it's not 100% accurate, just like any other indicator or tool. So, it's crucial to be careful and use backup technical analysis tools to identify potential areas for making more informed decisions. That way, you can avoid any regrets down the line. Risk management is key.
TEAM BURN
Congratulations, your comment has been successfully curated by @inspiracion at 5%.
Exactly as I said 👍 Risk management is truly the key for a successful trader.
@virajherath Your breakdown of Fibonacci retracement in crypto markets is top-notch! The examples with BTC/USDT ETH/USDT and STEEM/USDT provide a clear understanding especially the STEEM/USDT recent uptrend analysis. Great insights on combining Fibonacci with RSI for a more robust approach. Wishing you the best of luck in the contest
I'm happy to hear that you found the breakdown helpful. Best of luck to you as well!
Has explicado con detalles el concepto de los RF así como la aplicación de indicadores adicionales como puntos de apoyo en la toma de decisiones.
Has puestos ejemplos claros de su aplicación que son de gran ayuda para el entendimiento del lector.
Gracias por compartir. Te deseo muchos éxitos.
I'm glad you found the explanation and examples helpful. Thank you for your comment and wishes! Have a great week ahead.
You have provided helpful information explaining the levels of the Fibonacci numbers and their associated price predictions. The charts and your analysis provided for the BTC/USDT, ETH/USDT, and STEEM/USDT pairs are very important. The description of Fibonacci's important levels is clear in your explanation. Combining Fibonacci with RSI is a wise solution. Your analysis is very useful for the recent price movement of STEEM/USDT.
Thanks for that review danish578. I have a new price analysis on STEEM/USDT on my new post. I invite you to check that one too.
Your Most Welcome dear Why not My dear. I will
your explained Fibonacci retracement levels in a simple and engaging way! Love the connection to 'The Da Vinci Code' and the mystery-solving aspect. The Fib levels and price predictions provide a clear understanding of their significance in identifying support and resistance. Looking forward to seeing the TradingView illustrations for BTC/USDT ETH/USDT and STEEM/USDT pairs in both uptrends and downtrends. Great breakdown..
Thank you for the comment and are you a Da Vinci Code fan? because you are the only one who picked it 😀
Thank you, friend!


I'm @steem.history, who is steem witness.
Thank you for witnessvoting for me.
please click it!
(Go to https://steemit.com/~witnesses and type fbslo at the bottom of the page)
The weight is reduced because of the lack of Voting Power. If you vote for me as a witness, you can get my little vote.
Upvoted. Thank You for sending some of your rewards to @null. It will make Steem stronger.
Your post has been successfully curated by @inspiracion at 35%.
Thanks for setting your post to 25% for @null.
We invite you to continue publishing quality content. In this way you could have the option of being selected in the weekly Top of our curation team.
Thanks for the support Team Burn.