Steemit Crypto Academy Contest / S15W6 – Chartist analysis
Hey Steemian friends!

| 👉 What is chartist analysis? And the importance of chart patterns. |
|---|
Chartist analysis is a method where traders use price charts to uncover clues about where a cryptocurrency's price might be headed. The important factor about this method is to look for the historical behaviors of the market to predict future price.
In this case traders often look for the past trends and price movements and candlestick patters rather than focusing on fundamentals.
The illustration of price action of certain market we recognized as a price chart and often we see different patterns. These patterns can tell us a story about how the market behaved and Chartist analysis use this story as a signal and recognized potential future moves based on historical behaviors.
Though these behaviors might not act exactly as previous, we have a potential signal when assessing our decisions to enter or exit from the market. Hence chart patterns play a crucial role providing traders with essential insights into market. Here are some key reasons why chart patterns are important.
Visual Representation of Market: The visual representation of a chart pattern can offer us a clear picture about the battle between market participants.
Identification of Trends: Chart patterns help traders identify trends in the market and we identify the market as upward, downward and sideways according to the certain time frames. Understanding the current trend is very important to make sound trading decisions.
Support and Resistance Levels: Typically, these levels are recognized as barriers where price action may reverse, break or hold. With chart patterns we can easily pinpoint these levels and understand the trend continuations and reversals.
Risk Management: If we can identify key levels and patters correctly, we can strategically place stop-loss orders to mitigate potential losses. This is a proactive approach to secure profits from a trade.
Confirmation of Other Technical Indicators: Chart patterns can use as a confirm signals with other technical indicators. When multiple indicators align with a specific pattern, it strengthens the signal, providing traders with increased confidence in their decisions.
| 👉 What is the shoulder head shoulder pattern? Show screenshots using the BTC/USDT pair. You can use another cryptocurrency pair if you wish. |
|---|
It's a three-peaked formation that indicates a potential trend reversal. You get a peak (shoulder), then a higher peak (head), and another peak (shoulder). It's like the market doing the wave. Let me show you a screenshot with the BTC/USDT pair.
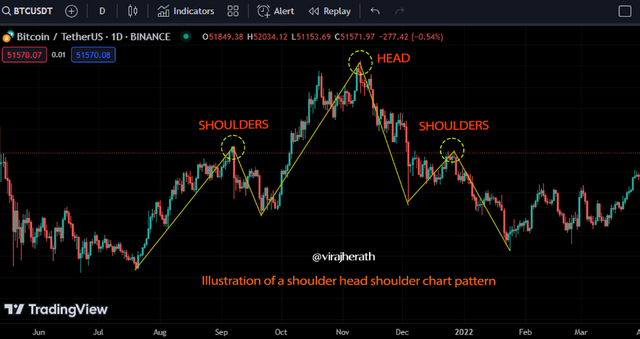 BTC/USDT | 01 D | Shoulder Head Shoulder pattern
 | 👉 Explain the formation of the inverse head shoulders pattern. Show screenshots of a cryptocurrency pair that displays this pattern. |
|---|
Now, the Inverse Head and Shoulders are like the exact flip side of the Shoulder-Head-Shoulder. It's a potential signal that the market might be moving to an uptrend. Imagine an upside-down "H", no matter how you flip it you still get the same pattern. You have a low point (head), followed by higher low points (shoulders) in this pattern.
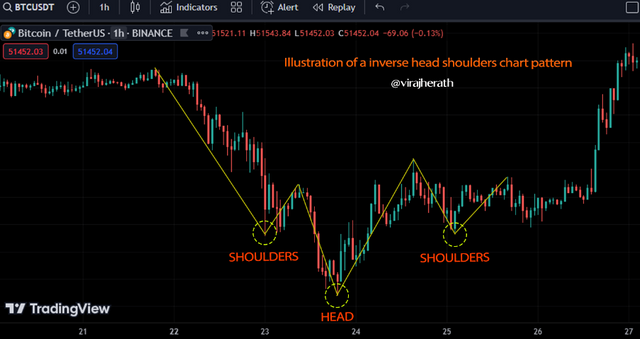 BTC/USDT | 01 H | Inverse Shoulder Head Shoulder pattern
 | 👉 For the technical analysis of the Steem, would you use chart patterns? Explain your answer |
|---|
Absolutely! I think referring chart patterns are like a must if you are a trader. For Steem or any other cryptocurrency, using chart patterns is a smart move. They give us insights into potential price movements and help us make informed decisions. Just like reading a map before a road trip, chart patterns guide us through the twists and turns of the market. So, yes, I'd definitely use chart patterns for the technical analysis of Steem.
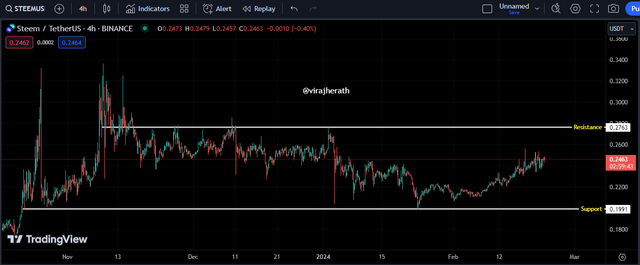 STEEM/USDT | 4 H
 In the current price action, we cannot particularly see any chart patterns forming such as Head & shoulders, Elliott wave or bearish/bullish flags. But we can clearly analyze that the price was unable to break the 0.1991 mark and hence I marked the level as support. Then again we can see that the 0.2763 level seems to be the resistance where the price pulled back several times. Looking at the 04hours time frame we can clearly say the market seems to be going sideways.
However, the short term price action seems to give us a bullish signal with a lot of higher high candles. The bullish momentum would be boosted by a break in this resistance level at 0.2763. If anything goes south and breaks the support for a price correction we should be ready for that too.
All these insights were possible because of chart analysis. So once again I definitely recommend anyone to follow Chartist analysis before they enter the market to get knowledge about the long term and short term markets.
Thank you for this insightful contest @crypto-academy. Looking forward to taking on the new season’s challenge. I would like to invite @tenguhatanga, @crisvera & @morgan76 to participate in this contest.
Thank you.
Peace to all 🙏
The cover image has been developed by Midjourney. All other Screen shots are taken from Trading Vies and edited by photoshop
You wrote so well and your post is always very in detail.
I must say you have spent a lot of time to write this post and the topics are really time taking and it take a long time to write and you have answered the each question in very much detail.
True, analyzing these charts does require time, but I'm always eager to learn more. That's why I participate in most of the contests organized by Crypto Academy. It's a great way to enhance my trading skills. Appreciate your comment and support!
Absolutely right
Your article is very understandable and instructive about chartist analysis. You have explained the importance of chart patterns and how they can be used to reveal market price movements. Your article is of high quality.
Yes, it's the most effective way to have a quick overview of everything. Thanks for your comment.
Your Most Welcome My dear brother.
Thanks for the appreciations Danish. Have a great weekend!
Greetings friend
You have explained clearly what chartist pattern is and how important it is to traders. The traders ability to spot signals of buy and sell is really interesting.
You have also used a chart to illustrate and taught us how a head and shoulder pattern looks like.
You also mentioned other chartist patterns like Elliot waves, bullish flags which are very useful.
In all, your article was insightful. Wishing you the best in this contest.
I'm glad you found it insightful. Thank you.
A well analyzed article and I must say really said I am very proud I came across such high quality article of this nature on steemit, please keep sharing quality content on steemit to help it reach a goal that we all expect. Thanks for sharing such quality articles, please also try engage on my article too https://steemit.com/hive-108451/@starrchris/steemit-crypto-academy-contest-s15w6-chartist-analysis
Thanks @starrchris, it is really encouraging to see such comments.
Hello! Your explanation of chartist analysis is crystal clear emphasizing its reliance on historical behaviors and patterns for predicting future price movements. The breakdown of the shoulder-head-shoulder pattern and its inverse with relevant BTC/USDT screenshots makes it easy to grasp. Additionally your insight into using chart patterns for the technical analysis of Steem is insightful providing a clear understanding of potential price actions. Best of luck in the contest
Thanks for the comment and wishes @hamzayousafzai
Your post has been successfully curated by @𝐢𝐫𝐚𝐰𝐚𝐧𝐝𝐞𝐝𝐲 at 35%.
Thanks for setting your post to 25% for @null.
We invite you to continue publishing quality content. In this way you could have the option of being selected in the weekly Top of our curation team.
Hi @irawandedy, Thank you for the support however, it looks like the vote from SC03 might not have gone through. Could you kindly recheck this please.
Thank you, friend!


I'm @steem.history, who is steem witness.
Thank you for witnessvoting for me.
please click it!
(Go to https://steemit.com/~witnesses and type fbslo at the bottom of the page)
The weight is reduced because of the lack of Voting Power. If you vote for me as a witness, you can get my little vote.
Greetings friend,
I understand all what you're saying because you made it some self explanatory. When we look at a chart pattern, it's like seeing a visual representation of the battle happening between market participants. It gives us a clear picture of what's going on.
And you're right, chart patterns are super helpful for identifying trends in the market. By understanding whether the market is going up, down, or sideways, we can make smarter trading decisions.
Another cool thing about chart patterns is that they help us spot support and resistance levels. These levels act like barriers where the price might reverse, break through, or hold. Knowing these levels can give us insights into trend continuations and reversals.
And let's not forget about risk management. When we can correctly identify key levels and patterns, we can strategically place stop-loss orders to minimize potential losses. It's a proactive way to protect our profits.
Oh, and here is an added bonus. Chart patterns can also be used to confirm signals from other technical indicators. When multiple indicators align with a specific pattern, it strengthens the signal and boosts our confidence in our trading decisions.
So, chart patterns are like a secret weapon for traders. They give us a better understanding of the market and help us make smarter moves. Good luck in the contest my friend.
Upvoted. Thank You for sending some of your rewards to @null. It will make Steem stronger.