Steemit Crypto Academy Season 4 | Intermediate course by @allbert –week 5: Trading with Accumulation / Distribution (A/D) Indicator.
Introduction
Hello fellow steemians this is the 5th week of the steemit crypto academy season 4. Time is fast spent and the season is going to an end so soon. This week course by @allbert is on Trading with Accumulation / Distribution (A/D) Indicator. In this post I will show my knowledge on this topic.
Let's Get Started

1- Explain in your own words what the A/D Indicator is and how and why it relates to volume.
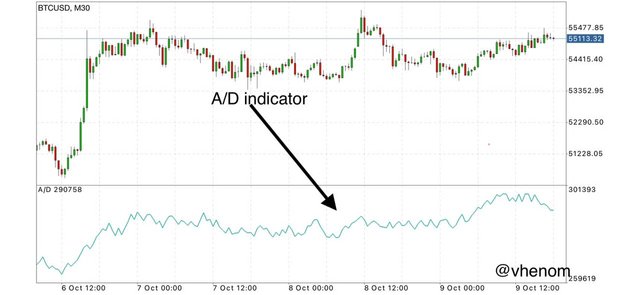
The A/D indicator is a volume based/ volatility Based indicator also known as Accumulation or Distribution indicator. It is used to know the the market is in Accumulation or Distribution. So with this indicator we will know when the market trend is in Accumulation or Distribution. With the information from the indicator we will be able to make the right decision.
Am sure we know the meaning of accumulation and distribution but regardless I will explain the meaning of the two trend. When the trend is in Accumulation or Distribution phase it means the market is in range. No particular trend.
Accumulation is when buyers are just entering the market. Accumulating the asset. This will make the market move in a range or equilibrium position until buyers have accumulated enough of the asset to pull it in an uptrend. After an accumulation period is always follow by an uptrend.
Distribution always occur after an uptrend this is the point where buyers started closing their position or sell off their asset. The selling of / closing of buy position will make the market be in a range trend again there will be no trend in the market the chart will beside ways.
Then after most of the buy position have been closed the market price will fall and a downtrend will be experienced. So after distribution is a downtrend.
With this the trend will continue going accumulation and distribution you know what the market move in a cyclic way. Thats where the A/D indicator comes it it will detect when the trend is about to change and also giving us the trend.
With what I have observed from this indicator it is considered a volatility indicator because it response to the supply and demand in the market. The moment people buy the asset the volume in circulation will be reduced and when this happens there will be divergence in the indicator before the price breaks out.
It response better to the volume of the asset in circulation well than the trend. That's why even before the market trend start going in a bullish direction, the indicator would have started trending upward. Showing that there is high demand in the market and the volume is reducing.
Likewise when there is high supply this indicator will start trending downwards. Showing that the volume of the asset is increasing. So with this we can get the trend of the market even before it started.
2- Through some platforms, show the process of how to place the A/D Indicator
I will show how to add A/D indicator to chart on metatrader4 app. I just require a few steps.
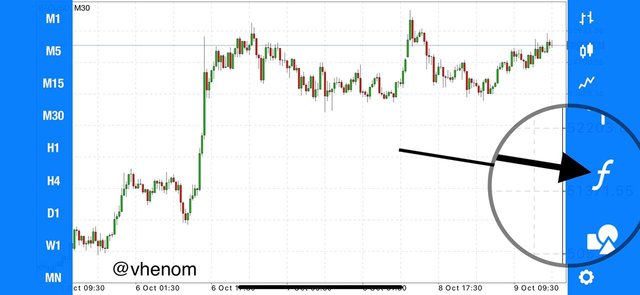
- Step 1- Choose any crypto chart the you will click the f sigh as shown is the screenshot below
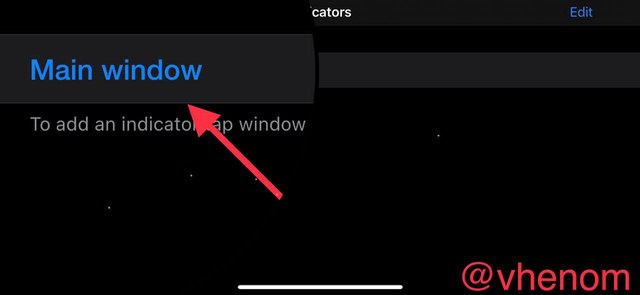
- Step 2- After you must have clicked on the f sin you will see an option of main window you will click on it to add any indicator.
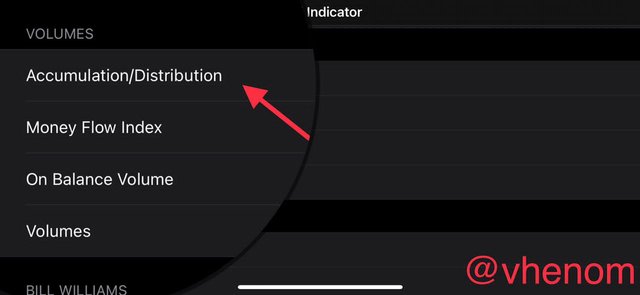
- Step 3- you are almost done all you need to do is to check for the indicator you want add since I want to add the A/D indicator I looked for the indicator. I found it under the volatility Based indicator.
- Step 4- I clicked on the Indicators the it shows all the features of the indicator. Here you can edit the indicator you you choice of view. And it doesn't have any other setting.
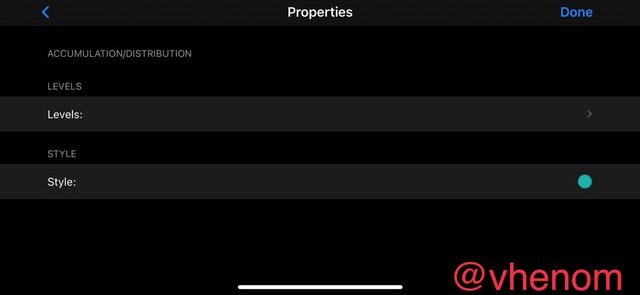
- Step 5- Here there is no other setting in this step just showing you how the indicator looks like.
3- Explain through an example the formula of the A/D Indicator.
The formula for A/D indicator is as follows
MFM is money flow multiplier
MFM = (Close – Low) – (High – Close)/High – Low
How do we calculate the money flow volume
The Current Money Flow(CMFV) =MFM × THE PERIOD VOLUME
Now we can finally calculate A/D indicator
A/D indicator= The Previous Value of A/D + The Current Money Flow Volume
Using Btcusdt chart below I will calculate the A/D indicator line.
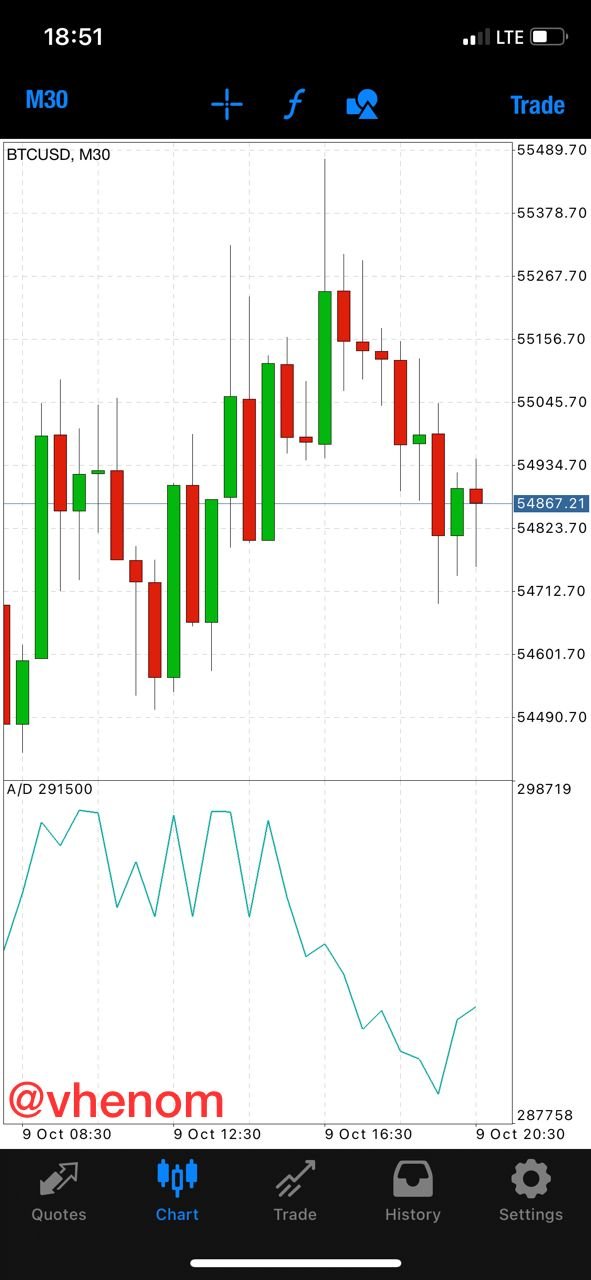
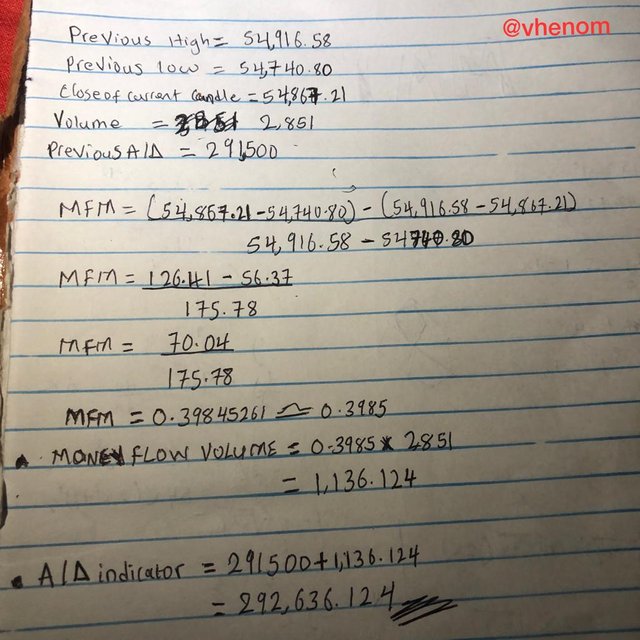
Here is a picture of where I calculated the A/D line.
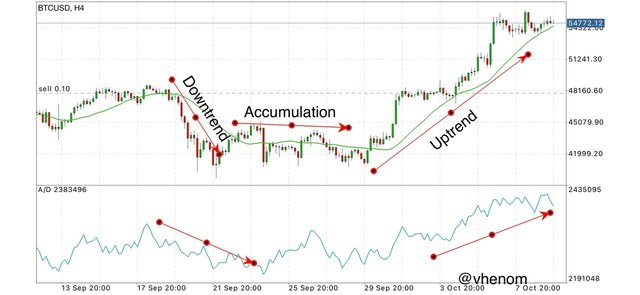
4- How is it possible to detect and confirm a trend through the A/D indicator?
To confirm a trend using the A/D indicator is by the use of divergence because the Indicator's signal is not too strong when it come to detecting market trend. It also detect trend but there are some fake signal that it gives below is a screenshot of A/D indicator detecting trend.
After we have see how the indicator react to the trend now let's look at how to confirm the trend with the indicator with he use of divergence.
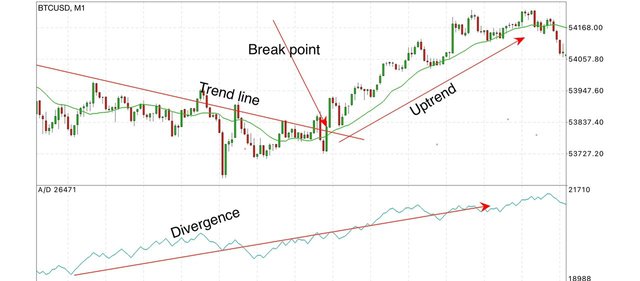
When we wanted to use divergence the trend and the indicator will not be in same direction this is known a divergence. To use divergence to confirm A/D Indicator let's say the trend is bearish and the A/D indicator is trending upward we see that the trend and the indicator are opposing each other then we can draw a trending line because the trend will creat swing lows the once the price breaks the trend line we can place a buy order following the Indicator's bacause the signal is a strong buy signal.
Likewise for a sell order, when the the A/D Indicator is trending downward and the market price is trending upward then we place a sell order when the price breaks the trend line we drew.
See screenshot below
5- Through a DEMO account, perform one trading operation (BUY or SELL) using the A/D Indicator only.
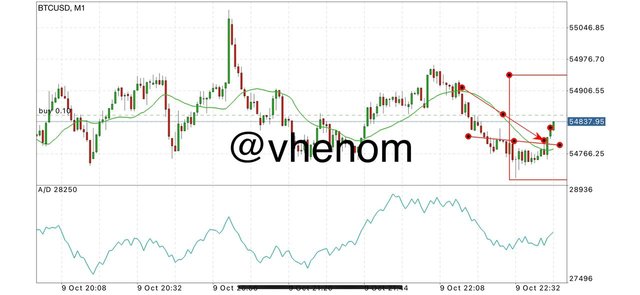
I will be placing a buy order on my metatrader4 trading app using a demo account. After analysing the market I draw a trend line and the market is going downwards while the Indicator is going upward. I wait for the price to break hen I placed a buy order.
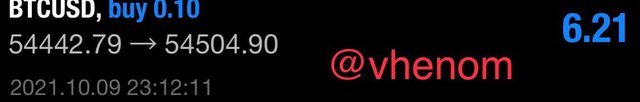
After some minutes of placing the trade it went in profit and hot my take profit. I used 1:1 risk to reward ratio. Below is a screenshot of my profit
6- What other indicator can be used in conjunction with the A/D Indicator. Justify, explain and test.
We can use different indicators to support the signal given by the A/D indicator. But I will suggest we don use another volatility Based indicator we can use trend based indicators like the moving average, Bollinger band or Ichimoku kinko Hyo. I used moving average. The combination of the two Indicators give a pretty good signal. The MA strongly identifying the trend. See screenshot below.
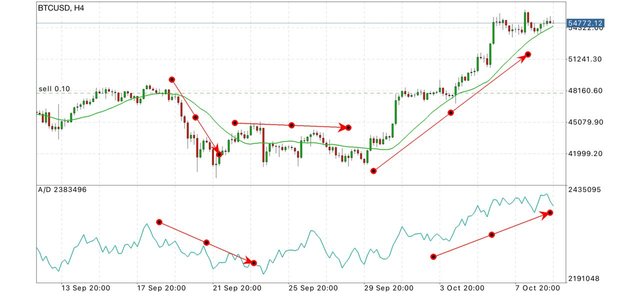 . Even with the combination we shouldn't forget to use an effective risk management like 1:1, 1:2, and so on to protect our account.
Conclusion
The A/D indicator is a volume based/ volatility Based indicator also known as Accumulation or Distribution indicator. It is used to know the the market is in Accumulation or Distribution. So with this indicator we will know when the market trend is in Accumulation or Distribution. With the information from the indicator we will be able to make the right decision.
Am sure we know the meaning of accumulation and distribution but regardless I will explain the meaning of the two trend. When the trend is in Accumulation or Distribution phase it means the market is in range. No particular trend.
CC @allbert