CryptoAcademy Season 4 | Intermediate Course By @allbert –Week 1: Trading With Strong, Weak And Gap Levels.
Introduction
Hello fellow steemians its the beginning of the season 4 of the steemit crypto academy. I'm glad I'm able to participate in the season 3 and now am starting the season 4. Just that the update on the reputation affected me because I can't participate In the advance level yet. I thought there won't be any update for the season 4.
This week lecture by @allbert in on Trading With Strong, Weak And Gap Levels.

Graphically, Explain The Difference Between Weak And Strong Levels. Explain What Happens In The Market For These Differences To Occur.
When we say levels what are the things that come to your mind regarding crypto chart? To me they are support and resistance levels in the chart. These words are not new words to us anymore am sure for everyone who has been participating in the steemit crypto academy courses must have come across this words and know the meaning and how to identify this point. Now this lecture is telling us the there are strong support and resistance level likewise the weak one.
Strong Support And Resistance Level.
As we have learnt before support and resistance level are the levels in the crypto chart where price are force to go back or reverse it's trend. Now to know the strong level, it is determined by the number of times the market price can repels when it get to this point.
Let's assume a strong support level for instance the price has high tendency of reversing when it gets to this points. This is applicable to strong resistance level also. It's take high volume of order to breakout this strong levels.
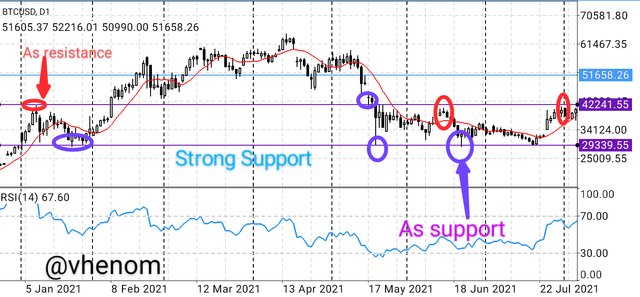
This levels are triggered by the the high pending order placed at this levels. For instance there is a support level and market price is approaching this level, traders will place pending orders at this level so their orders will be executed when price get to this point. The higher the volume of the order will force the price to reverse back.
This high order can also make the price to breakout this levels. For us to know a strong level, we check which resistance or support level makes the price to bounce back several times. Breakout often occur in strong levels but it's not common.
Weak Resistance And Support Levels
Conversely, weak levels are the resistance and support level that are not dependable because price can breakout easily. This support and resistance level are also valid just that the amount of pending order is not enough to reverse the market trend at this levels.
There are both pending buy and sell orders at this levels too. For instance the level is a support level the price is expected to reverse back going in an uptrend when the price get there but the weight of the sell order is more than that of the buy order this will force the price to breakout the support level. It also applicable to the weak resistance level.
This level are easily detectable because it's does not repels the trend of the market severally and breakout has higher tendency than the Strong level.
Explain What Happens In The Market For These Differences To Occur.
This difference is actually determined by the volatility of the market. The more the volume pulling the market will determine if the market will breakout or reverse at this levels. The only difference is that trader target some level as strong and their actions make it a strong one because the amount of pending order that will be placed at that level is ready to force the price to reverse.
The volatility plays a huge role in determining the strong level and weak levels. Even at strong levels there are opposing orders too but for the stronger one the supporting order is more then the opposing pending order while for weak levels the amount of opposing order is more the the pending order support the signal.
Explain What A Gap Is. What Happens In The Market to Cause it
Gap as the name implies are spaces created between two things. Gaps also occur in the crypto market chart. This are spaces created between two candlesticks. This is the space created when the candlestick jump to higher or lower level creating a blank space between the next candlestick.
This are caused by sudden movement in the market. When a trader enters the market with huge volume ( either buy or sell entry) with the huge volume entry it will affect the volume of the market the market very volatile. This will lead to a gap in the chat.
Explain The Types of Gaps
There arefout types of Gaps in a crypto chart and they are.
- Breakaway Gap
- Exhaustion Gap
- Runaway Gap
- Common Gap
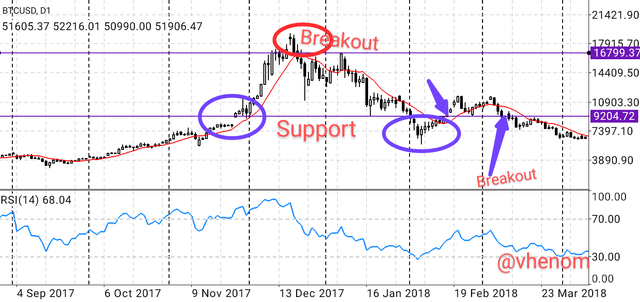
Breakaway Gap: This is a type of gap that occur when the market is not in trading range for instance he market is moving in a sideways direction or it often occurs in reversal trend. This gap occur without any trading activity.
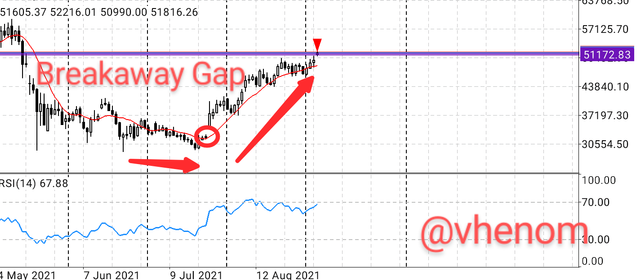
This gap signals the beginning of a new trend and also strong support or resistance level because it can occur at both support and resistance level.
Exhaustion Gap: This type of gap occur nearly at the end of the trend. It can be found in the last swing of the trend. It is cause be the action of the last set of buyers entering in to the market. If we see such gap it is known as the Exhaustion Gap.
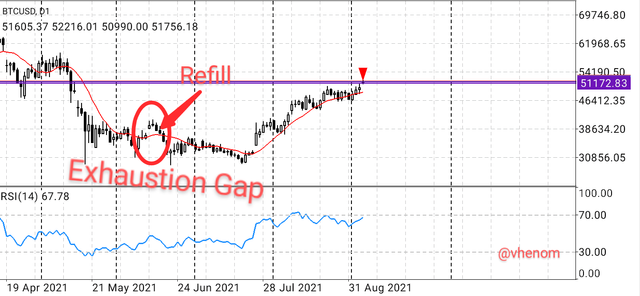
This gap is similar to the runaway gap but the Exhaustion Gap is normally caused high volatility. And the price will fill this gap in the opposite direction. So trader trade the reverse of the gap.
Runaway Gap: This type of gap occur in a new trend. The price significantly open high above previous candle for an uptrend while the the price open below the previous candlestick for a downtrend creating a blank space. This gap often signal continuation of the trend.
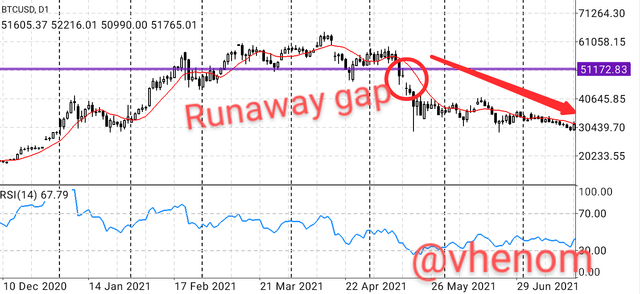
This gap are found in a trending market. Showing strong signal of continuation trend. This gap is caused by massively buying/selling of the market.
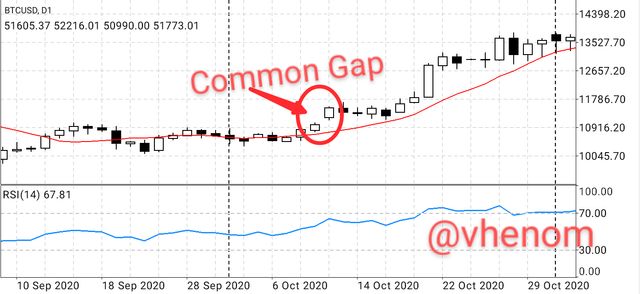
Common Gap: This occur when there is a slight distance between a previous candlestick and a new one. This is not as significant as the the other three types of gaps.
Through a Demo account, perform the (buy/sell) through Strong Supports and resistances. Explain the procedure
Before placing the trade I first analyse the market. I put a resistance line above the chart and it seems as a strong one as price bounce back severaly at that level.
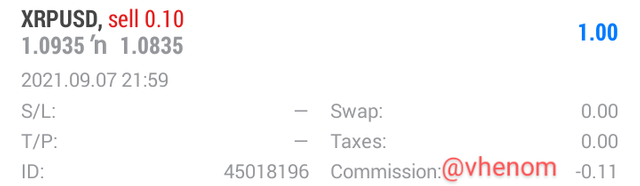
After analysing the chart properly I place a sell order
I used 1:2 risk to reward ratio
Below is the screenshot of my profit
Through a Demo account, perform the (buy/sell) through Gaps levels. Explain the procedure.
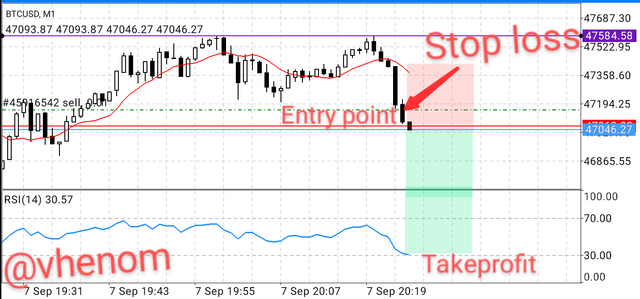
To trade with gap Levels you have to consider which gap it is before you now what to do. I watch the market closely and I the breakaway Gap is the first gap to form. And a new trend is already forming the in the market so I place a sell order because the trend is moving downward
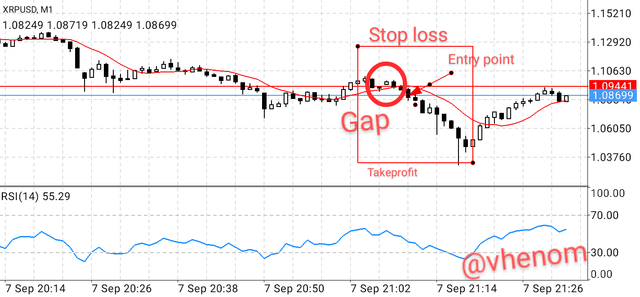
I modified my trade set Stoploss and take profit. I used the 1:2 risk to reward ratio.
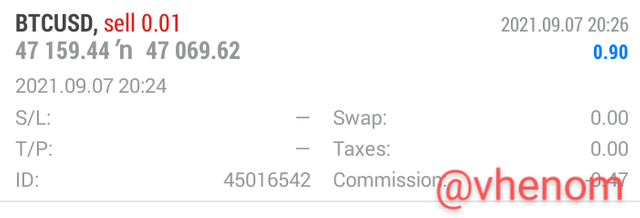
Below is the screenshot of my profit
Conclusion
support and resistance level are the levels in the crypto chart where price repels or reverse it's trend. Now to know the strong level, it is determined by the number of times the market price can repels when it get to this point.
This level are easily detectable because it's does not repels the trend of the market severally and breakout has higher tendency than the Strong level.
CC @allbert