Crypto Academy/ S4W2 - Homework Post for [@lenonmc21]
Introduction
Hello guys it's the 2nd week of the steemit crypto academy season 4. This week course by @lenonmc21 is on ** Basic Trading Strategy Using The Harmonic AB=CD +Fibonacci Pattern**
Let's Get Started

1. Define in your own words what Harmonic Trading is?
Harmonic Trading refers to the believe that trend are Harmonic in nature, which means the trend are divided into smaller or larger trend to predict market price. Harmonic trading refers to the fact that every trend in the market are repeated over and over.
It means when a trend is formed , sooner or later that same trend will be formed again. The new trend will be similar to the old trend. So basically the market trend is like a cyclic motion. Since the trend is repeated. But the repeated trend can't be the same but it will look similar.
Harmonic trading uses Fibonacci retracement levels to establish potential reversal levels in the market. The harmony trading has a pattern that has to be confirmed by the Fibonacci Retracement indicator before it can be valid.
2. Define And Explain What The Pattern AB=CD Is And How Can We Identify It?
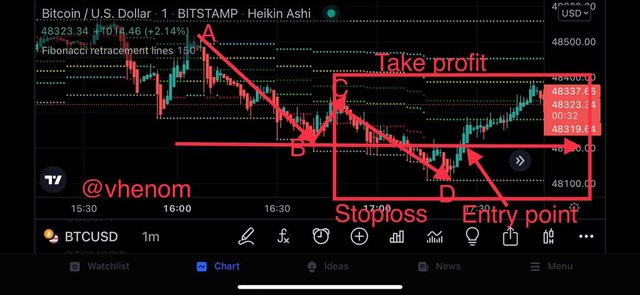
Harmonic Pattern are chart pattern that form a swing point then reverse then it continues in the direction of the previous trend. The help traders to spot trending markets and can be used to predict the future price of an asset
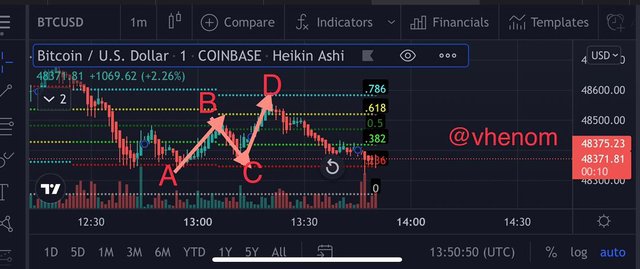
Harmonic Pattern AB = CD is used to predict the price movement of an asset. This is a wave like pattern labelled A,B,C and D used for trading at a very low price. This pattern can either be in an uptrend or downtrend direction. We can use the pattern to maximize our profit.
How To Identify The Harmonic AB=CD pattern
The A is the starting point of this pattern. For an uptrend, the point B will be the point at which the market reverse. Then point C will be the point at the the market resume the trend after a few candles showing downtrend. Point C is always higher the point A the market can't reverse to point A if it does then the pattern is not valid. So point D is the peak of the of the trend C. And this point is always higher than the point B.
This process is also the same for a bearish trend just that the whole pattern will be inverted. With this pattern even if we don't get in the market at point A we can still make enough profit at point C to D.
 .
.
a
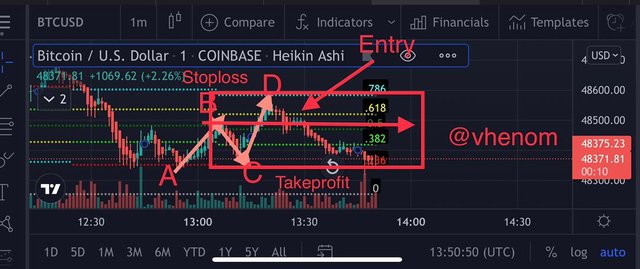
3. Clearly Describe The Entry And Exit Criteria For Both Buying And Selling Using The AB=CD Pattern
Buy Criteria
Before we can consider buying or selling we have to first identify AB=CD first.
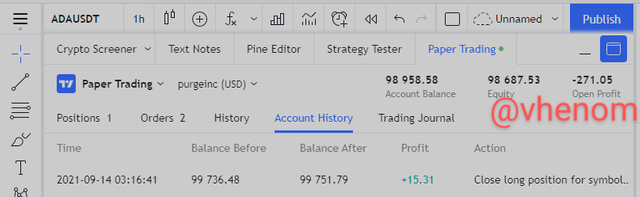
When the analysis is correct I mean when the point C is between the 61.8 and 78.6 of the Fibonacci Retracement and that the D is between 127.2 and 161.8 for the Four point to be valid. If this condition are not met we have to cancel the analysis and wait for another setup
Once we have confirmed this setup, the trend of the market for the pattern will be bearish after the pattern is complete, we will place a buy order because the market will reverse.
See screenshot of a buy order below
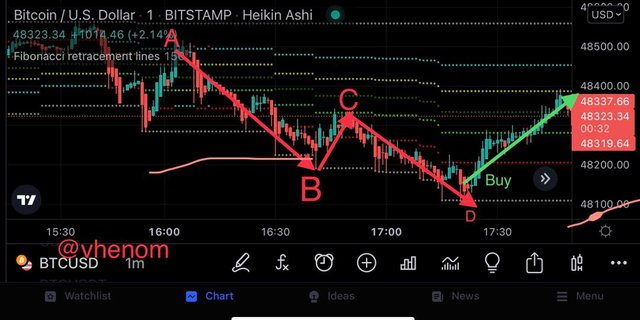
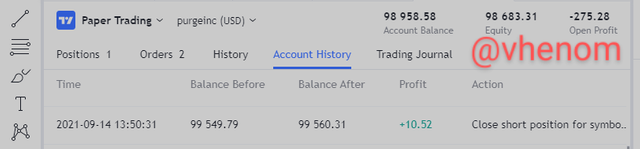
Sell Criteria
Before we can consider selling we have to first identify AB=CD first.
When the analysis is correct I mean when the point C is between the 61.8 and 78.6 of the Fibonacci Retracement and that the D is between 127.2 and 161.8 for the Four point to be valid. If this condition are not met we have to cancel the analysis and wait for another setup
Once we have confirmed this setup, the trend of the market for the pattern will be bullish after the pattern is complete, we will place a sell order because the market will reverse.
Make 2 Entries ( up and down) On Any Cryptocurrency pair Using The AB = CD Pattern Confirming It With Fibonacci Retracement
After following the above analysis for but buy order and sell order on the btcusd pair. See screenshot of the trade an profit below.
Sell Order
Buy Order
Above are screenshot from tradingview mobile app.
Conclusion
Harmonic trading uses Fibonacci retracement levels to establish potential reversal levels in the market. The harmony trading has a pattern that has to be confirmed by the Fibonacci Retracement indicator before it can be valid.
CC @lenonmc21