[Trading Using Wedge Pattern] - Crypto Academy / S5W5 - Homework Post for @sachin08

Hello Steemian!!
In this article, I will discuss the homework provided by @sachin08 which is about Trading Using Wedge Pattern.

[1] Explain Wedge Pattern in your own word
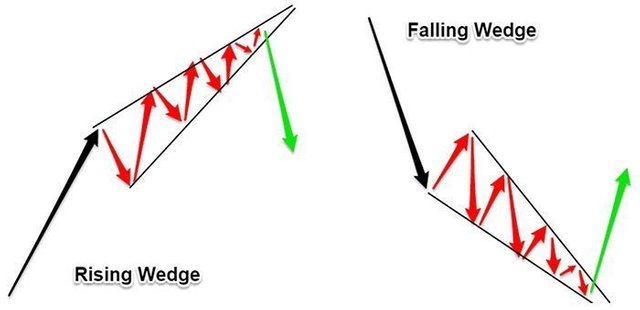
The Wedges pattern is one of the patterns that we can get when analyzing candlestick movements on a cryptocurrency market chart. The Wedges pattern will occur when there is a convergence of the candlestick movement which makes the trend line narrower and forms a smaller end. The trend line at the top will be called the Resistance Line and the bottom trend line will be called the Support Line.

As in the illustration above, we can see an example of how the Wedges Pattern is formed in a cryptocurrency. The Wedges pattern will be formed when the candlestick experiences a slight correction, then the upper and lower limits created by the candlestick slowly shrink until the price finally breaks out with one of these limits and will enter a new trend.
This pattern is a pattern that we often get in the middle of a trend and at the end of an ongoing trend. If this pattern is formed at the end of a trend, then after this pattern is formed, it will give a signal about the reversal of the trend that is currently happening so that traders will be able to take this signal to get out of the trade.
Meanwhile, if it is formed in the middle of a trend, then it can indicate a continuation of the ongoing trend in a cryptocurrency market. This pattern is usually formed because of the saturation of buying or selling in the market for a while, and when the saturation ends, the trend will return as before.

[2] Explain both types of Wedges and How to identify them in detail. (Screenshots required)
The Wedges Pattern has 2 different types, the first pattern is the Falling Wedges Pattern and the second is the Rising Wedges Pattern. These two patterns have their own characteristics.
1. Falling Wedge Pattern
Falling Wedge Pattern is a Wedges Pattern that is formed when the market is experiencing a Bearish Trend. This pattern will be formed when the market is experiencing a decline in price and the candlestick will condense downwards.
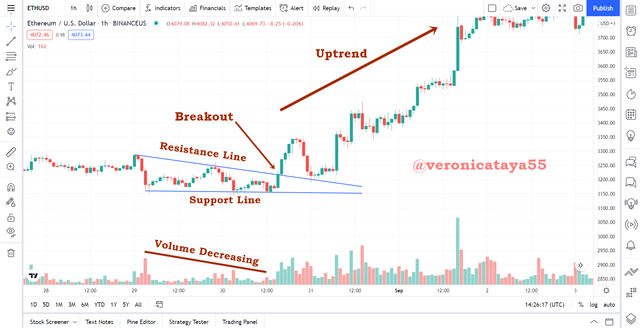
Initially, we will see that this is the beginning of a Bearish Trend which may be long, but the thing we need to know is that when the market is experiencing bearish and the pattern of candlestick formation gradually begins to narrow, this can indicate that soon a trend reversal will occur to become Bullish. For example, we can look at the image below.

In the picture above we can see that initially the ETH price was decreasing and was in the Downtrend phase, but the candlestick started to form a Falling Wedge Pattern where it started to constrict and the Volume Indicator also showed a decline when this pattern was formed. Then until finally the breakout candlestick with the Resistance Line and the trend that was originally Downtrend has reversed into a long Uptrend.
From this example, we can identify the Falling Wedges Pattern with the following conditions.
The trending state in the market is Downtrend.
The candlestick began to experience a decline in price and headed downwards and gradually narrowed.
Draw two Trend lines for the Resistance Line at the top and the Support Line at the bottom. Both lines must slope downwards.
The candlestick should experience some touch with both trendlines. At least 5 total touches from both trendlines.
Volume indicator shows a decrease in trading volume in the market.
2. Rising Wedge Pattern
Unlike the Falling Wedge Pattern, the Rising Wedge Pattern is a Wedges Pattern that is formed when the market is experiencing a Bullish Trend. This pattern will be formed when the market is experiencing an increase in price and the candlestick will be conical upwards.
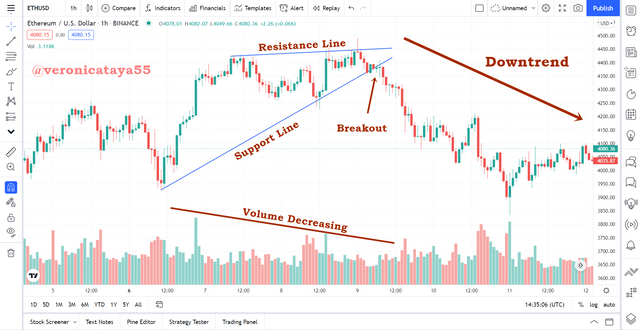
At first, we will see that this is the beginning of a Bullish Trend, but what we need to know is that when the market is bullish and the pattern of candlestick formation gradually begins to narrow, this can indicate that there will soon be a trend reversal to Bearish. For example, we can look at the image below.

In the picture above we can see that initially the ETH price was decreasing and was in the Uptrend phase, but the candlestick started to form a Wedge Rising Pattern where it started to constrict and the Volume Indicator also showed a decrease in trading volume when this pattern was formed. Then until finally, the breakout candlestick with the Support Line and the trend which was originally an Uptrend has reversed into a long Downtrend.
From this example, we can identify the Rising Wedges Pattern with the following conditions.
The state of the trend in the market is Uptrend.
The candlestick began to increase in price and headed upwards and gradually narrowed.
Draw two Trend lines for the Resistance Line at the top and the Support Line at the bottom. Both lines must slope upwards.
The candlestick should experience some touch with both trendlines. At least 5 total touches from both trendlines.
Volume indicator shows a decrease in trading volume in the market.

[3] Do the breakout of these Wedge Patterns produce False Signals sometimes? If yes, then Explain how to filter out these false signals.
We already know that for every pattern there will be times when they will give false signals to the trades we make. The Wedges pattern also often gives us these false signals where it has given a signal of a trend reversal where the Candlestick has broken out with one of the trend lines, but this is only temporary and the trend direction will reverse not as we expected. Let's look at the example below.

In the example above, we can see that the ETH chart has formed a Falling Wedges Pattern which indicates a trend reversal to an Uptrend in the near future. Then the candlestick breaks out with the Resistance Line and Wedges Pattern giving a signal that the trend has reversed from a downtrend to an uptrend.
But it's only temporary, after a while we can see on the chart the candlestick starts to turn downwards again and continues its Downtrend, this is what is meant by False Breakout given by the Wedges Pattern.
To avoid this, we can use the help of an indicator called EMA, I chose this indicator because it is able to show trend reversal moments well by combining 2 EMA lines of different lengths, so that when these two lines intersect it will signal a trend reversal.

For example, we can see in the graph above where I added two EMA lines with lengths of 50 and 100. At the moment of the False Breakout given by the Wedges Pattern. The two EMA lines do not provide any confirmation of the signal given by the Wedges Pattern, in fact, the two EMA lines show a signal called Death Cross where this signal is a signal of a trend reversal to a Downtrend. And indeed we can see after that the trend direction changes to Downtrend and the signal given by the Wedges Pattern is a false signal.
From this example we can see that do not always trust a signal directly given by candlestick patterns, we must always be aware of false signals that may be given and we can also use indicators to filter out these false signals.

[4] Show full trade setup using this pattern for both types of Wedges. (Entry Point, Take Profit, Stop Loss, Breakout)
We have learned various things about the Wedges Pattern, now I will show you how to use this pattern in real trading on a cryptocurrency market in two different conditions, namely using the Rising Wedge Pattern in an Uptrend and a Falling Wedge Pattern in a Downtrend. I'll show you things like entry point placement, take profit and stop loss.
1. Trade Using the Falling Wedge Pattern

In the example above I used the ETH/USD market. We can see that at that time the price of ETH was experiencing a correction and the price had decreased for a long time. Then the candlestick on the chart shows the creation of a Falling Wedges Pattern where the Resistance and Support lines have been made point downwards. Then the Candlestick has also touched both lines 5 times, and the Volume indicator also shows a decrease in trading volume that occurred in the ETH market.
After a while. Candlestick breakout with Resistance Line and indicates a change in trend direction to Uptrend. At this moment I started to enter the trade, then I set the Stop Loss Level slightly below the Support Line and I set the Take Profit Level above the highest limit of the Resistance Line so that the Risk/Reward Ratio I used was 1:2.
2. Trade Using the Rising Wedge Pattern

In the example above I am still using the ETH/USD market. We can see that at that time the price of ETH was experiencing a significant price increase. Then the candlestick on the chart shows the creation of a Rising Wedges Pattern where the Resistance and Support lines that have been made point up. Then the Candlestick has also touched both lines 5 times, and the Volume indicator also shows a decrease in trading volume that occurred in the ETH market.
After a while. The Candlestick breaks out with the Support Line and signals a change in the direction of the trend to a Downtrend. At this moment I started to enter the trade, then I set the Stop Loss Level slightly above the Resistance Line and I set the Take Profit Level below the highest limit of the Resistance Line so that the Risk/Reward Ratio I used was 1:5.

[5] Conclusion
Wedges pattern is a pattern that has the ability to show a trend reversal in the market very well. This pattern has 2 different types of patterns where these two types of patterns can be used according to the conditions of the candlestick pattern shown on the chart of a cryptocurrency, the two types of patterns I mean are Rising Wedge and Falling Wedge. However, we must also take into account the existence of false signals that the Wedges Pattern may give and we must use auxiliary indicators to confirm the signals given by this indicator.
Thanks to professor @sachin08 for giving me a very good topic regarding cryptocurrency and trading.