Reading Special Bar Combinations - Steemit Crypto Academy - S5W8 - Homework Post for @sachin08
Hello fellow steemians, I believe you are all doing great. This is the 8th and last week of season 5 in the steemit crypto academy. Below is my submission to the assignment given to us by professor @sachin08.
1- Explain Price Bars in your own words. How to add these price bars on Chart with proper screenshots?
PRICE BARS
Price bar is one of the basic building block or tool of technical analysis that defines and describes the trading actions of cryptocurrency assets embedded in bars and plotted as a series of prices for a given period of time. The trading action in the context means, all transactions (buying and selling of assets) conducted during the period. Price bars are often referred to as OHLC charts (open-high-low-close charts) to differentiate them from traditional bar charts used to depict other forms of data and allows traders to see patterns more easily.
Price bars and it's placement on cryptocurrency charts provides a lot of information about the market. It doesn't actually take much practice to start reading the minds of the crypto market with the use of price bars along with small patterns detected by indicators. All you need as an investor or a trader is patients, thoughtfulness, and an imaginative mind.
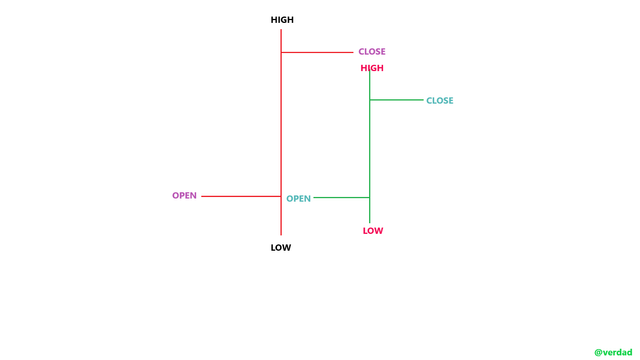
Price bars consists of only four components which shows the opening price of a cryptocurrency asset at the beginning of a specific time period denoted by a left horizontal line, and a closing price which is the last price for the time period denoted by a right horizontal line. These horizontal lines are also called "tick marks". The high and low prices are represented by the top and bottom of a virtical bar respectively. The high price is the highest price traded during a time period whilst the low price is the least price traded in a suggested time period.
HOW TO ADD A PRICE BAR ON A CHART
Adding a price bar on a chart is not something you should stress yourself about. There are a lot of famous cloud based charting softwares available to help you determine price signals using bars. But due to the lesson, lets limit ourselves on only Tradingview.
The first thing you need to do is connect your device to the internet and search for Tradingview using any browser of your choice or you can simply click on the link to provide to access it. Tradingview
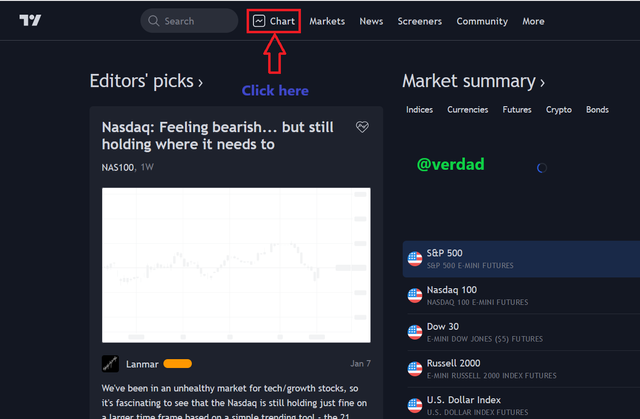
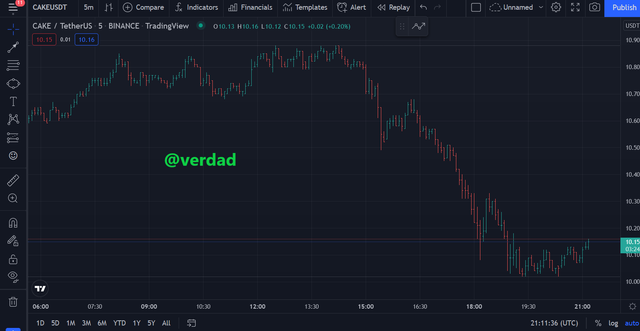
On the homepage, locate and click on Chart to view the current market prices of any asset as shown below.
.png)
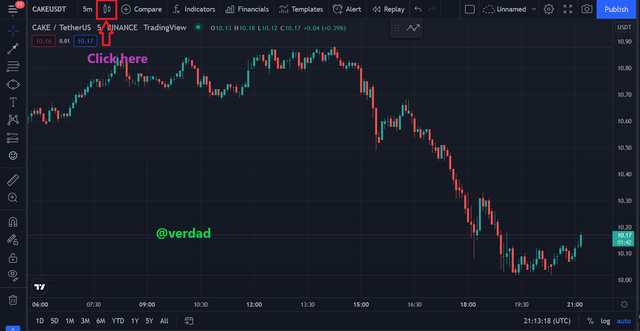
Now, from the list of options provided on the top side of the newly opened page, locate and click on the candlestick option as shown below.
.png)
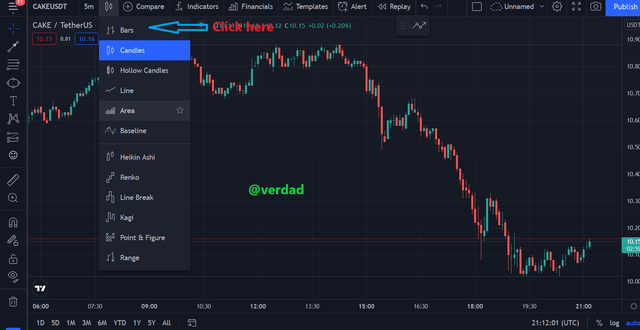
From the pop-up option that appeared on the screen, look through and click on Bars just like in the image uploaded below.
.png)
As seen, price bar has succesfully been added to chart. It was very simple right?.
.png)
2.How to identify trends using Price Bars. Explain for both trend. (Screenshots required)
As I mentioned earlier, price bars can be used to identify the trend of an asset. Before I give a vivid explanation of how to use price bars to identify trend direction, it is be very good if I define some basic things which will help our knowledge in trend identification.
Identifying trends using price bars on a cryptocurrency chart is the same for any other chart type most specifically the candlesticks. So with a little understanding of how it works, you can simply apply that knowledge to correctly spot trends. Let's move on to what I am trying to let you understand here.
Uptrend identification using price bar
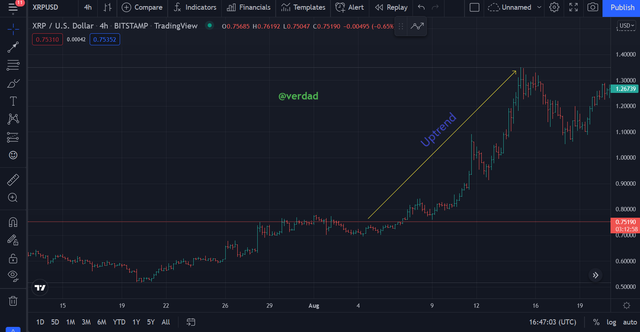
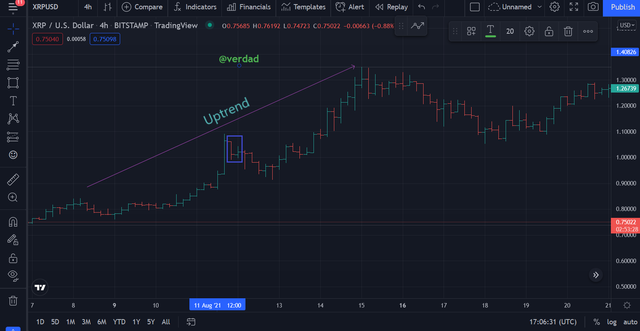
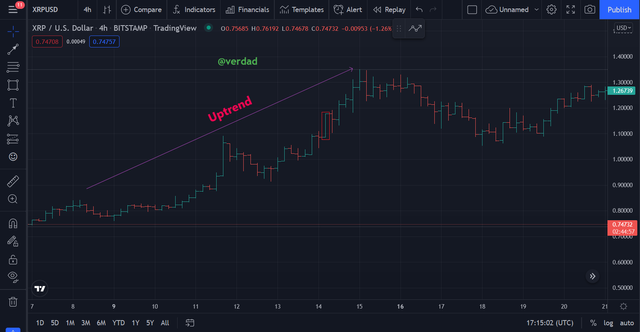
An uptrend describes the price movement of a cryptocurrency asset when its overall direction is dragged upward by the buyers. In the occurrence of an uptrend, each successive crest and trough is higher than the ones found earlier in a trend with respect to different time periods. Meaning, an uptrend is composed of higher lows and higher highs. So as long as the price is making these series of higher lows and higher highs, we can simply detect it using price bars as shown below.
%20for%20uptrend.png)
From the above image, it can be seen that, the price bar is making a series of higher highs and higher lows caused by the demand of buyers. When you take a clear look at the chart, you will notice an extreme colour difference (green dominating red's) indicating that the market is moving in an upward direction.
Bearish trend identification using price bar
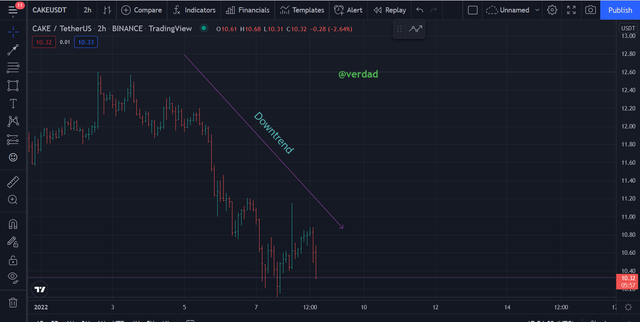
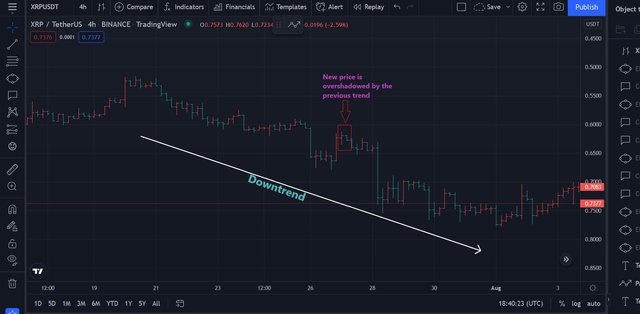
A bearish trend describes the price movement of a cryptocurrency asset when its overall direction is dragged downward. In the occurrence of a bearish trend, each successive crest and trough is lower than the ones found earlier in a trend with respect to different time periods. Meaning, a bearish trend is composed of Lower lows and Lower highs. So as long as the price is making these series of Lower lows and Lower highs, we can simply detect it using price bars as shown below.
%20for%20downtrend.png)
From the above image, it can be seen that, the price bar is making a series of Lower highs and Lower lows caused by the excessive supply of the asset by seller's. When you take a clear look at the chart, you will notice an extreme colour difference (red coloured bars dominating the green ones) indicating that the market is moving in a bearish trend.
3. Explain the Bar Combinations for Spending the Day inside for both conditions. (Screenshots required)
Bar combination for spending the day inside occurs when the price bars of a day trading high and low falls within the boundaries of the preceding day or days' highs and lows. This is mainly because of the indecision in the market showing small price movements relative to the prior trading days. You should also note that when multiple inside days occur consecutively, it means that there is a higher probability that the cryptocurrency asset will soon break out from its current trend. It can simply be determined by two (2) case scenarios. Thus; the first case senario is that, the high of the prior day virtical price bar must be higher than the new day's virtical price bar. The second senario is that, the low of the prior day virtical price bar should or must be lower than the new day's virtical price bar.
Since we now know all the scenarios associated with inside day, lets move on to identifying them in a bullish and bearish trend with tha aid of price bars.
How to identify Spending the day inside in a bullish trend.
%20for%20bulish%20inside%20bar.png)
As we can see from the picture above, the bearish price bar (bar with the colour red) completely overshadowed the bullish price bar (bar with the green color). The long red virtical bar is the previous day trading bar whilst the small green bar represents the new day's bar. It can clearly be seen that, the previous day trading high is higher than the new day's high, also the new day's low is higher than that of the previous day.
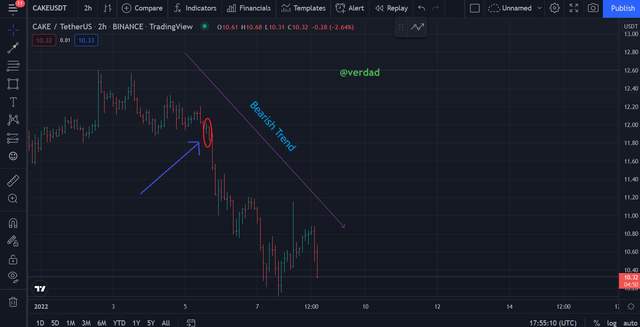
How to identify Spending the day inside in a bearish trend.
%20for%20bearish%20inside.png)
As we can see from the picture above, the bearish price bar (bar with the red color) completely overshadowed the bullish price bar (bar with the green color). The long red virtical bar is the previous day trading bar whilst the small green bar represents the new day's bar. It can clearly be seen that, the previous day trading high is higher than the new day's high, also the new day's low is higher than that of the previous day.
4- Explain the Bar Combinations for Getting outside for the Day for both conditions. (Screenshots required)
Bar combination for spending the day outside occurs when the price bars of a preceding trading day high and low falls within the boundaries of the new day or days' highs and lows. It is simply the vise versa of the inside day as seen in the below chart for bearish and bullish trends.
%20for%20bearish%20outside%20bar.png)
As we can see from the picture above, the bearish price bar (bar with the red color) completely overshadowed or out ranged the bullish price bar (bar with the green color). The long red virtical bar is the recent or new day trading bar whilst the small green bar represents the previous day's bar. It can clearly be seen that, an open occurred at the high of the new day's bar with a close at the low.
How to identify Spending the day outside in a bullish trend.
%20for%20bullish%20outside%20bar.png)
As we can see from the picture above, the bullish price bar (bar with the green color) completely overshadowed or out ranged the bearish price bar (bar with the red color). The long green virtical bar is the recent or new day trading bar whilst the small red bar represents the previous day's bar. It can clearly be seen that, an open occurred at the low of the new day's bar with a close at the high.
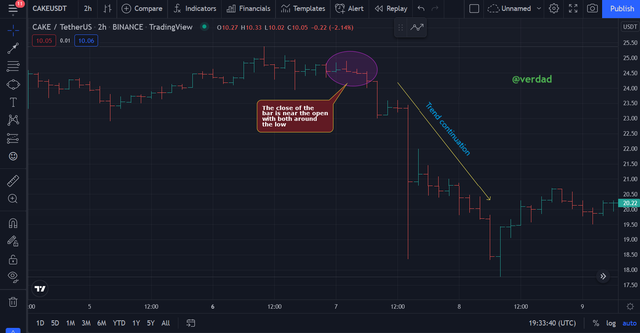
5- Explain the Bar Combinations for Finding the close at the open for both conditions in each trend. (Screenshots required)
Bar combination for spotting the close at the open occurs when the open of the virtical price bar is near or almost in line with its close bar and found approaching the low or high of that same bar. It can take place during a bullish or a bearish trend. When a price is bullishing and you manage to spot the open and close bars near each other and approaching the low, it means that there is a higher possibility that the trend will/would reverse. Also, when the prices are approaching the high of the virtical bar, it mean that there is a greater chance for the price to continue bullishing. Dont get confused when you see or spot them in a bearish price movement. Its just the vise versa of the bullishing movement.
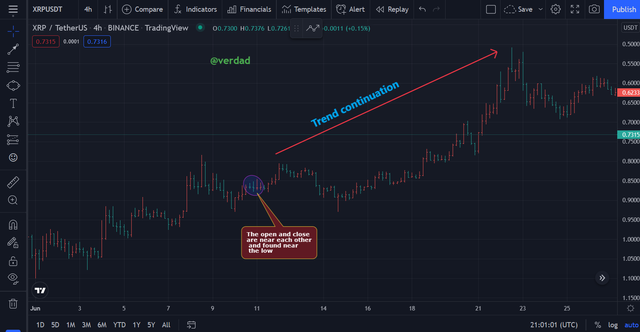
Finding the close at the open in a bullish condition.
.png)
As seen from the image taken from tradingview above, when the close is at the open or near it and both are seen or found near the high then it gives us a clear signal of a trend continuation. But at the instance where the close is near the open and they are both found approaching to the low, it gives us a signal that, there is going to be an occurrence of a trend reverse.
Finding the close at the open in a bearish condition.
%20for%20close%20and%20open%20%20near%20the%20low%20.png)
As seen from the image taken from tradingview above, when the close is at the open or near it and both are seen or found near the low then it gives us a clear signal of a trend continuation. But at the instance where the close is near the open and they are both found approaching to the high, it gives us a signal that, there is going to be an occurrence of a trend reversal.
CONCLUSION
Price bars are a series of a bars on a cryptographic chart that determines the movement of price assets in a particular direction over a specific of time period. It is like the normal candlesticks which enable us to extract quality information about an asset's price and trend, so dont get confused whenever you see them on a chart. This was really a nice lecture professor @sachin08, keep it up.
Hello @verdad. Thank you for participating in Crypto Academy Season 5 Week 8 Beginner's Course.
You have edited the post and added the images after the deadline.
Remark - Homework Task Disqualified