Crypto Trading With Linear Regression Indicator /Crypto Academy /S5W5-Homework Post for kouba01

Now to the assignment proper.

Discuss your understanding of the principle of linear regression and its use as a trading indicator and show how it is calculated?
Principle of Linear Regression
The Linear Regression on it own if not applied as an indicator is mathematically expressed as a line called a linear regression line were it is drawn between some plotted points to reduce the squares between those points. The plotted points are as a result of correlation between two quantities.
Now the linear regression indicator takes into consideration the total plotted points of a linear regression line within a time frame. So the Linear Regression Indicator is more like the summer of the plotted points on the linear regression.
Now progressing to the linear regression Indicator this is an indicator that seeks to identify the trend and also follows trend. This is done in a similar way as a moving average but it is not a moving average and the two should not be confused.
So while the moving average also identify trends but then it is more responsive to volatile market but then the linear regression indicator response to trend direction very quickly other than responding to every details on the market price chat like the moving average does which leads it to producing several lags during trend progression.
How to Calculate
Understanding the calculation of any indicator is very important especially for traders who really want to get in-depth into trading. The linear regression line which has a set of plotted data above and below a drawn line has a basic duty of predicting future price in the present best fit drawn linear regression line. So let's proceed to the formula. The formula is usually Calculated over a certain period which can be adjusted to what ever the trader needs, but then the default period we use here is 14, therefore the LRI indicator is usually calculated over 14 period.
Y = a + bx
Where our a and b values will be sorted out.

Where;
x = Current time period.
y = Closing Prices.
n = Number of periods choose.
With the above formula the value of Linear Regression Indicator can be Calculated. But then it is a very complex calculation therefore a trader needs some level of carefulness and time to run this over.

Show how to add the indicator to the graph, How to configure the linear regression indicator and is it advisable to change its default settings? (Screenshot required)
Adding the Linear Regression Indicator to a Chart
- First of all log into the https://www.tradingview.com/ platform and choose a pair of your choice. Here I choosed BTCUSD pair as seen below.
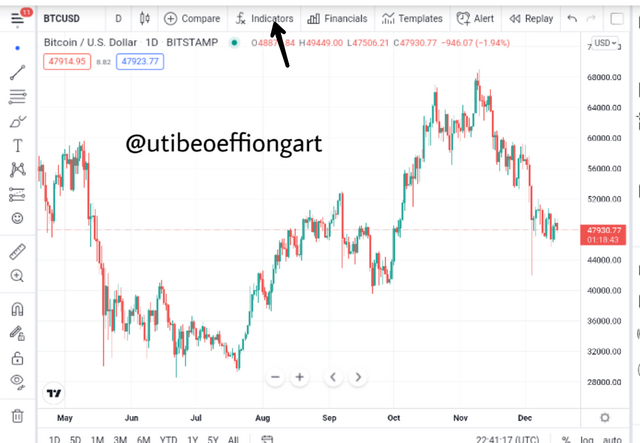
Screenshot from tradingview
- After that, I choosed the indicator symbol as seen above and then the page below comes up.
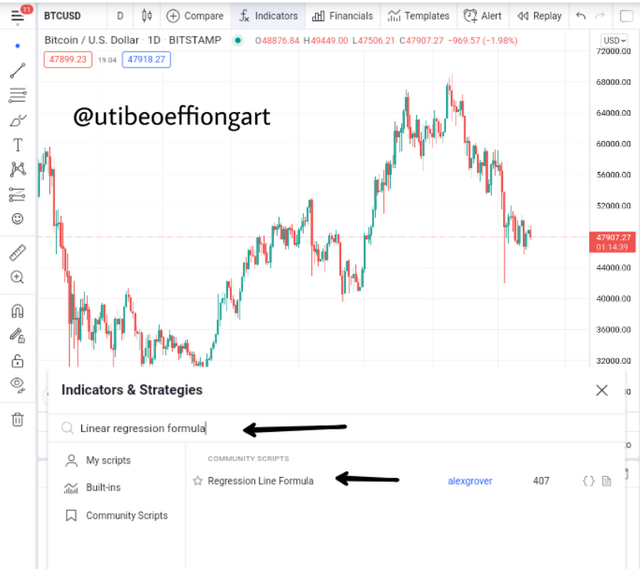
Screenshot from tradingview
- And then I choosed the indicator of my choice in this case the Linear Regression Indicator and immediately the indicator is applied to the chart as seen below.
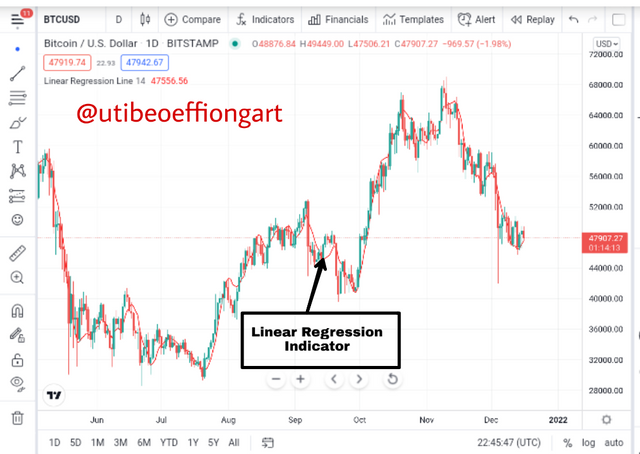
Screenshot from tradingview
The Linear Regression Indicator Configuration
Now after the application of the indicator as seen above, to configure it we proceed to click the setting button as seen below.
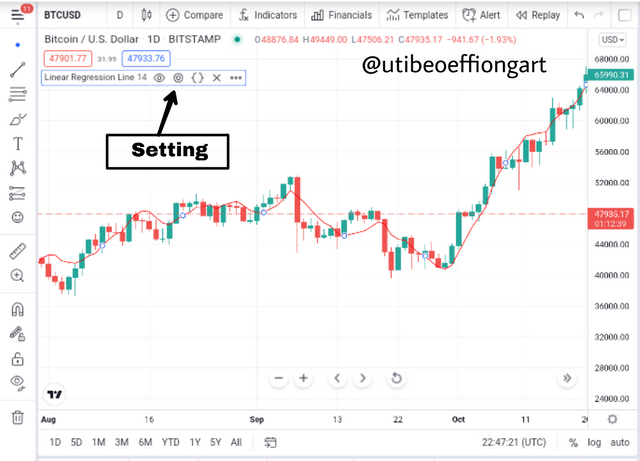
Screenshot from tradingview
Immediately after clicking the setting button, the configuration portal comes up displaying the style, input and the visibility
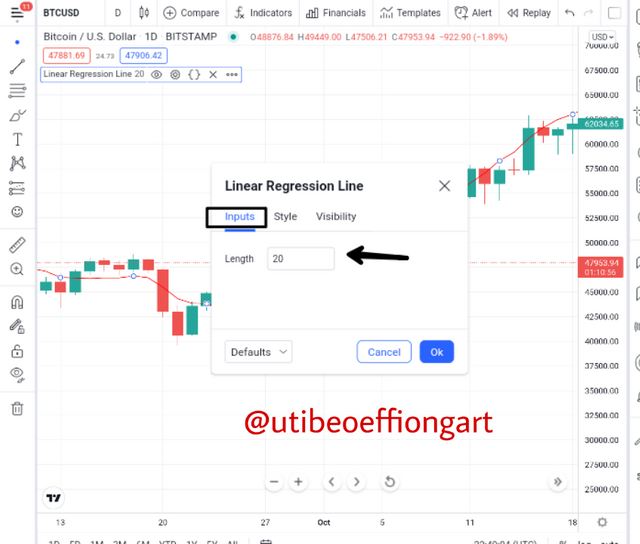
Input
Screenshot from tradingview
The input setting part of the indicator helps to input or set the period or length of the indicator. Here the trader might decide to allow the default period to remain or decide to make changes depending on what he/she wants. But here I changed mine to 20 instead of the default 14.
Style
Screenshot from tradingview
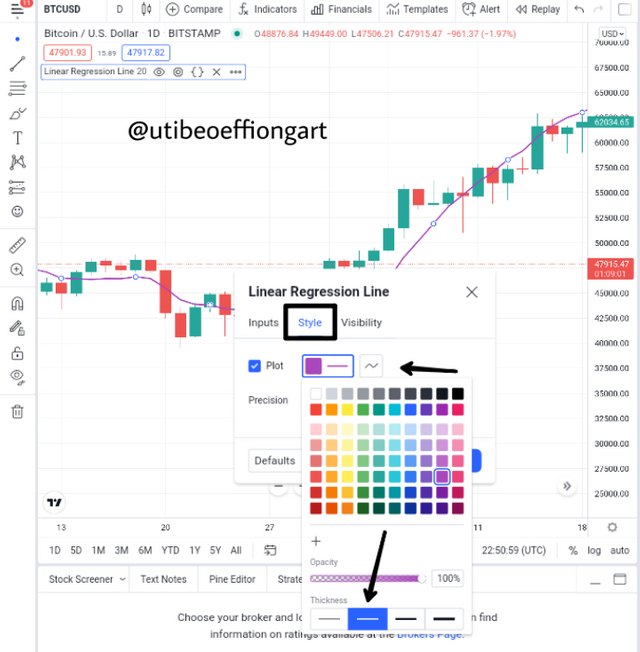
The style part of the indicator setting helps to edit or change the color of the indicator as you can see for mine I changed the color from red to purple as seen above.
And if you notice I also changed it from the thin line thickness to a bit of a more thicker indicator line.
Visibility
Screenshot from tradingview
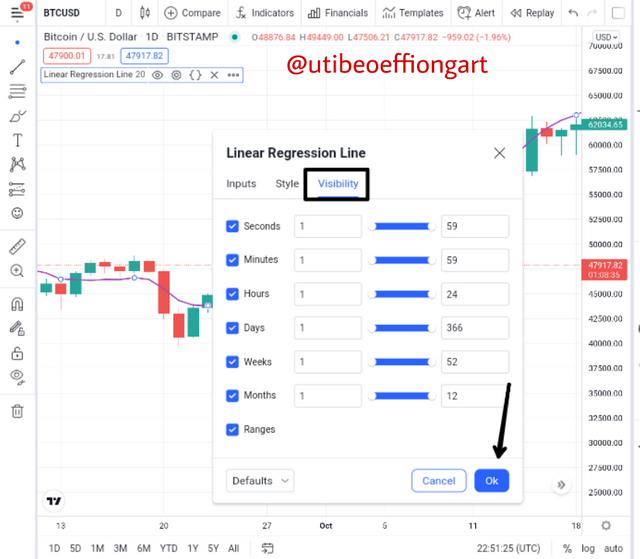
Now the visibility part of the indicator helps edit it set the display pattern of the indicator. While some traders like noisy chart or indicator display some don't like such, so depending on the style of the trader he/she sets it according.
Screenshot from tradingview
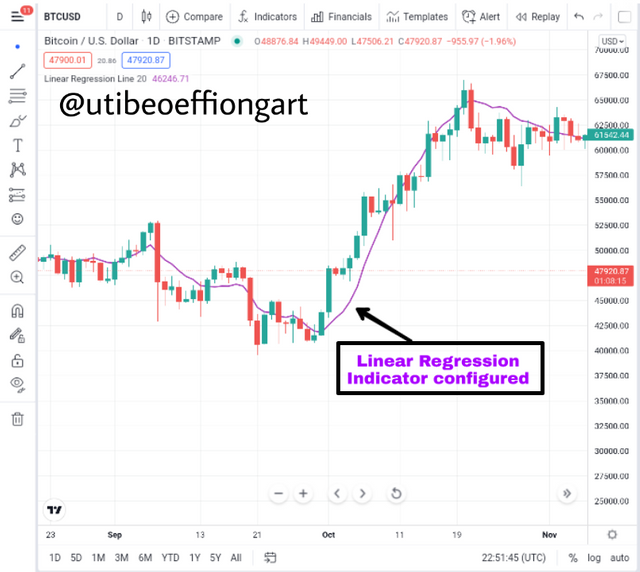
Above is the application of the set indicator, with the input, style and visibility set accordingly.
Is it advisable to change its default settings?
Now it is not always advisable to change the default settings of an indicator especially when the indicator is a complex one because the creator of the Indicator knows why he or she kept it at that which means it is best at that point.
But then there are experience traders who understands or know what they want in a trading expedition because of thier level of experience and conversance with that particular indicator. If you look at the indicator configuration above I actually did some editing from the default settings and you can see the beauty and smoothness it added to the chart.
Apart from the input part of the indicator configuration, the style can be changed, especially the color, because looking at the default color that came the indicator it was a bit merged with the chart candles red color, so to change that, that will add more niceness to the indicator and reduce confusion during trading analysis.

How does this indicator allow us to highlight the direction of a trend and identify any signs of a change in the trend itself? (Screenshot required)
Uptrend Identification
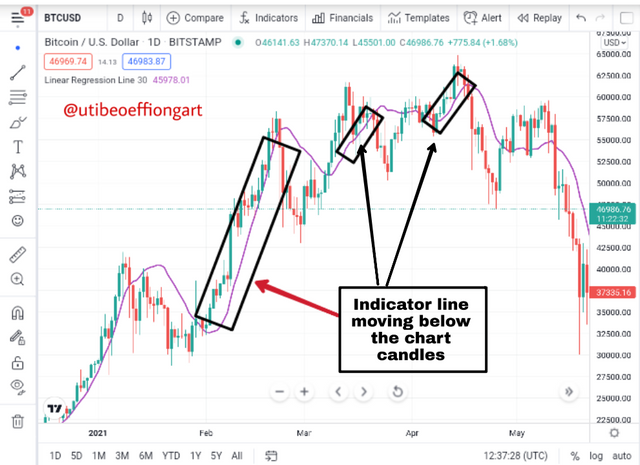
Screenshot from tradingview
Now the Linear Regression Indicator moves in a similitude of a moving average, though the linear regression indicator does not average the candles. To get the Uptrend using the linear regression indicator then you just have to observe the movement of the indicator line. If it moves below the candle sticks as seen above then it entells a bullish trend.
Looking at the BTCUSD asset chart above there is a change in trend direction after a bit of a downtrend move and like I said above the indicator line moves it crosses to the back of the candle sticks which signifies an uptrend.
Also importantly, a trader can just use a trend trailing method to identify the uptrend here were he/she can
Downtrend Identification
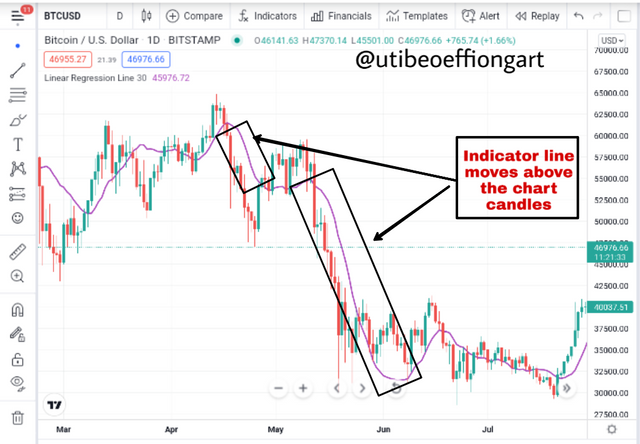
Screenshot from tradingview
Now the downtrend identification using the LRI indicator is also as simple as the Uptrend identification. Here the indicator line crosses candle sticks and proceeds above the candles, this shows a downwards trend.
So looking at the BTCUSD asset chart above, at the marked points, we can see as the LRI indicator lines moving above the candle sticks telling the trader of a downtrend.
Like I had made mention above while explaining the upward trend that the LRI movement alone is also greatly enough to show the trader which trend to expect, except in cases of false signal. So it is easy for a trader to just look at the chart and trail the market trend using the indicator movement direction.
Trend Reversal Identification.
Now trend reversal is experienced when there is an exaution of a particular trend in that they is a change in that trend direction, when this occurs it is said that there is a trend reversal. Let's see how to identify that using the LRI indicator.
Uptrend Trade Reversal
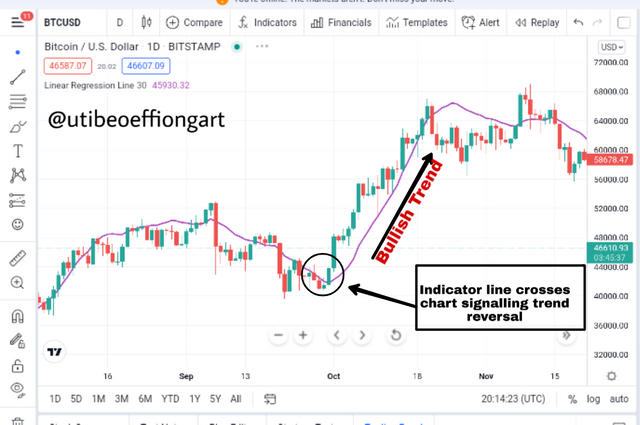
Screenshot from tradingview
Now, very simply to show a trend reversal for an Uptrend, this is seen when the indicator line crosses the chart to proceed to the uptrend. So the chart was in a downtrend with the indicator trailing it and then suddenly crossed, immediately this cross occurs a trader should always look out for an uptrend trade reversal.
Downtrend Trade Reversal
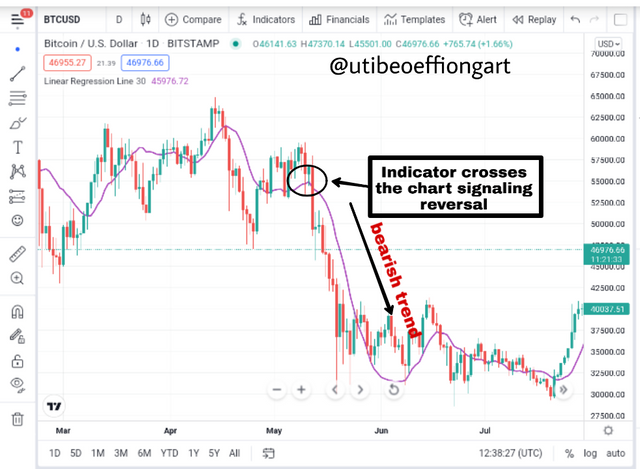
Screenshot from tradingview
Very simply also a trader using the linear regression indicator should always look out for a crossing which is a vital signal for a trend reversal. Here the indicator crosses the chart and proceeds downwards signalling a reversal for a bear trend.
So on a general note when the linear regression indicator is proceeding on a particular trend, a trader should watch out for a crossing on the candle stick for a possible trend reversal.

Based on the use of price crossing strategy with the indicator, how can one predict whether the trend will be bullish or bearish (screenshot required)
Trend Prediction Using the Linear Regression Indicator with Price Crossing Strategy
Now like I have analysed in the previous question stating out each reversal strategy of the indicator. So I'll make a very analogy below to further explain.
Uptrend Trade Prediction

Screenshot from tradingview
Now the price or candle stick crossing strategy using the LRI indicator is a very interesting one because it makes the whole process very simple and straight forward.
So assuming a trend was in a downwards direction from the onset or from when the trader stated observing the market and the at some point because certainly the market can't keep at a particular direction but then s trader needs to know the next direction so as to make critical decision and make it fast, the indicator line which was trailing the candle stick at the top since it was in a downward motion will cross the price. So immediately a trader catches that crossing he should get ready for a reversal, which in this case it will be an uptrend.
Downtrend Trade Prediction.

Screenshot from tradingview
Here like also explained afore, the process is very simple. The chart proceed's in an uptrend with the indicator trailing it. It is very important to understand that increasing the period of the Indicator has a way of making the indicator line shift from the chart candles thereby giving the trader a better view.
So the trader in this case also looks out for a crossing during the uptrend movement and immediately this is achieved then the trader should look out for a reversal. In this case it will be a reversal to a downward direction giving a bearish trend.

Explain how the moving average indicator helps strengthen the signals determined by the linear regression indicator. (screenshot required)
Moving Average Support on the Linear Regression Indicator
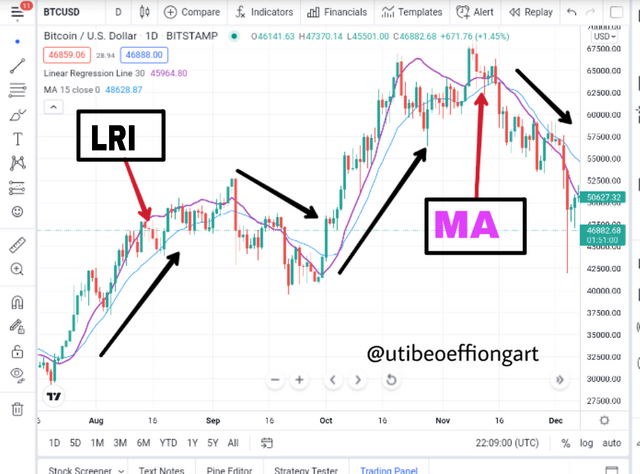
Now it is important to understand that the moving average act in almost the same manner as the linear regression indicator also trailing the chart as the linear regression indicator does. But then the linear regression allows the trader trail price more perfectly and effectively because if the correlation between the price and indicator as in when it is plotted on a straight line.
But then we can also experience false and late signals one's in a while which we will use the moving average as a means of correction or more confirmation of a trend.
Screenshot from tradingview
Now it is always very important to note that a single indicator on a trading expedition is not always advisable so it is always very much important to support a trade with up to 2 indicators for a more accurate and less error trade expedition.
So in this case we incoperated the moving average to see if the linear regression indicator of giving a true trend (bull or bear) signal. So looking at the chart above, the moving average corresponded almost simultaneously to the linear regression indicator as it moved. But then there is one very notable difference between the two indicators in that the linear regression indicator trailed the price more closely than the moving average. This can also be of an advantage to ye trader in that the moving average will go ahead to make moves not waiting for the candle sticks to make a finish of it turns which could slow the traders decision making.
 .
.
Do you see the effectiveness of using the linear regression indicator in the style of CFD trading? Show the main differences between this indicator and the TSF indicator (screenshot required)
Linear Regression Indicator effectiveness in the CFD trading style
The CFD which means Contract for Different where a buyer a seller come into agreement to make sakes at a particular agreed contract time agreed. Here the linear regression indicator is very effective here because using this Indicator which has alot of bearing with following the trend. Here the identification of the buy and sell point becomes easily recognize so the terms of contract can be settled with that.
The linear regression indicator which is very suitable for larger trading periods and follows the trade, this is just what the parties involved in the CFD needs, just that price movement so they could agree on a contract on the entry and exit of the trade and the linear regression indicator is very suitable for that since it is a good Price following indicator.
Differences between this indicator and the TSF indicator
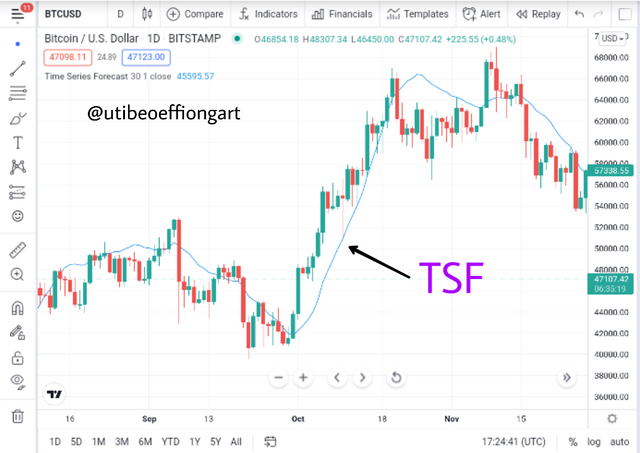
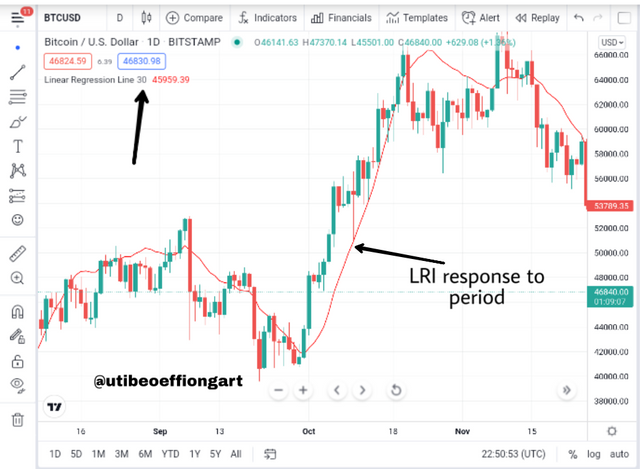
To me there is almost no difference between the TSF meaning the time series forecast with the linear regression indicator because both indicators at the same time frame will give the same movement and price following method as seen below.
Screenshot from tradingview
Screenshot from tradingview
So what is done is that the trader sets one Indicator at a short term or period interval and in this case it will be the TSF Indicator because setting the linear regression indicator to s short term will only make the trade reading and interpretation more difficult because if the closeness if the indicator to the candles when in short term. But then that effect is not experienced in the TSF Indicator which response well to short term periods. So the both can be used to complement each other.

List the advantages and disadvantages of the linear regression indicator
##Advantages of the Linear Regression Indicator
It is very easy to read compared to other Indicators since it follows trend.
Trend reversal is made easy to track since it is captured at a point of exhaustion of a trend.
Works well with other Indicators
Larger periods makes it more smooth and easy to read to read unlike other Indicators.
Disadvantages of the Linear Regression Indicator
It does respond to every details of the market moves so at periods of high volatility this Indicator will be of a great disadvantage.
Can't be used as a stand alone Indicator because if possibilities of false signals.

Conclusion
Conclusively, the linear regression indicator is another very interesting Indicator which we have seen that it does the work of following trend which is a very good indicator for aiding traders follow trend to easy price forecast.
Another Indicator that we have to come to find out that it works very closely as this is the Time series forecast Indicator but then we notice that this particular Indicator works very well at a lower period unlike the Linear Regression Indicator. It is important to always use the linear regression indicator with other Indicators to avoid false signals during trading expeditions.
Thank you