Crypto Academy / Season 3 / Week 7 - Homework Post for @yousafharoonkhan | How to create an account on TradingView, how to use indicators, tools, features of tradingview

Now to the assignment proper.

Defining the TradingView site and how to register an account in tradingview? what are the different registration plan?(screenshot necessary)
TradingView
TradingView is Platform were market analysis take have a clear view of the chart of any Cryptocurency pair of Choice provided it is available. The site or platform shows the day to day happenings of the stocks, forex and cryptocurrency.
TradingView is the creation of Stan Bokov, Denis Globa, and Constantin Ivanov in the year 2011 to help traders successful manipulate chart to thier usefulness.
The TradingView also offers users lots of tools and features to make the Technical analysis of chart easy and convenient. A Very powerful feature or ability of the trading view is the availability of indicators, which helps users and traders take better trading decisions.
Amist all the aforementioned TradingView has in it a social media platform were Traders and Investors can discuss and dialogue about the Crypto market and stock ecosystem.
How to register an account in tradingview
- First of all log into https://www.tradingview.com/ then the page below will come up if you had not signed in already.
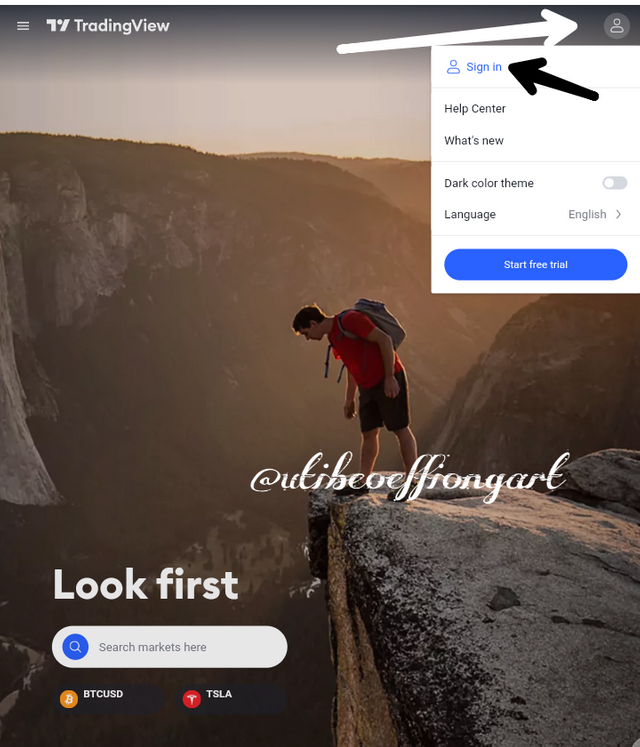
- Following the, then click on sign in and the page below will come up.
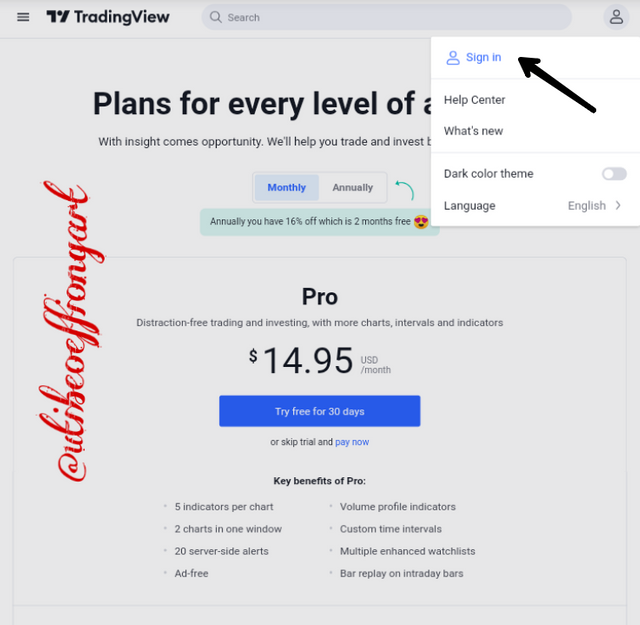
- Again click on sign in and the pages below will come up.
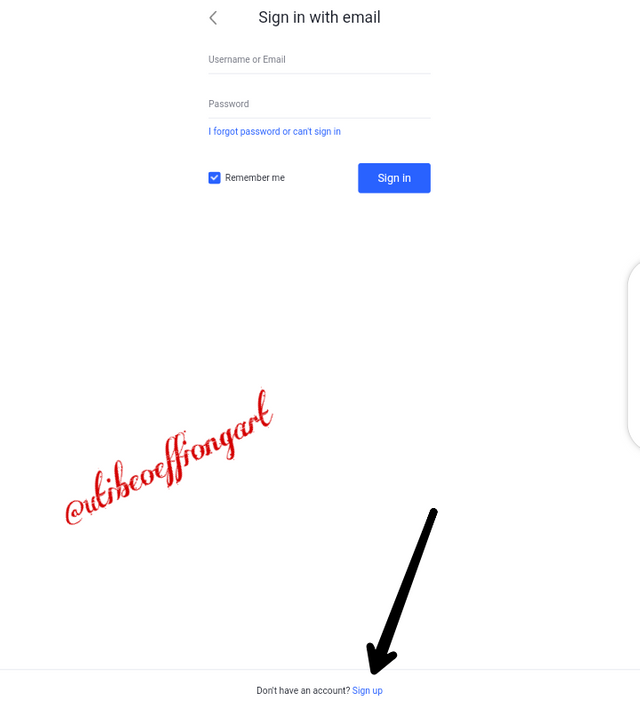
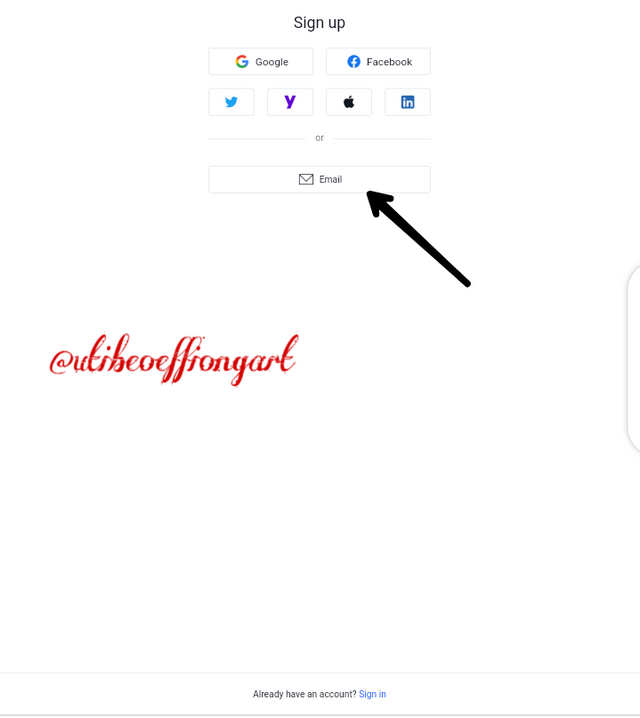
- Then click on sign up and Email as seen above and the page below will be up.
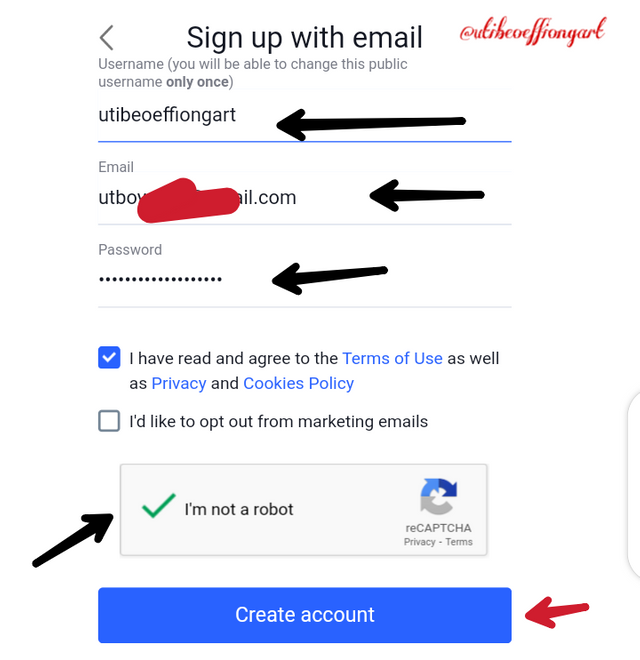
- Then fill in the spaces above and then click on create account.
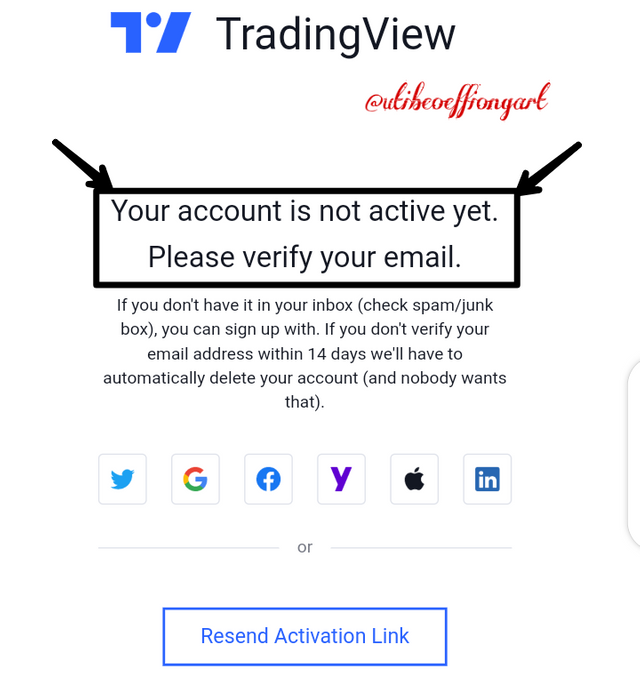
- When the page above comes up you go to your email to activate your account.
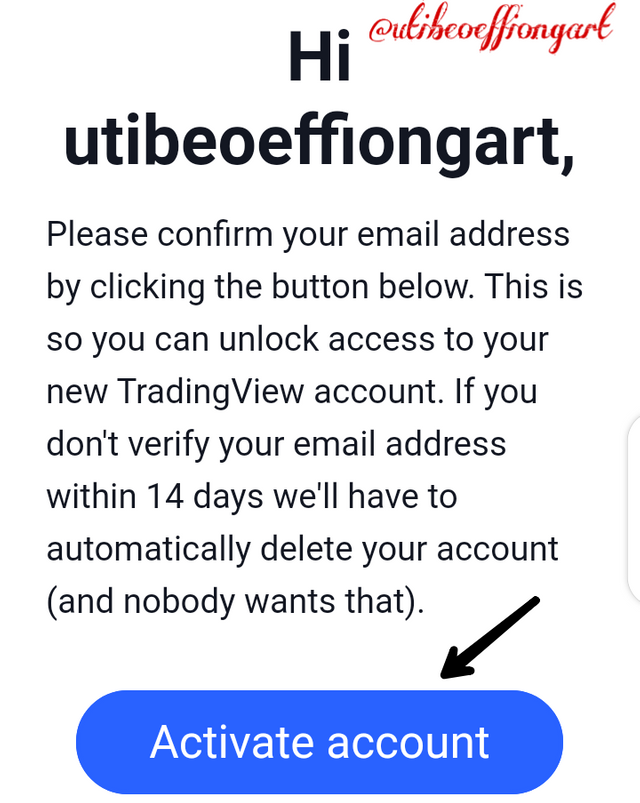
- Then click on activate account and the page below will come up.
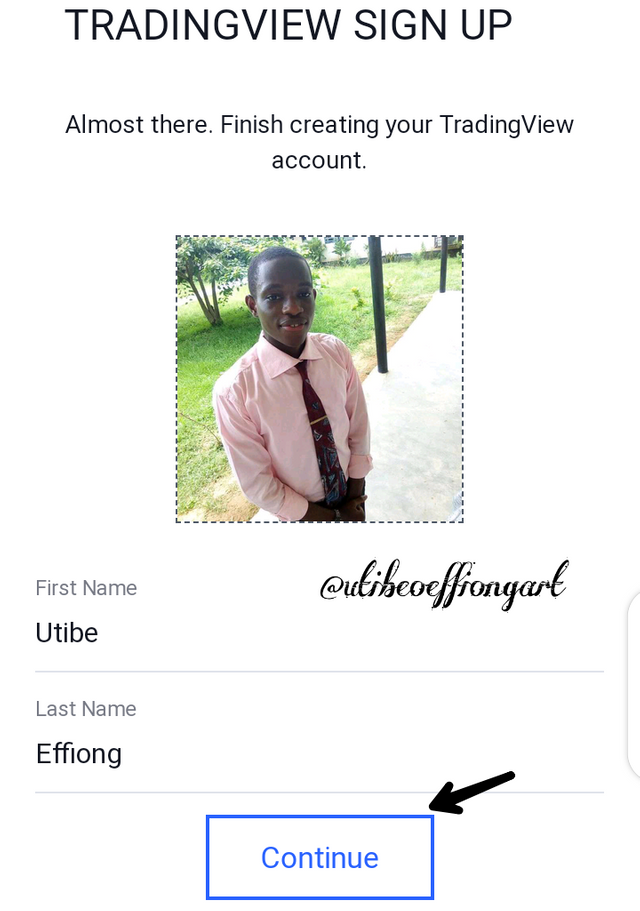
- At this point your account is almost ready, you just fill in your name and then input your picture and then click continue.
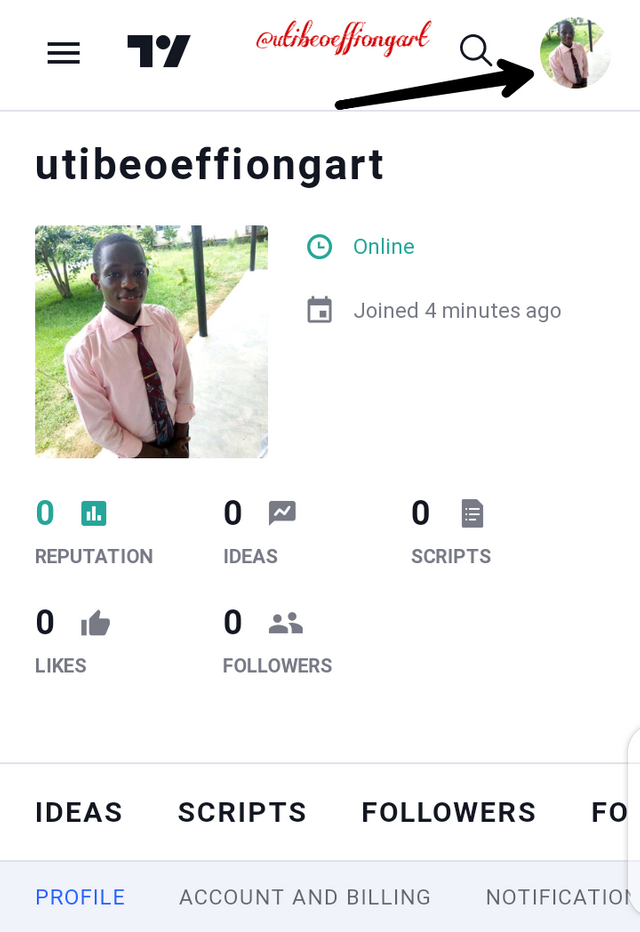
- By clicking the arrow above and then.yiu choose your profile, the profile will come up and your account is active and ready.
What are the different registration plan?
There are four Registration plans available on the TradingView she they will be explained below.
Free Basic Account Plan
The free basic Account is the first plan of the TradingView platform and as the name implies it is actually free for all users but limited in features. Unlike the other plans which we will see as we proceed, the free basic plan has some limitations as it limit the user from using some features. The most notable of them is that it allows users use just three indicators at a time.
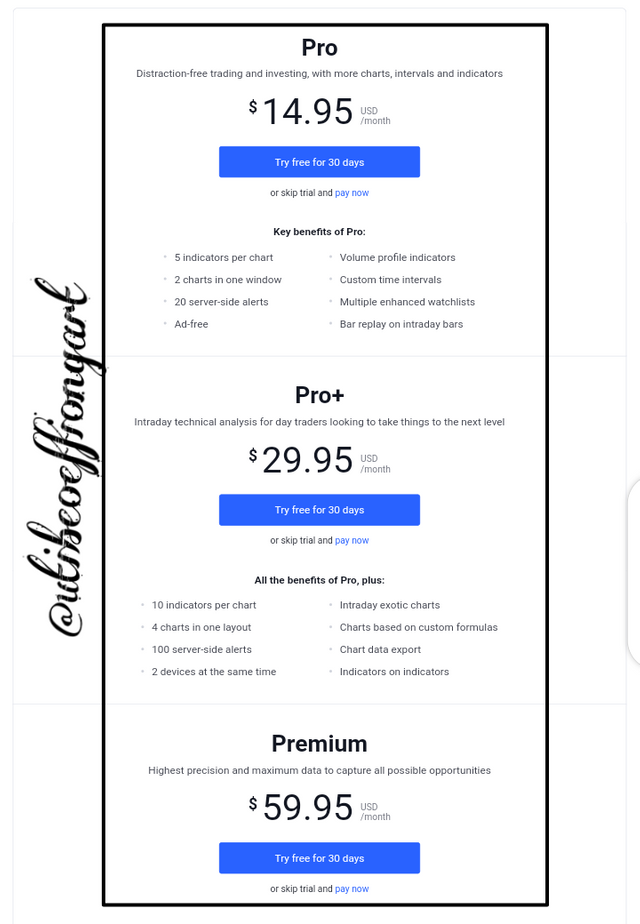
Pro Account plan
The pro account is an advance of the free basic Account in that some of the features not available in the free basic Account are available here. The pro account as against the free basic Account charges a sum of $14.95 per month that is for a period of 30 days. The special features of the pro account plan include but not limited to;
- 5 indicators can be added to the chart
- 2 charts can be added in a window
- No ads disturbance as always experienced with the free basics
- 20 server-side alerts,
- volume profile list
- multiple enhanced watchlists etc.
Pro+ account plan
This is an advance of the free basic and the pro account plan, in that it has better features than them. The Pro+ account plan charges the user a sum of $29.95 per month, that is for a period of 30 days. The special features of the Pro+ account plan include;
- Up to 10 indicators can be added on a chart
- 4 charts can be added in one layout to keep a track of different trades
- 100 server-side alerts
- Traders can use 2 devices at a time etc.
Premium account plan
This is the highest and last plan of the TradingView and it has more benefits than the other plans. The Premium account plan charges the users a sum of $59.95. The benefit it the Premium account plan include;
- Up to 25 indicators can be added per chart
- 8 charts can be used in a single layout
*:400 server-side alerts - A user can use 5 devices at a time
- Up to 20,000 bars of data on the charts etc.
Explain the different features of tradingView and what is your favorite feature and why?(screenshot necessary)
Features of tradingView
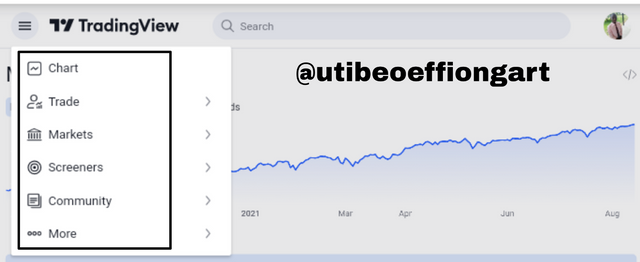
The major features of the TradingView are the Chart, trade, Market, screeners, community and more as seen on the picture above. They also have sub feature under this major features which I will discuss some of the as I pick the major features.
Chart
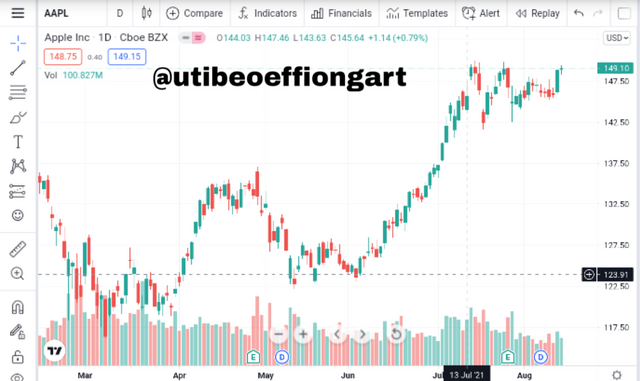
This is one of the major features of the TradingView which displays the market price flow in the form of candle stick, bars or lines movement. The chart of the trading is very important in that it helps a trader carry out the Technical analysis of an asset pair in order to carry out a trading decisions.
This trading decisions range from setting of stop loss setting, entry age exit from a trade set up and the take Profit setup. The support and resistant levels of a chart gives the trader a great decision making opportunity, that is were to buy or sell. As seen on the chart above the support level is the lowest point before a trade reversal for an upward movement and the resistance is the crest point before a downward movement.
Trade
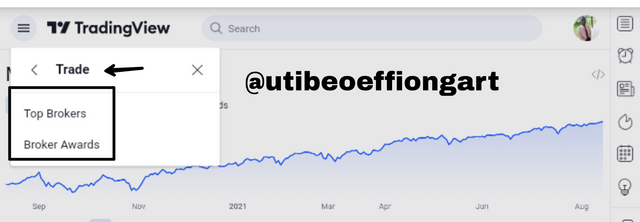
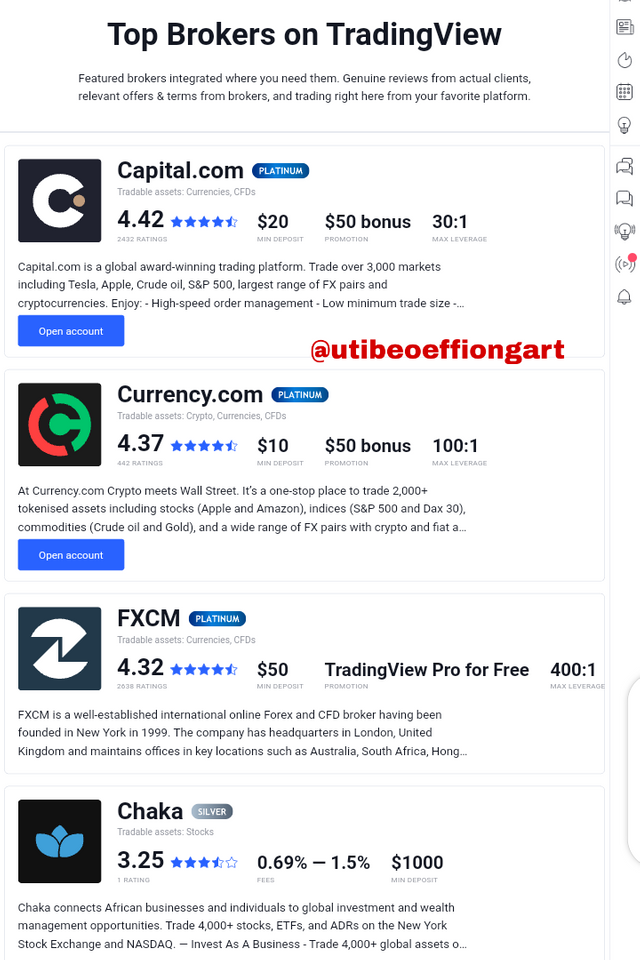
After carry a out a successful Technical analysis on chart a trader can go ahead to place trading orders on the TradingView platform via the trading section if the site. The trade section has some sub-features which includes top brokers and brokers-award. The top broker sub-feature seen on the top right corner above shows the trader the top brokers of the TradingView in case of trader want to carry out trade he/she will know the broker to make Transactions with.
Market
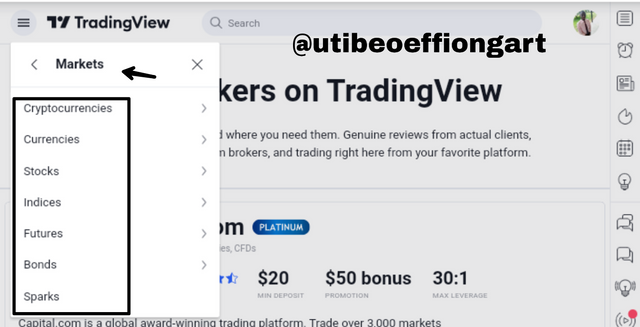
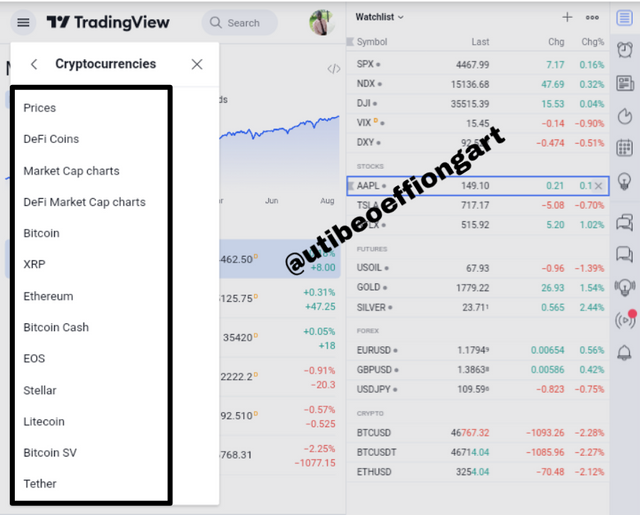
The market session categorizes the asset on the TradingView platform based on the following sub-feature so as to make for easy tracing and identification by a trader. This sub-feature include; Cryptocurrencies, Currencies, Stocks, Indices, Futures, Bonds, and Sparks. I decided to choose the Cryptocurency for us to see the sub-categories it carries and they are shown in the picture above.
Screener

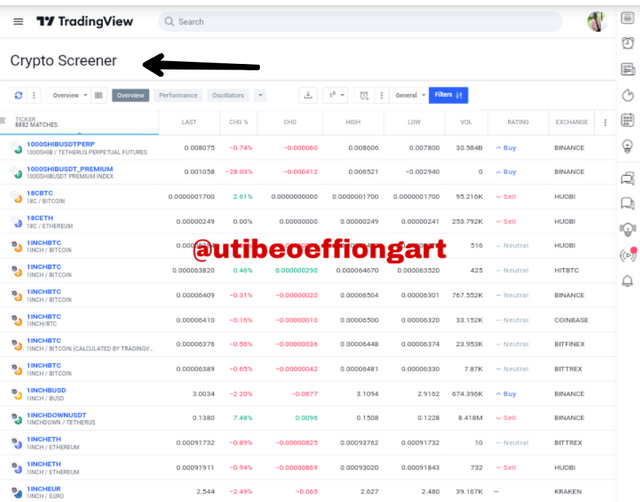
The screener is a major feature of the TradingView tht allows traders screen asset in order to make thier choices. The screen section has a sub feature of Stock screener, Forex screener, and Crypto screener.
Looking at the picture afore, at the top right corner, it shows a screener page, that of the Cryptocurency, I choosed the Cryptocurency since we dealing on that. The page has four categories that help traders screen asset. This are; Overview, Performance, Oscillators and Trend-following.
Community
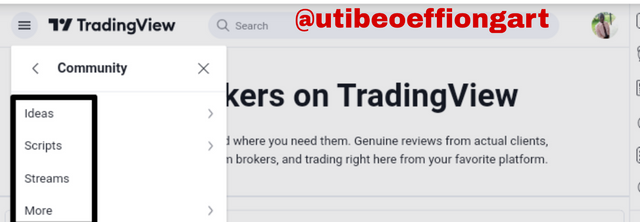
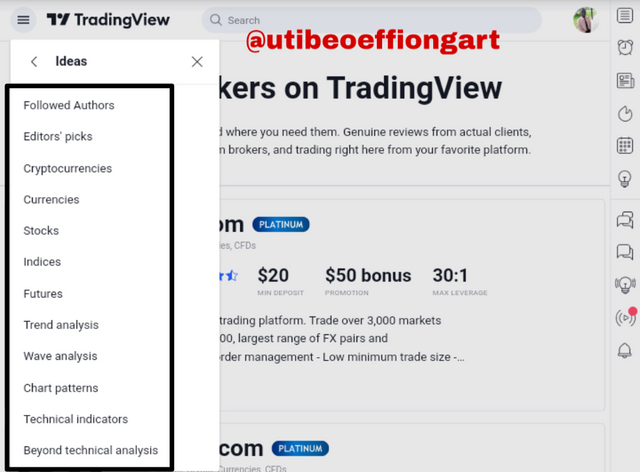
Now this is another very important feature of ye TradingView platform were traders can get information on the happens about a particular asset. You can see from the picture above, the first sub feature is the idea and I choose that, so we have seen the run down were traders can have ample information about an assets fundamentals.
Watchlist
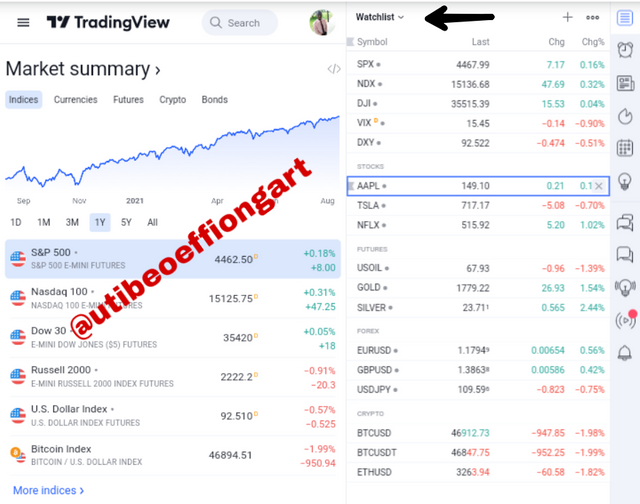
As the name implies watchlist, this mean list of asset being monitored by a trader. A trader with certain portfolios might find it difficult to search for them one after the other, so the watchlist takes away this stress by providing a section for the trader to save and watch the occurrence of the different asset of his/her choice at choice times.
what is your favorite feature and why?
My best feature is the Chart.
This is because of the enablement the chart empowers the trader with. A good trader can from the Technical analysis of a chart successfully very out a trade without needing other features for fundamental analysis.
Looking at the chart above, I showed a place for indicators, were a trader can make a choice of his/her indicator based on the understanding he/she has gathered for a successful usage of such. And with this powerful tool(the indicator), a trader is sure to make great profit from a trade.
How to set up a chart in TradingView and use two tools to edit it.(screenshot necessary)
How to set up a chart in TradingView
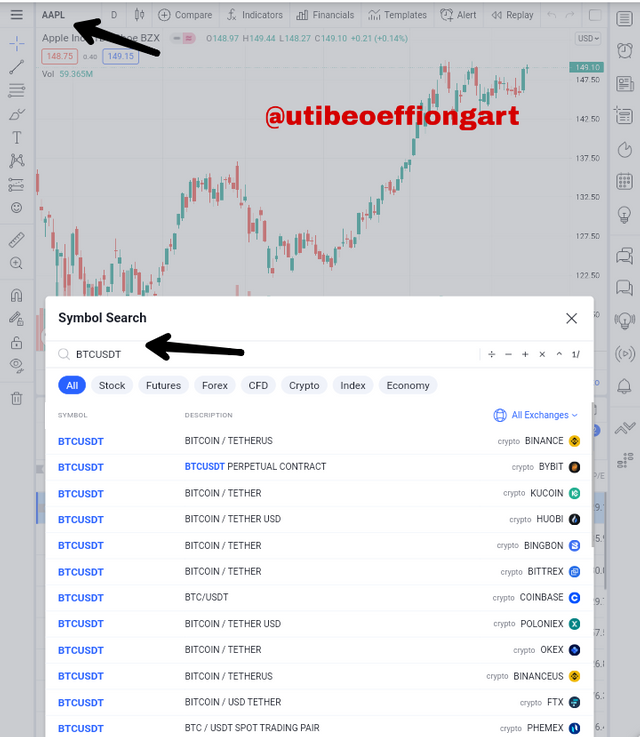
- First of all I'll log into the TradingView platform and go straight to the chart section.
- Now after I have open the chart the asset pair might not be of my choice so I edit that to what I want.
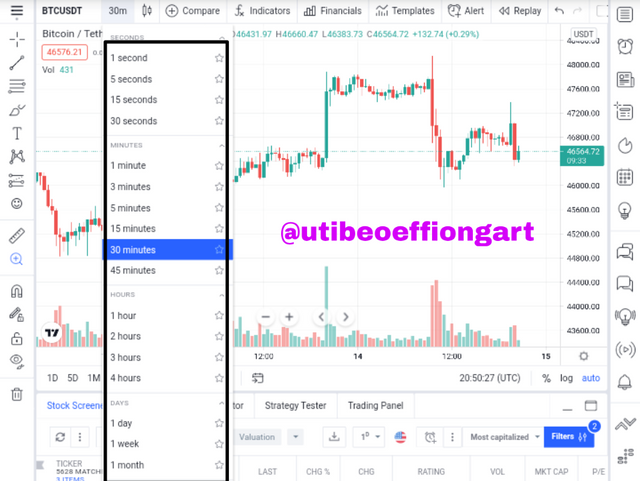
- After that I move to the time frame, the diet default time frame Dropped it on the 1 day time frame so I edit it to the 30min. time frame as seen below.
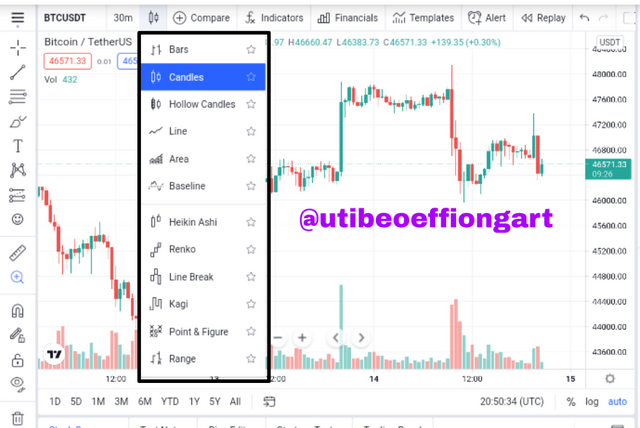
- Now after that I move to the nature of my stick. And here I choose the candle stick, as it was the default already so I allowed it.
- Now after that I move to the setting proper, after clicking on the setting symbol on the top of the chart bar. The following are the features on the setting part of the chart.
Symbol
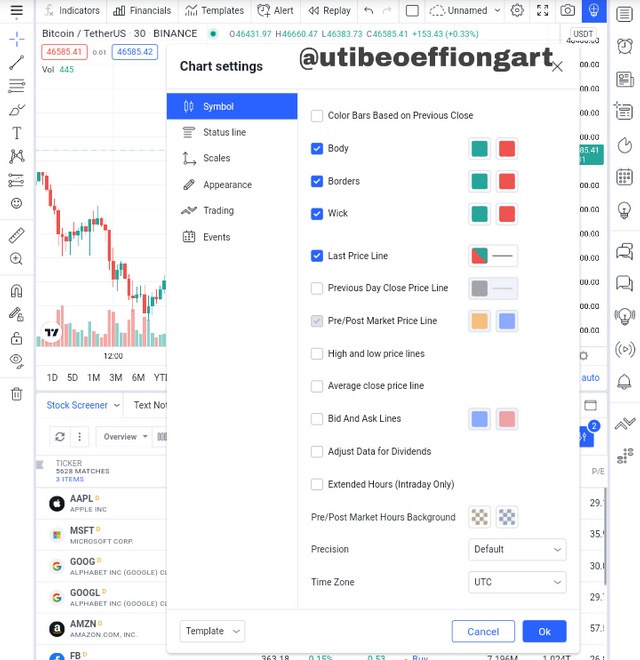
The symbol section of the setting button shows basically the settings for the symbols on the chart, like the color of the candle stick, borders and wick. And lots of other symbol like settings as seen in he chart above. Alot of times trades don't edit the other symbols apart from the first three. Though the settings depends on traders preference.
Status line
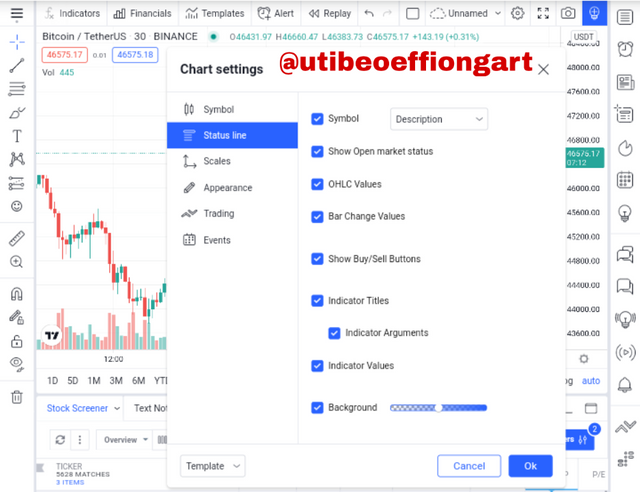
The status line section helps the trader with setting such as Open market status, OHLC values, Bar changes values, Show buy/sell buttons, and so on. The trader can choose to hide/show them by simply choosing that option and there after safe the setting.
Scale
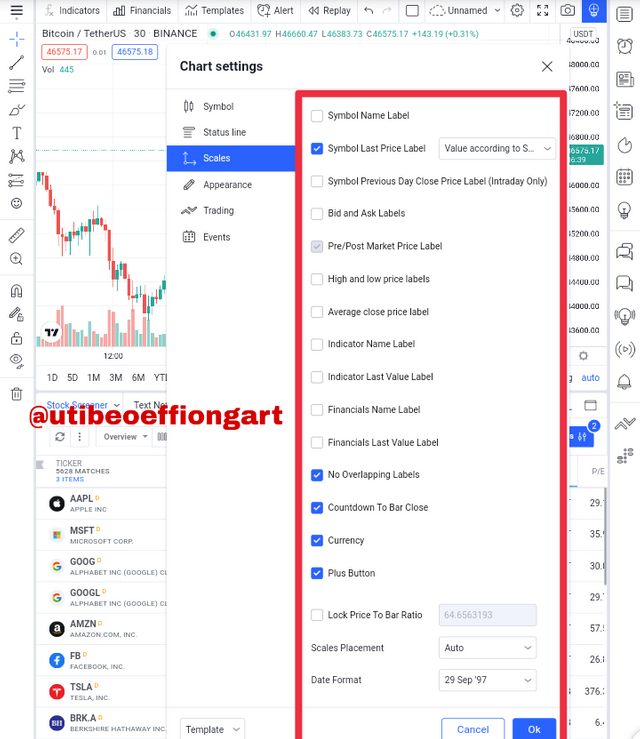
With the scale section the trader is accorded the opportunity to set for the Symbol last price label, bid and ask labels, high and low price labels etc.
Appearance
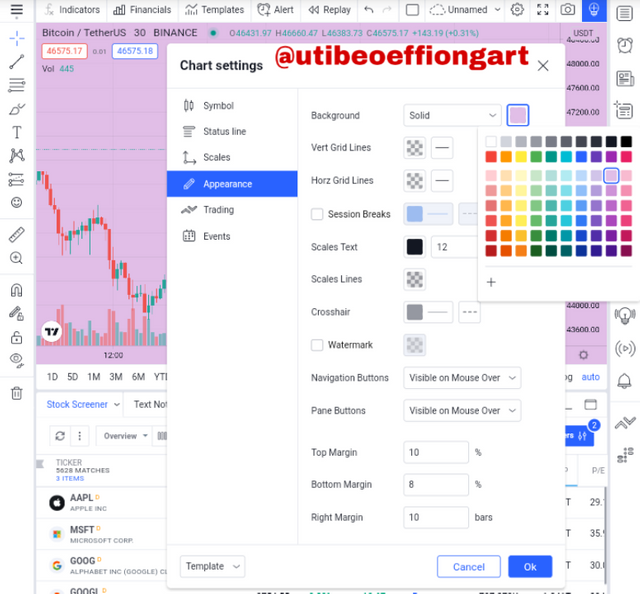
The appearance part of the setting is an interesting part as it has some beautiful effect on the chart body it self like we have seen above, the color change from white to it Current color. There are other features of the appearance section the trader can take advantage of has he/she deems fit.
Trade
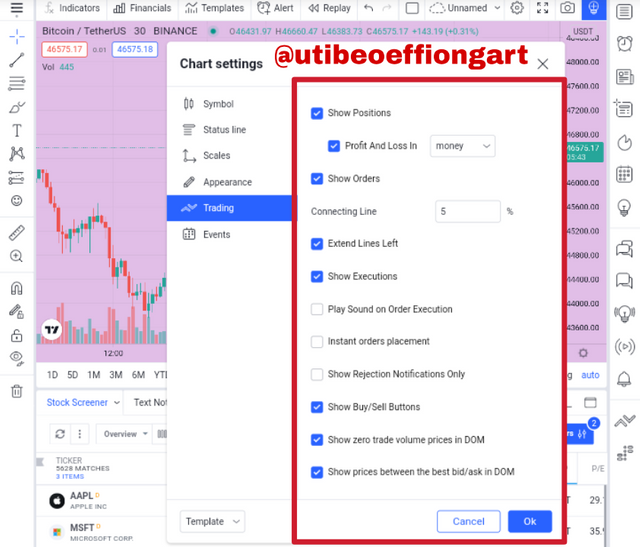
The trade section has settings such as Positions, show orders, extend lines left etc. This is done like I said before based on the users preference.
Use two tools to edit it.
Using two tools to edit our setting. I'll be working with the **Trade line and the long position tools **.
Trade line Tool
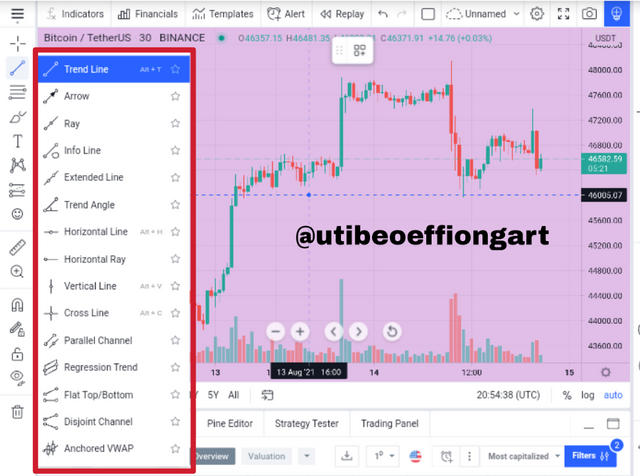
On the left side of the chart are the tool at the traders disposal to edit the chart has to profit him/her. So looking at the trade line tool as seen above. I'll choose the trade line itself as the result on the chart is as shown below.
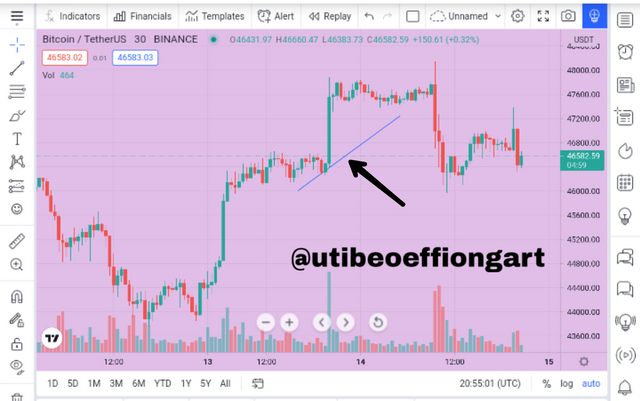
The chart above shows the trade line used in it.
Long Position Tool
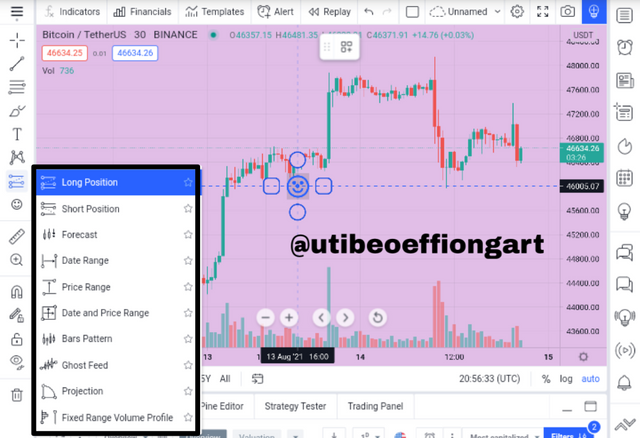
The long position tool helps traders mark out thier take profit and stop-loss positions as shown below.
The long position shown on the chart is on a 1:1 risk point for this trader, at this point, if the trade has gone his Direction, boom, he will make his profit, but will loss out it the trade crosses the already set stop loss so the trade has to be exited and reentered at a convenient position.
Explain how to add indicator in chart, what is your your favorite indicator and why? (screenshot necessary)
Adding Indicators in a chart
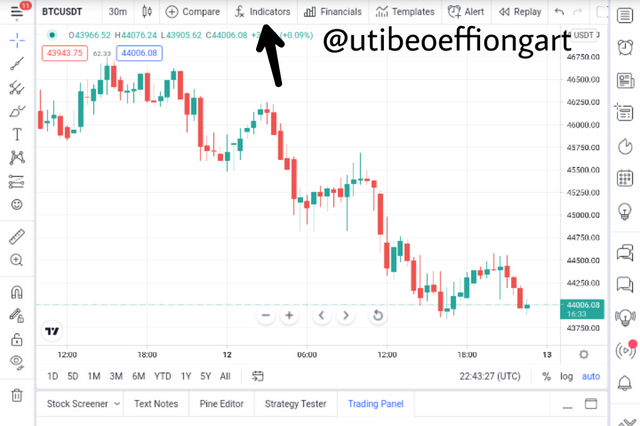
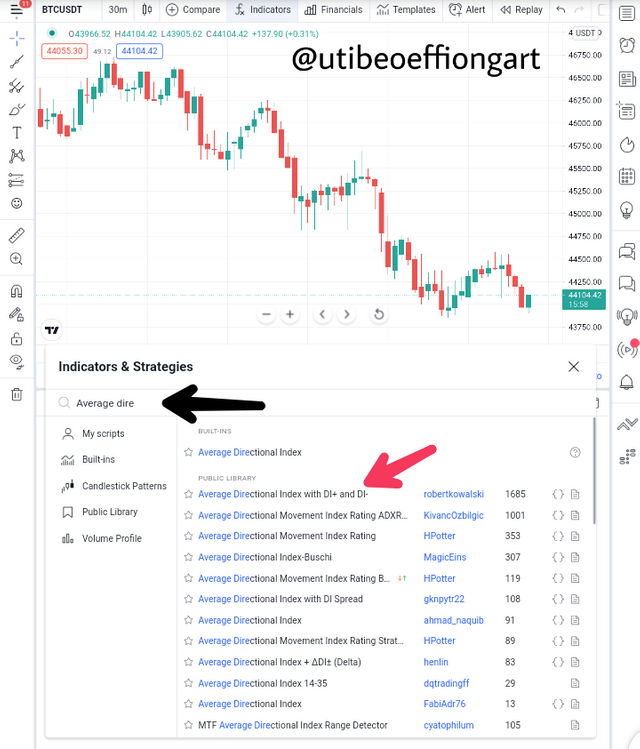
- After hitting the chart section in the TradingView platform, choose the Indicator button as seen below.
- After that choose the Indicator if your choice, here I choosed the Average directional Index ADX with it accompanying +DI and -DI Indicator lines following suit making the lines three.
- By clicking on the Choice Indicator it automatically applies on the chart as seen below.
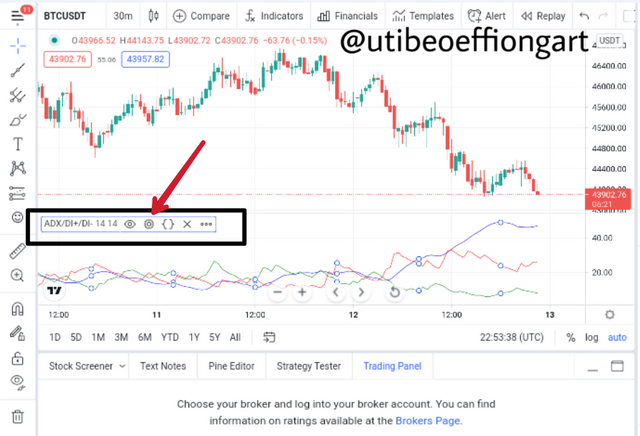
- Next is to set the Indicator by clicking on the setting button as seen above. Ave the call out page will come up as shown below.
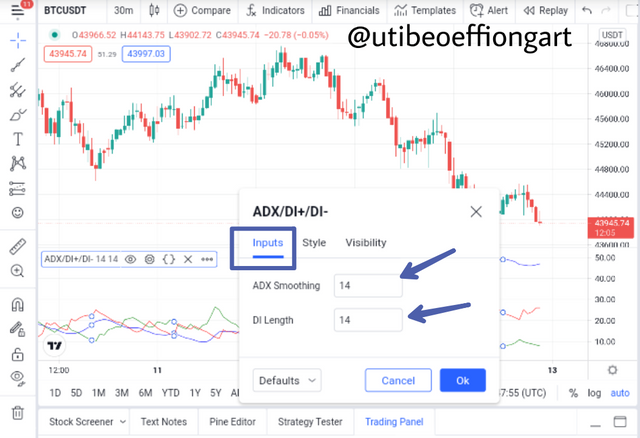
- First Setting is the input, this has to do with the length or period of the ADX line.
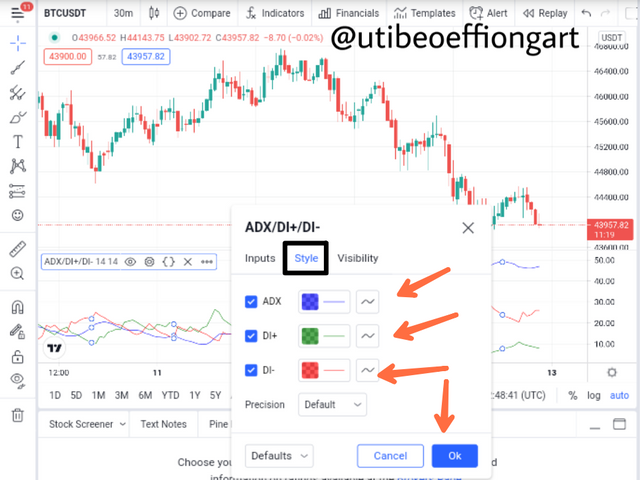
- Next has to do with the style of the Indicator, this is always based on what color the trader is convenient with abd can easily identify.
What is your your favorite indicator and why?
As we know that no one Indicator is 100 percent in it operation, so there is always a need for it to be combined with other Indicators in other to filter out errors and false signals.
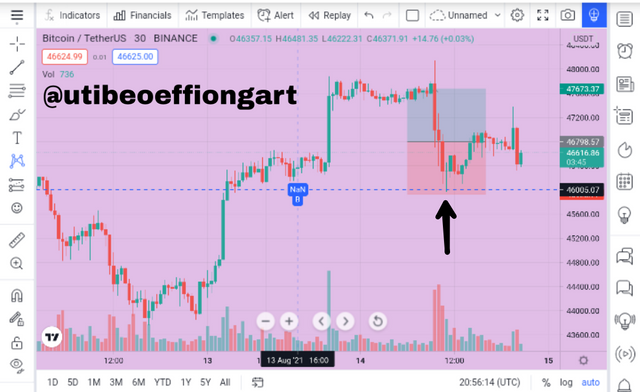
To that end my best Indicator is the ADX Indicator in combination with the RSI Indicator as seen below.
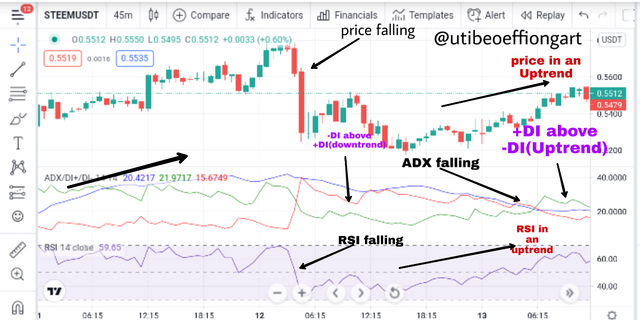
Looking at the chart above I have taken a little time to explain with symbols in the chart the combining Importance of the two Indicators.
Now why I like them is first fur the ADX Indicator, it shows the strength of trend of the Indicator wee a trader can know an impending reversal in trend. Then the ADX in combination with the +DI and -ID it will give the chart a direction as the ADX on it own doesn't give trend direction but just the strength of the trend.
The RSI indicator then compliments the work of the ADX as it helps filter false signal made by the chart or ADX Indicator.
Do you think TradingView is useful in predicting the market for cryptocurrency (trend / price)?
Yes the TradingView is very useful for the prediction of the market for Cryptocurency.
This is so because the TradingView platform carries out a fundamental and technical analysis.
Fundamental analysis
For the fundamentals analysis, the Community feature of the platform gives trader a great id a of what now happening in the market, the report of people, the news from fellow traders Investors has alot of impact on the market of the market prediction of any crypto asset because to a great extent the news make on an asset my a whales trader has alot of effect on the relative outcome of that asset in a short While.
Technical Analysis
Now this is another very powerful analytical strategy afforded a trader to successfully predict the crypto market. The various analytical tools available on the chart is a great make do for a good prediction. Also a good Analysis of the resistance and support levels in that tradeview chart is another good market prediction strategy.
On the whole the TradingView platform is a great platform to carry out market price prediction both fundamentally and Technically, which are the basic analytical and prediction methods.
Conclusion
In conclusion, the TradingView is more like a whole package in one. Where traders can socially engage, trade, analyse and make great gains from thier positive use if the platform.
It is more like Cryptocurency Trading made easy or simplified.
Thank you
Respected first thank you very much for taking interest in SteemitCryptoAcademy
Season 3 | intermediate course class week 7
thank you very much for taking interest in this class
Thank you prof. @yousafharoonkhan