Crypto Academy Week 15 - Homework Post for Professor @stream4u - Technical Indicator: Pivot Points.
Thank you very much Prof. @stream4u for this wonderful lectures. I have learnt a new technical analytical method.
Now to the lectures proper.

QUESTION 1
Discussed your understanding of Pivot Points. (Title For this topic will be Pivot Points)
MY ANSWER
Pivot Point
The pivot point is a technical analysis Indicator used by traders to determine the current trend of the Market. The pivot point seeks to help the trader make correct market trend prediction.
With pivot point the trader carefully studies the previous high point, low point and close levels in order to detect the current market points.
Therefore the Pivot Point is a technical indicator used by traders where he/she analysis the previous Resistance level, Support level and the close levels of the market price in order to take decision on the current market trend based on the previous study.
QUESTION 2
Details about Pivot Point Levels
MY ANSWER
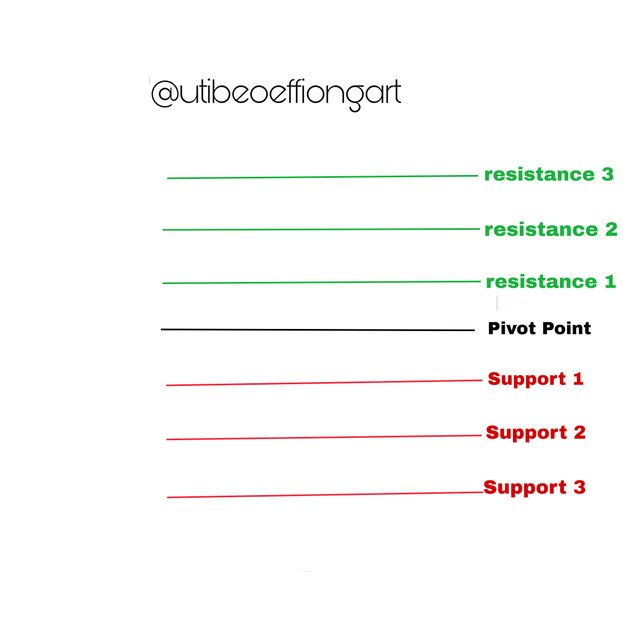
Pivot levels
The above are the pivot levels of the Pivot Points. The pivot levels is very important in the analysis of the market trend using the pivot point indicator.
Explanation of the Different Pivot Points
Main Pivot Points Level (PP) : This is the main level of the pivot point usually in the middle of the trend in the chart. The levels above the main Pivot Points is considered the bullish trend (resistance) and the level below the main Pivot Points is considered the bearish trend (support).
Support 1 (S1): The is the first point below the pivot point (PP). When the market price hit here it begins to move up trend. At this level the trader might decide to buy. But if there is a market breakout, it continues on the bear trend.
Support 2 (S2): This is the second point below the pivot point. When the market price hits here it begins on the uptrend. At this level the trader might decide to buy. But if there is a market breakout it continues on the bear trend.
Support 3 (S3): This is the third point below the Pivot Points. When the market price hits here, it begins on the uptrend. At this level the trader might decide to buy. But if there is a market breakout it continues on the bear trend .
Resistance 1 (R1): This is the first point above the PP. When the price hits here, it begins on the downtrend. At this level the trader might decide to sell. But if there is a market breakout then it continues on the bull trend.
Resistance 2 (R2): This is the second point above the PP. When the price hits here, it begins on the downtrend. At this level the trader might decide to sell. But if there is a market breakout then it continues on the bull trend.
Resistance 3 (R3): This is the third point above the PP. When the price hits here, it begins on the downtrend. At this level the trader might decide to sell. But if there is a market breakout then it continues on the bull trend.
The resistance and the support level is very significant in the market trend analysis, like wise the Pivot point. At this point the trader can decide to sell(resistance) or buy(support). The market begins on a reverse at this two points. Except there is a break then it continues on a bull or bear depending on the current level.
QUESTION 3
Pivot Point Calculation and R1 R2 S1 S2 Pivot Levels Calculation.
MY ANSWER
Pivot Points Calculation
Like I said before, that the Pivot Point can be determined using the previous levels of high(resistance), low(support) and close points. So to calculate the Pivot Points of the current market price then you have to determine that of the previous day.
Therefore calculating the pivot point;
PP = [High + Low + Close]/ 3
Where;
PP is the Main Pivot Point
High is the highest price of the previous day
Low is the lowest of the previous day
Close is the closing price of the previous day.
R1, R2, S1, S2 Pivot Points Calculation
S1 = 2 × PP - High
S2 = PP - (High -Low)
R1 = 2 × PP - Low
R2 = PP+ (High - Low)
Notice that to calculate the different pivot levels, the Pivot Points has to be calculated first for this to be possible.
QUESTION 4
How to Apply Pivot Point on Chart. (Screenshot with tag your name)
MY ANSWER
Below is the step by step procedure on how to apply the Pivot Point.
first of all I logged unto the https://coinmarketcap.com/ and then proceeded to choose a crypto asset pair of my choice which I decided to choose the BTCUSDT pair.
Click on the trade view and the chart below will open.
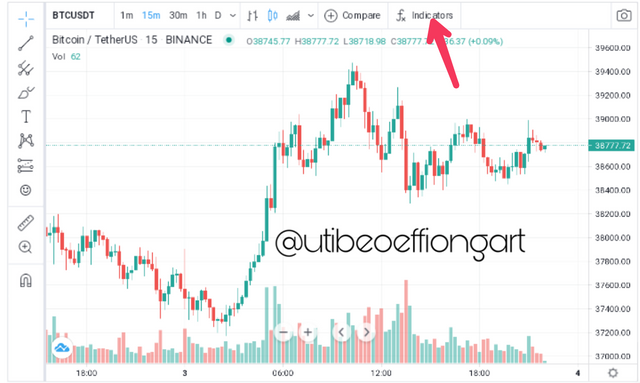
- Immediately the chart comes up, click on the indicator as pointed on the arrow above, then the page below comes up.
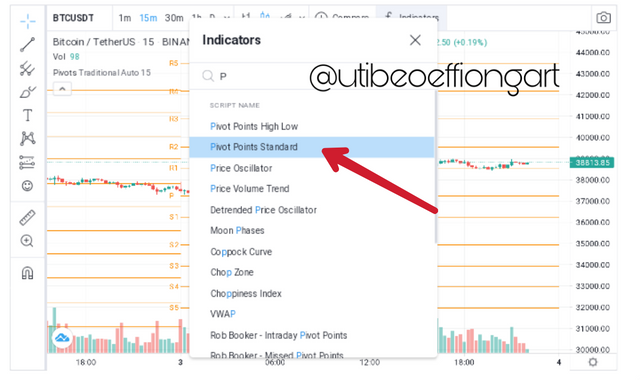
- Immediately that comes up, you type the Pivot Point, and immediately the pivot point will come up.. but notice that there are other pivot point indicators but we will concentrate on the standard Pivot Point.
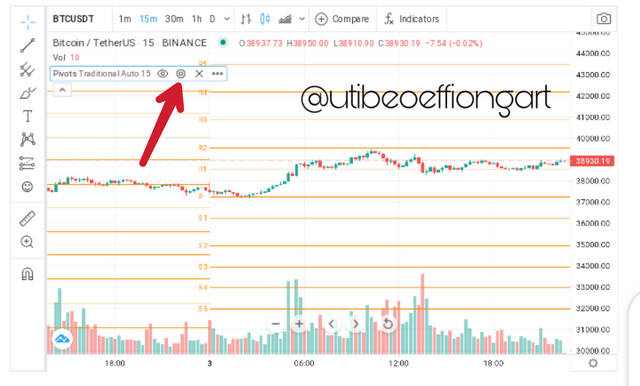
- The unedited Pivot Chart comes up.. looking at the chart, lines identification is difficult so we have to edit it for easy identification. So you click on the setting which the arrow is pointed to afore..
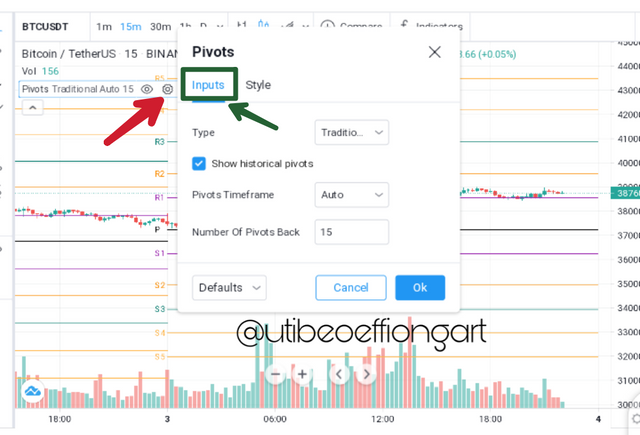
- The editing page comes up.. you then click on the input and try to edit it.. but looking at this input page it is set to a default which we are going to allow but some traders can decide to set it to their choice and test.
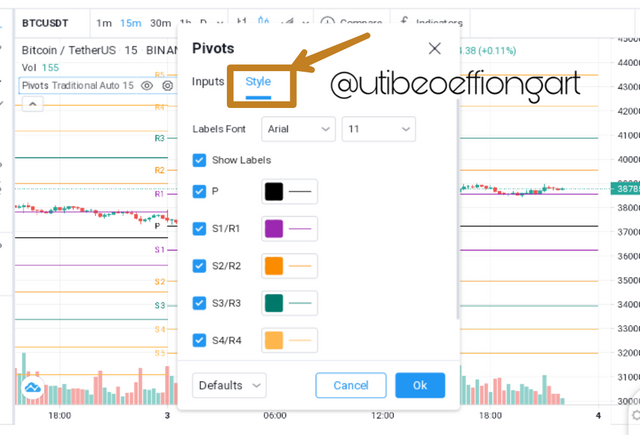
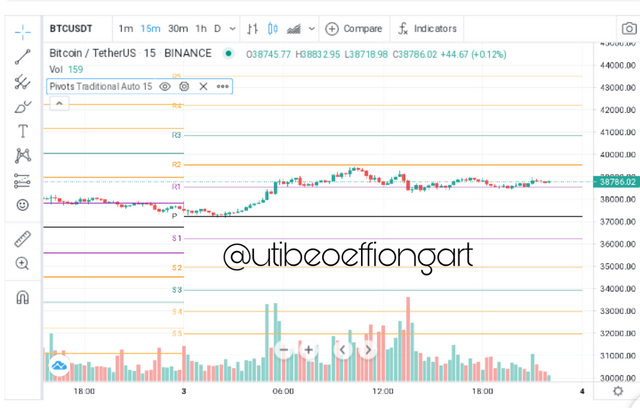
- when you are done with input you then click on the styling. Here all the colors are the same at first till you edit it. So we will change it to choice colors as seen above. And boom our pivot point indicator is ready for analytical use as seen below.
QUESTION 5
How Pivot Points Work. (Screenshot with tag your name)
MY ANSWER
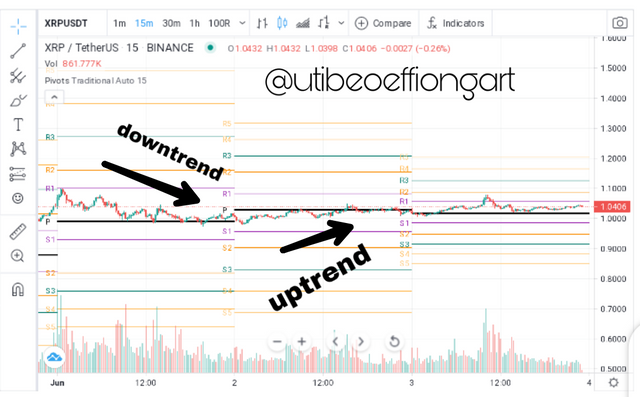
Below is the analysis of how pivot point works. Like I had stated below that the pivot point helps in the analysis of the market trend. Where the trend above the pivot point is the Bullish trend and that below is the bearish. Below is a 15minute chart showing a XRPUSDT pair analysis using the pivot point.
Below is a further explanation of the working of the pivot point above and below it.
Above the Pivot Point
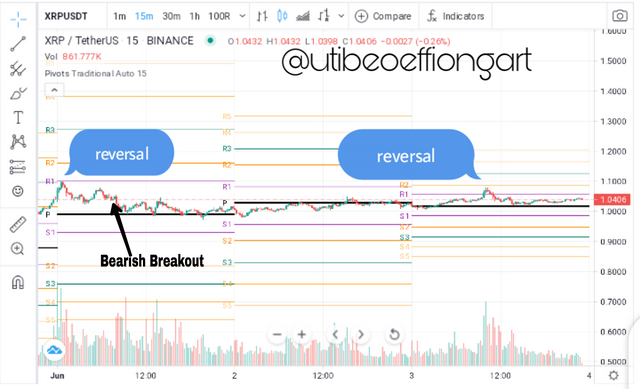
Like it is established that the sticks above the PP is the resistance. Therefore from the chart above we can see the sticks above the dark lines, those are the sticks representing the bull trend. So I carefully pointed out the reversal point. Now those are the point were the market price starts to take a u-turn. At that point it best to sell your XRP for your USDT.
Similarly I also pointed out the breakout point were it kept the bull trend instead of taking the normal u-turn.
Below the Pivot Point
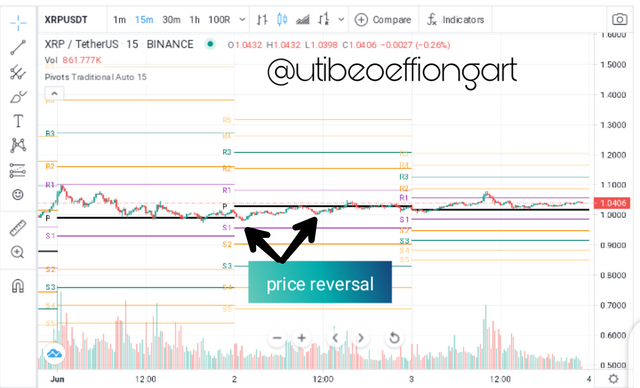
Also established that the trend below the PP is the Support. Looking at the chart above I carefully pointed out the candle sticks that showed this behavior. At that point it is best to buy because there has been an oversold(support level).
QUESTION 6
Pivot Point Reverse Trading. (Screenshot with tag your name)
MY ANSWER
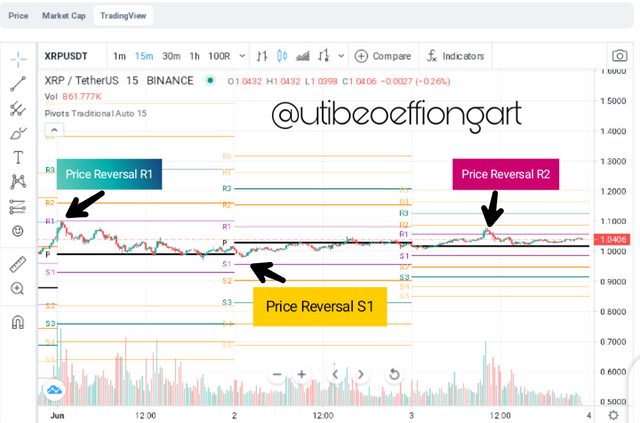
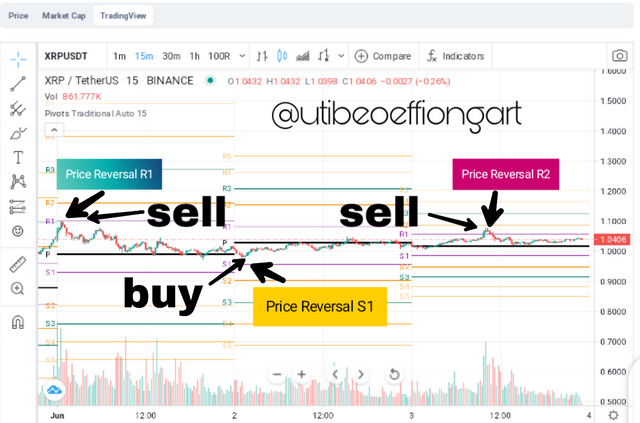
First of all we have to understand that reversal is the point were a trend or a candle stick takes a u-turn from the former direction. Two things are usually associated with those turns.. and these are the Resistance and support.
Now considering the afore chart. Now the market opened with out chart billing up till R1 and then took a a turn. Notice that the chart at that day one is above the PP and that signifies a bull at that Point a trader can decide to sell but the what if the market experiences a breakout and continues to bull, then the stop-loss will be very handy to prevent the trader to lossing out on profit.
Now the trade continued on a bear trend untill S1 of the second day. It is considered S1 here because it is below the PP. And just before the market hits the S1 a quick reverse and begins a bull. Notice that in the two of trading there has been no breakout at the critical decision Points. At this point a trader can decide to buy.
From there the market continue to experience a almost straight line chart running along the Pivot point. Till it hit a R2, though not at the former market price high, but then a resistant set in and the Price begins to bear.
It is worthy of not that since our reversal strategy might not hold true always, based on predicting, so it necessary to set stop loss and other trade instrument in other avoid trade errors.
QUESTION 7
What could be a common Mistakes in Trading with Pivot Points
**MY ANSWER.
Wrong Support and Resistance
After a trader has done his/her prediction there should be an understanding that the market might go against the direction he or she predicted. There might be a breakout there by overturning the already entered trade. So the trader must be wise enough to set a stop loss in order to avert this kind of situation.
Following the Pivot line without corresponding price action.
Some novice traders utilize the pivot points just because they are told to. Just because there are pivot lines above and below the PP, that does not mean you should trade with them. There must be a candle stick contact or near contact on them for you to use them for market price interpretation
No entry and exit point.
Some traders Open positions on a trade without a clear cut plan. That is because he/she feels that the PP should give a complete guide or market price interpretation, in as much as that might be so. But then there cases were it can go otherwise. For this reason a trader has to map out a trading plan were there is going to be a profit taking point, and exit from the trade. With this in place a trader can easily set a stop loss so to avert any downturn of the market.
Not having a full understanding of the market trend before using them.
Some traders don't understand the importance of the resistance and the support levels in a trade before proceeding to opening a position. And even go ahead to use the PP levels and this could be very disastrous for such a trader.
QUESTION 8
What could be the reasons For Pivot Points is Good.(Pros/Advantages)
MY ANSWER
The pivot point levels helps a trader to easily identification of the support and resistance levels of the previous day's.
Break out point can be easily identified by a trader using the levels of PP.
New traders can easily understand and use the indicator for trading.
Trading with the reversal strategy is made easily with the PP indicator.
QUESTION 9
Apply the Pivot Points indicator in the Today chart (the day when you making this task) and set the chart for 15 minutes. Explain the market trend till the time of writing the task and how it will be next till the end of the day. You can give possibilities on both the side bearish and bullish.
MY ANSWER
Using an XRPUSDT pair of 15minute timeframe for a three day period.
Day one
Trade opens with a price hike (bull) at R1 giving $1.100, at this point the price begins to move downwards towards the PP. But then there's a quick reversal and the price hikes again. At the R1 point, a trader can decide to make sells as indicated on the chart above. The price continues on a bear but above the PP levels which sends a message that the trade is still on the Resistance zone.
Day 2
Trade opens on the second day on the 2nd of June precisely as the stick moves down the PP level towards the S1 at $1.0000. Here a trader can decide to buy if he wants to. Though at this point it has not clearly touched the S1 but it's clear enough for a trader to take a buy decision. The price immediately moves on a bear trend still below the PP towards the third day.
Day 3
On the third day the price moves on the PP level. The trend experiences a market breakout some moments before mid day and continues on a bull across the R1 towards the R2. At mid point between R1 and R2 the price hits resistance and begin to bear, a good profit taking position for intraday traders. It continues on a almost linear trend till June 4 our current position at $1.0406.
Predicting for the next day. (5th of June)
Now considering the trend for the last three days. The market has experienced a bull, it's time for bear. The chart will move Below the PP level giving a support around mid day of $0.906. at this point it will be very good for the trader to buy. It will immediately move into a bull but still under the PP level, till the next day 6th of June were it will move above the PP level.
QUESTION 10
Weekly Price Forcast For Crypto Coin: XXXXX(Based on all previous lectures of technical studies Forcast the Weekly price for any Crypto coin, Title will be the same just replace XXXXX with the Coin name and covered all below points in it as a part of Price Prediction for the next 1 week.)
The basic information or your thoughts on the Crypto Coin that you would like to Predict its price for the next 1 week? (Title for this will be the same as above and cover answer for this under the same.)
Reason why you would like to predict the selected Coin? (Title for this will be Why XXXX?, replace XXXXX with the Coin name.)
Complete detail on it's one of the analyses of Technical/Fundamental/Sentimental with price details.
With the detail of anyone Technical/Fundamental/Sentimental study what will be the possible low level and the high level for the next 1 week?
MY ANSWER
Weekly Price Forcast For Crypto Coin
For this section of the question I'll be analysing or forecasting the price of Dogecoin. Using the DOGEUSDT pairs.
The basic information or your thoughts on the Crypto Coin that you would like to Predict its price for the next 1 week? (Title for this will be the same as above and cover answer for this under the same.)
Dogecoin is a very promising coin owing to the recent price hike it's been enjoying in recent times. It was created by two software engineers
Billy Markus and Jackson Palmer in the year 2013. The dogecoin is a blockchain coin known particularly as the meme coin. It's logo is gotten from the face of the Shiba Inu dog. It is ranked 6th on the market cap. And has a volume production of 6billion in the last 24hours. It has a circulating supply of 129.5 billion. With a market dominance of 2.98%.
Reason why you would like to predict the selected Coin? (Title for this will be Why XXXX?, replace XXXXX with the Coin name.)
I'll like to predict the DOGECOIN because of the following reasons:-
Transaction can take place on Rabbit and Twitter easily.
It operates on the Ethereum blockchain with the help of the Decentralized finance Difi. Which enables it become compatible with contract.
The current investor which has a very important fundamental analysis control on the coin.(Elon musk).
It's significant upsurge of price in recent times.
Complete detail on it's one of the analyses of Technical/Fundamental/Sentimental with price details.
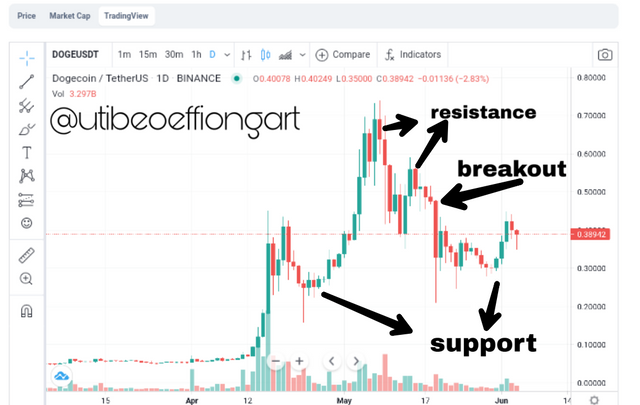
I choose to take on the technical Analysis, owing to the fact that we can easily carry out a price forecast with this analytical method. I'll be analysing using the resistance and support levels, which is a good representative of the bull and bear trend. We will be looking at the high Volatility of this coin pair, employment of the reversal strategy from our last lectures will not work here because there is no prolonged bullish or bearish trend.
Looking at the chart below it shows a high level of volatility and there is no hold down on any high or low points. It's breaks out of resistance as fast as it gets in. So an intraday profit taking will be good for this trade.
Currently at the point where the price is, it is advisable to hold position, because what happened just before the 17th of May will just showcase it self again.
Resistance point is the point were a chart or price goes to before it starts moving back to on s bear trend. And
Support point is the level were it gets to before it moves on a bull pull.
Breakout is a point were the chart continues on a bearish or bullish trend after it has hit the support or resistance respectively.
An understanding of this three terminologies will really help a trader to understand the principle of stop loss setting which is very important for technical analysis in order to achieve good profit taking in a highly volatile market like this.
High Volatility means market trend that changes direction almost immediately as it gets in to that position.
With the detail of anyone Technical/Fundamental/Sentimental study what will be the possible low level and the high level for the next 1 week?
In view of the afore chart, immediately the market hit May it began on an uptrend till 0.7usdt point from the support level of 0.2usdt. And at the 0.7usdt it broke out almost immediately for a bear. This is to tell the trader of how highly volatile the market is.
Now there is one thing the trader should take cognizance of here. That on the 17th of May and the current price position the market has the same price which is 0.389usdt. so at this point it's advisable the trader hold because the market is about to repeat the former process that occurred on the 17th of May.
Now predicting the price for a week based on this characteristics, the price will bear to 0.360usdt support level at the beginning of the week and begin to bull to a point of
0.400usdt towards the end of the week.
Conclusion
The knowledge of Pivot Point is very salient in the prediction of the current market price. A careful study of the previous highs, lows and close levels will give a good overview of the market trend. Therefore giving the trader the proper knowledge to take decision and predict the current market trend/price.
Thank you
Hi @utibeoeffiongart
Thank you for joining The Steemit Crypto Academy Courses and participated in the Homework Task.
Your Homework Task verification has been done by @Stream4u, hope you have enjoyed and learned something new.
Thank You.
@stream4u
Crypto Professors : Steemit Crypto Academy
#affable
Thank you very much Prof.
Vote me