Steemit Crypto Academy Season 4 Beginner's Course - Task 10: Candlestick Patterns.

Good day everyone, how are you all doing. I welcome you all to my Season 4 Homework task - 10 which talks about the Japanese Candlestick Chart, thanks to prof @reminiscence01 for his superb explanation on the course, I will be answering question 1 among the homework that we're given by the teacher.
1a) Explain the Japanese candlestick chart? (Original screenshot required).
b) In your own words, explain why the Japanese Candlestick chart is the most used in the financial market.
c) Describe a bullish and a bearish candle. Also, explain its anatomy. (Original screenshot required)

Explain the Japanese candlestick chart? (Original screenshot required)
To explain the Japanese candlestick chart better, we have to go back to the history of the Japanese candlestick.
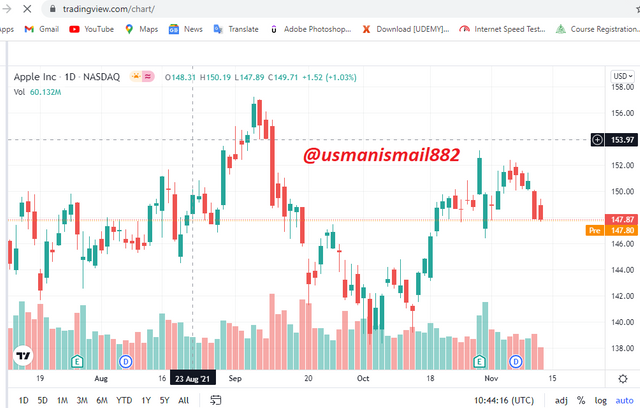
image source
History of Japanese candlestick
To talk about the history of the Japanese candlestick, then we have to talk about the founder of the Japanese candlestick. The founder and creator of candlestick trading is Munehisa Homma, Munehisa Homma was known as someone that was born into a rich rice merchant family, he was born around 1724 and after the passing of his father, he take over the rice business. Munehisa Homma was very intelligent since when he was little, he was known to have written multiple books on his trading techniques, Homma lives in Sakata and where the rice is done mostly, in Osaka because Osaka was a large city, also has more traders than other neighboring cities and the city also allows traders to trade using coupons, rice business is more profitable over there and the distance between Osaka and Sakata is much, so he started studying and trying to derive a suitable way of making trade in Osaka and also maximizing more profit.
After a long analysis, Homma created the Japanese candlestick chart around the 1700s and the idea behind the creation of this trading chart is so that he will be able to have a better analysis of market price, demands, and also the changes in rising and dropping of the market price, as we can see his creation then leads to what can be used to influence market today where candlestick charts is been used to trade and analyze the market flow like Cryptocurrencies, forex, stocks, amongst other financial instruments.
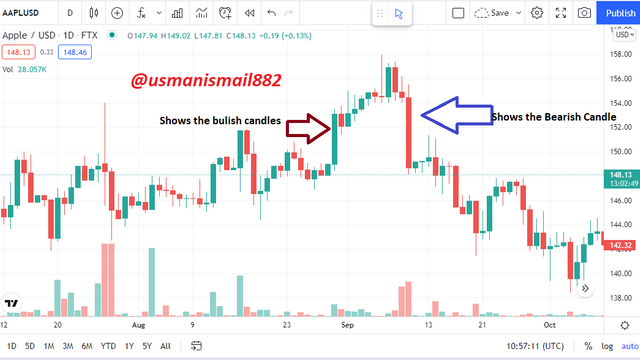
Image showing the analysis of market using Japanese candlestick
image source
And as we can see from the above image, it shows us how the Japanese candlesticks look like and also how it was differentiated so that it will be more understandable and also helps to detect when the market is at his highest price reach and also when it is at his lowest price reach.
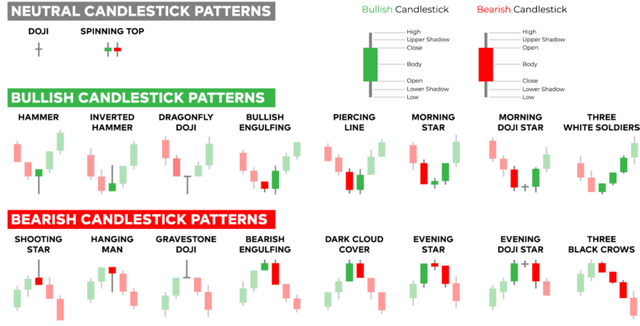
image source
The above image shows the pattern Japanese candlestick normally takes, it also shows how to know the market state, the direction that the market is taking, and also able to identify the market pattern.
In your own words, explain why the Japanese Candlestick chart is the most used in the financial market
The reason why the Japanese candlestick chart is the most used is because;
Good Indicator: The Japanese candlestick has a good indicator that helps in analyzing the market flow much better compared to any other chart.
Accurate Information: It also gives accurate information on the market price which also helps in analyzing the market further.
Identifying Market Patterns: Japanese candlestick also helps in identifying the market pattern accurately which also helps to determine the specific info bout bullish reversal patterns and bearish reversal patterns.
Identifying market direction: The color and shape of the Japanese candlestick makes it easier to know and identify the market direction, users will be able to determine if the market price is going to rise or drop.
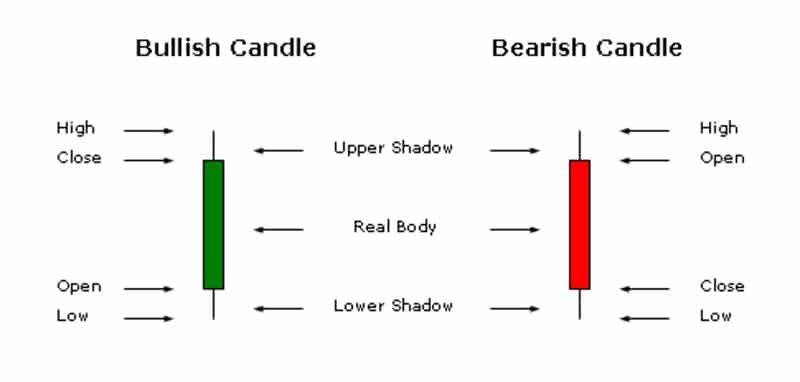
Describe a bullish and bearish candle. Also, explain its anatomy. (Original screenshot required)
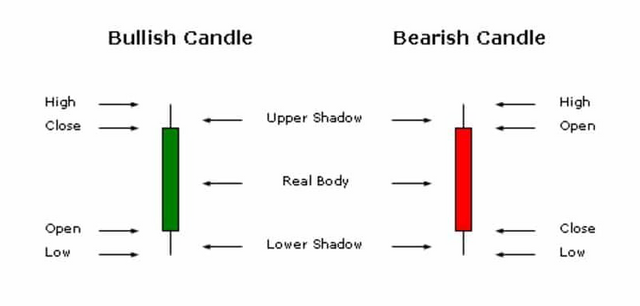
image source
As explained earlier Bullish and bearish candle, bullish candle helps to show the rise of the stock in the market and also help to analyze the steadiness of the market price, while the bearish candle helps to indicate the drop of stock and price drop in the market.
Bullish candle
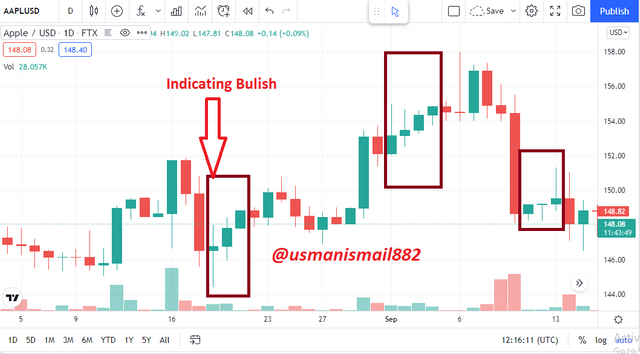
image source
From the image above the bullish candle shows that the initial starting price is low, after some time it close up at a higher price. When it comes to a bullish candle, it always closes at a higher price compared to the initial stages sale price because mostly the demands of the product are higher than the supply which also causes the price rise.
Anatomy Of A Bullish Candle
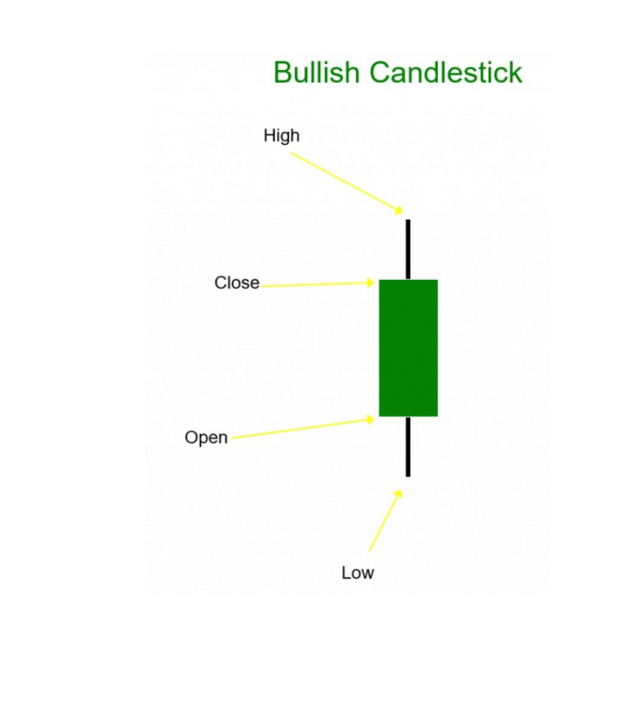
Most bullish candlesticks have about four parts which are Low, Open, High and Close, all these parts represent different reactions of the price at different times, I will be explaining them thoroughly, it is also known as the (bull)
Low: This indicates the starting price and also the lowest price that is presented in the market, because of inadequate supply of goods, demands tend to rise which also causes the price to rise.
Open: this indicates the opening of market price, which means the goods have been placed in the market, buyers can start bidding for them which also causes a fluctuation in the market price for the goods.
High: this indicates that the goods have reached the highest price, the market is liable to close with the highest price of sale.
Close: this also indicates that after the market reaches the highest price, the goods will be sold for that high price and the market will be closed, the sale price has also changed compared to the initial open price.
Bearish Candle
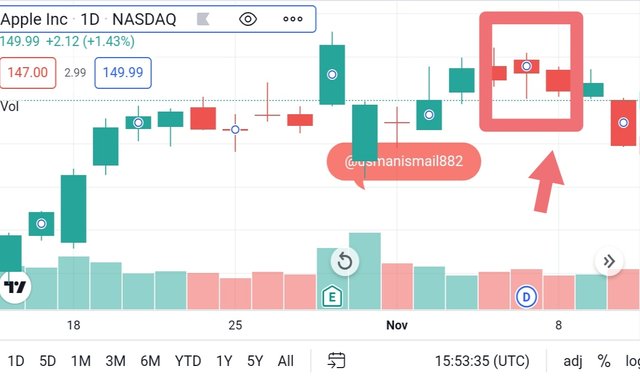
image source
The image above shows the bearish candlestick, the arrow that is pointing at the red chart indicates the pattern that the bearish candlestick follows.
Bearish candlestick is a technical chart pattern that identifies when the market price will be dropping, also signifies the high rate of possibilities of market price dropping to the lowest level, it is also known as the (bears).
Anatomy Of A Bearish Candle
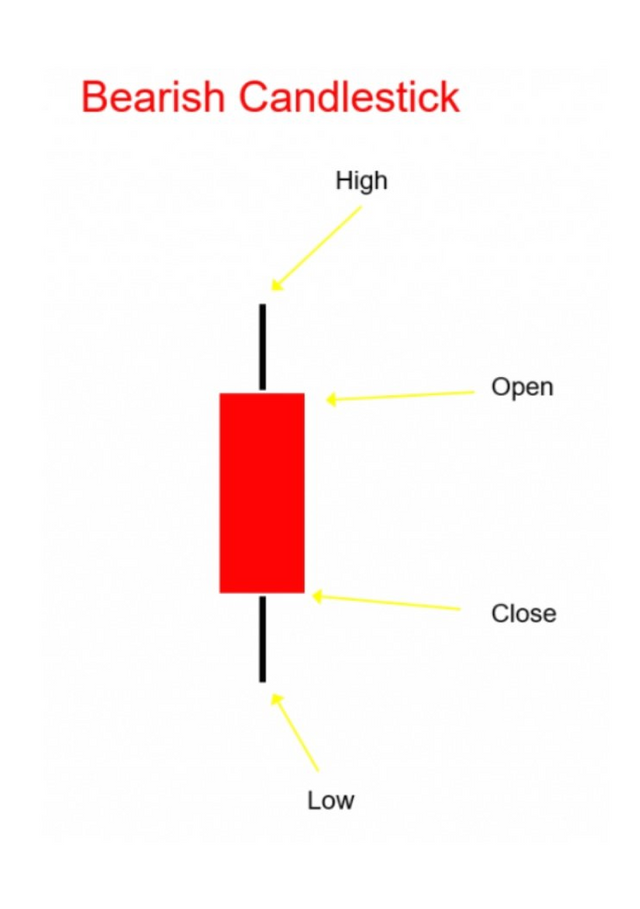
Most bearish candlesticks have four parts which are High, Open, Close, Low.
High: this indicates that the current price reached in the market is high, also signifies that the price has reached the highest peak.
Open: this also indicates the start or the beginning of the candle pattern, which also indicates the current and fluctuations of the market price.
Close: The bearish pattern is indicating here that they are dropping in market price and the market is closing, which also shows the closing price in the market.
Low: This indicates the price drop and how much the price drop in the market between a certain period, because of the pressure on the market, the supply tends to be high which also causes the fluctuations of price in the market.
Conclusion
The Japanese candlestick is very essential in market analysis because it helps the market in decision-making in market price and also helps to determine the market fluctuations either is heading for the Bull or the Bear. Special thanks to prof @reminiscence01 for his wonderful explanation of the course.
#club5050 😀