[Recognizing Simple Patterns in Trading] - Crypto Academy / S5W2- Homework Post for @sachin08".
Good day everyone, how are you all doing? I welcome you all to this week's crypto academy class season 5, this week's course is about Recognizing Simple Patterns in Trading. And thanks to professor @sachin08 for taking to elaborate more about the course which helps us to understand more on the course. Without taking much of your time, I will be answering the homework questions given in class, so do stay with us!!!

Q1. What is your understanding of Triangles in Trading? Explain all forms of triangles in your own words. (Screenshot required)
The cryptocurrency has become one of the world's largest trading platforms, where organizations, industries, and individuals make their day-to-day trading transactions. In the process of trading, many traders tend to have different methods they use to make their analyses to have a better view of either the market price is rising or dropping, and this also helps them to know the direction of the market, which also shows if the market is on ascending order or descending order, which now brings us to Triangles in Trading.
This triangle trading is known to be a chart pattern that shows the trendlines that are in line with a certain price range. And it can be said to be a technical analysis tool that helps traders to recognize the pattern that the market price is taken, these patterns are of different types which are the ascending triangle, descending triangle, symmetrical triangle. And the patterns are very important to traders because, with this, traders will be able to determine the prospect of the market, which also helps to determine if the market price is going to rise or drop. With this traders will be able to minimize loss when trading and also help to make more profit when following the trading patterns.
Now let us talk about the three types of triangle patterns we have.
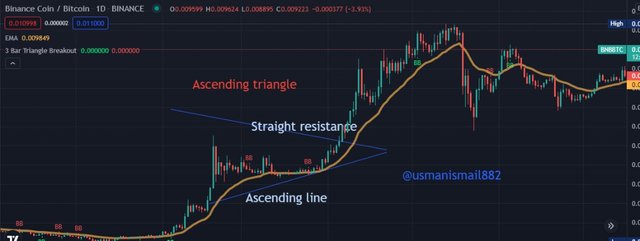
- The Ascending triangle: The ascending triangle is one of the methods that show when the market price is rising, this also allows a horizontal line to be drawn along the trendlines that shows that the price is moving in an upward direction and this line is what we call the ascending line, this lines can also be seen as a bullish trend because it also shows the rise in price for a specific period, also a trendline to be drawn which shows when the price is low and this line is what is called straight resistance, these two lines are the ones that form the triangle which also shows the ascending pattern of the market price for a specific period.
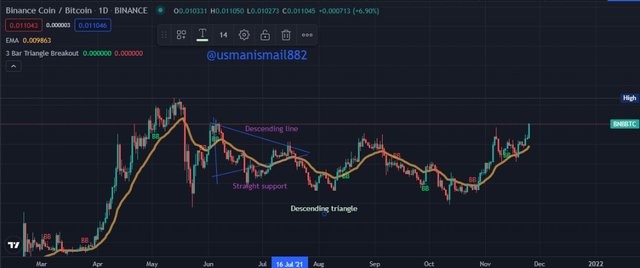
- The Descending triangle: The descending triangle is just like the opposite of the ascending triangle, in the case of the descending triangle, it helps the traders to identify the dropping price of the market for a specific period of time, the descending triangle also shows the bearish pattern in the market price. And the descending triangle also has two lines that intersect one another, but the long one shows a downward movement which means the descending line while the low one shows straight support instead of resistance.
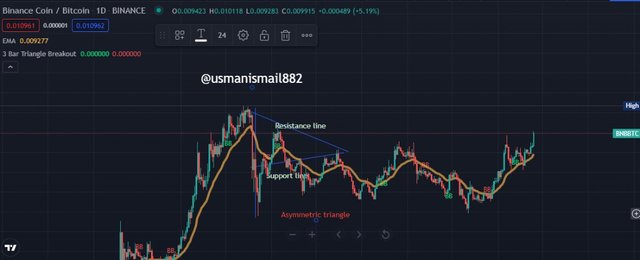
- Symmetrical triangle: The symmetrical triangle is a type of pattern that is used in trading with two trend lines where the two lines are identical, the upper line is the one that starts from high and end up intersecting the other line, this line is called the resistance line, while the other line draws a straight line which intersects the other line at a point, this line is called the support line, with the intersection of both the lines helps the traders to be able to identify the current flow of market at a particular time.
Q2. Can we also use some Indicators along with it Triangle Patterns? Explain with Screenshots.
Yes of course we can make use of some indicators with also the use of the triangle patterns, in this case, I will be making use of a moving average extension which is the EMA, TEMA indicator and this indicator is commonly used by traders because it helps most traders in identifying the market flow either they is a rise or drop in price, in order to use this indicator, they are some little adjustments you are to make to make on the indicator like the precision, time interval the indicator will run.
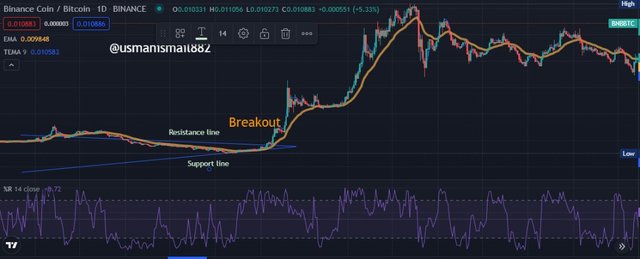
From the chart above, we were able to see the line indicator which also displayed that from the beginning they are a little resistance in the price rise, also displayed the steadiness of the rise in price which is displayed as the support line, when it reaches a certain period they tend to be a breakout in price, which shows that after the initial resistance they tend to be an upward rise in price.
Q3. Explain Flags in Trading in your own words and provide screenshots of both Bull Flag and Bear Flag
In trading, the flag represents a special triangle pattern, this flag pattern mostly happens whenever they are a movement in the market price which also indicates that the flag pattern is mostly formed when the market has a significant amount of rising or drop in the trendline, the main use of these flag pattern is to identify the accurate the price in the market fluctuate either the price in market rise which shows that the flag is a bullish flag, while when they are a downward movement along the trend line it shows that the flag is a bearish flag.
- Bull Flag: The bull flag pattern is a technical chart pattern that shows a perfect entry time for traders to make a move on a strong uptrend with the use of the bull flag. For you to identify, the first thing you noticed is that they will be an upside movement along the direction of the chart pattern which will show the momentum of the price either it is moving towards an uptrend or downtrend, after that the next step is to wait and study the movement of the trend because sometimes it might go towards the downtrend channel where the most lower structure is presented. With this, you will be able to identify the correct the market is taking and you will be able to represent your bull flag at an appropriate time.
- Bear Flag: The bearish flag pattern represents a chart pattern that shows the extension of a downtrend movement in price after a breakout. The bear flag mostly helps the seller to drive the price in the market down more. After a certain time, the price will integrate inside two parallel lines which shows the opposite direction of a downtrend, when the pattern of the bear flag is on, then the price of the market tends to towards the downtrend line more.
Q4. Show a complete trading setup using these patterns on any cryptocurrency chart. (Ascending Triangle, Symmetrical Triangle, Bear Flag)
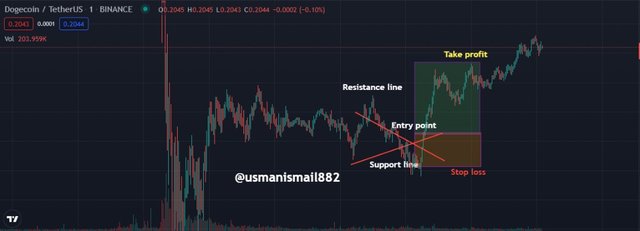
The Ascending Triangle
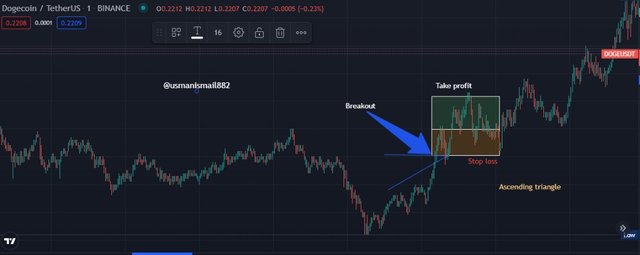
The chart image above shows an ascending triangle setup where two lines intersect each other at a point, the straight line represents the resistance while the other line represents the support line, which can also be seen as the ascending line which shows the upward trend value. And at a point in time they tend to be a breakout which shows the entry point, after that we were able to get a pattern that indicates when to take profit and when to close the market to avoid a significant loss.
The Symmetrical Triangle
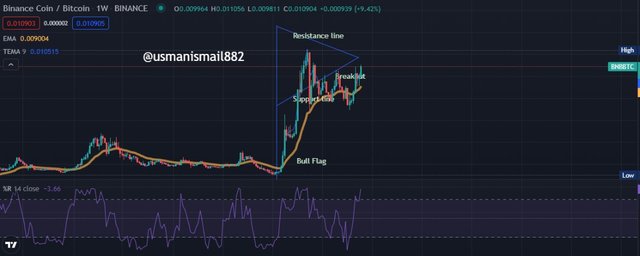
The above chart pattern shows the symmetrical analysis that was taken, in this analysis we can see that the two-line cross one another which signifies that the pattern in the market is symmetrical, where the market will interchange from a bullish signal to a bearish signal, sometimes the price will move towards the upper trend while sometimes it will move towards the downward trend. With the symmetrical triangle, we were able to get the average time to make prove and the time to stop loss.
The Bear Flag
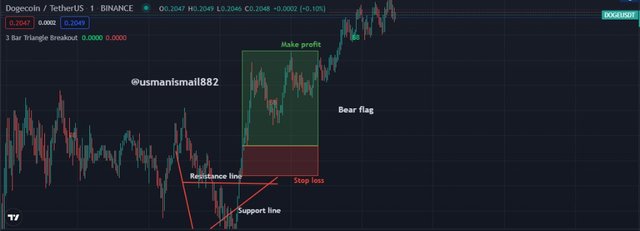
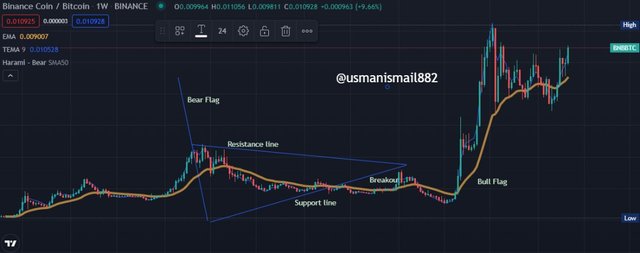
The image above shows the bearish flag setup, we can see that they are a massive downtrend from the bear pattern which signifies that the sellers are the ones dominating the market. And with the help of the bear flag analysis, we were able to know the specific time we are to take profit and also the time to stop loss because the bear flag helps us to identify the pattern the market is to take for any specific period of time.
Conclusion
From all this conversation, we were able to see that the triangle trading patterns are very useful for traders, for them to make accurate analysis in order not to make too much loss and also for them know the specific time for them to take profit, from this course we were able to learn more about the different types of triangles we have and also the various uses. Special thanks to professor @sachin08 for his wonderful explanation on the course, which is the main reason why I was able to learn more about triangle tradings.
Cc;
Professor @sachin08