Ultimate oscillator indicator- Steemit Crypto Academy- S5W8-Homework post for @utsavsaxena11
Greetings everyone. It is an honour to be a part of the final week of Crypto Academy Season 5. This week's lesson was on the Ultimate Oscillator which is a technical indicator that measures price momentum. I would be handling the tasks given by the professor in this post. Without further ado, let me begin.
Ultimate Oscillator
The ultimate oscillator is a technical indicator that measures the momentum in price movement. It gives periodic signals which indicate the velocity of the price of an asset. These signals are used for determining if the price is going up or down.
The ultimate oscillator was developed in 1976 by Larry Williams. It was developed to be used on different timeframes so that fake signals can be filtered. This indicator also gives less signals, making it more accurate and versatile in market analysis.
Trends are signalled by divergences and movement of the oscillator to the overbought and the oversold regions. This would be discussed in the later parts of this post.
How to Calculate the Maximum Value of the Oscillator for a particular Time Period or Candle
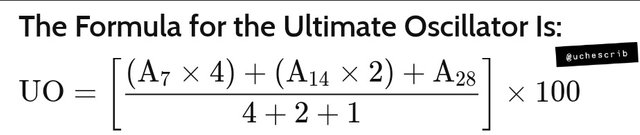
The formula for the Ultimate Oscillator is given above, where:
UO = Ultimate Oscillator
A = Average
The formula means that the average of the last 7, 14 and 28 periods would be taken. To get the averages, the buying pressure (BP) and true range (TR) must be taken into account.
BP = Close - Min(Low, Prior Close)
TR = Max(High, Prior Close) - Min(Low, Prior Close)
I opened the ADAUSDT chart on the 1hr timeframe in TradingView and marked the point on the ultimate oscillator that I would uptain the value. I also used a spreadsheet to manually input the values and obtained the values for the Buying Pressure, True Range and Averages.
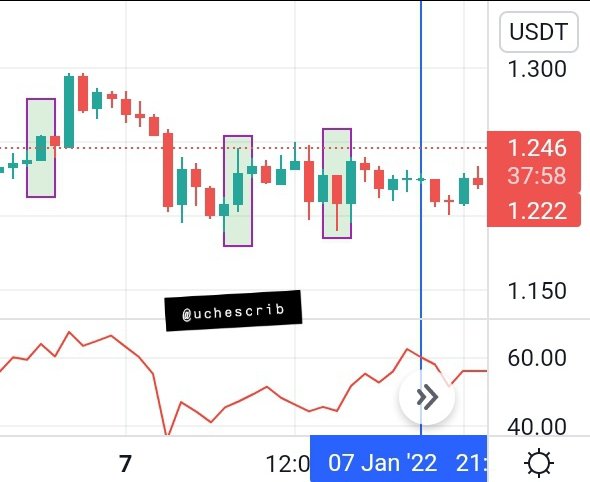
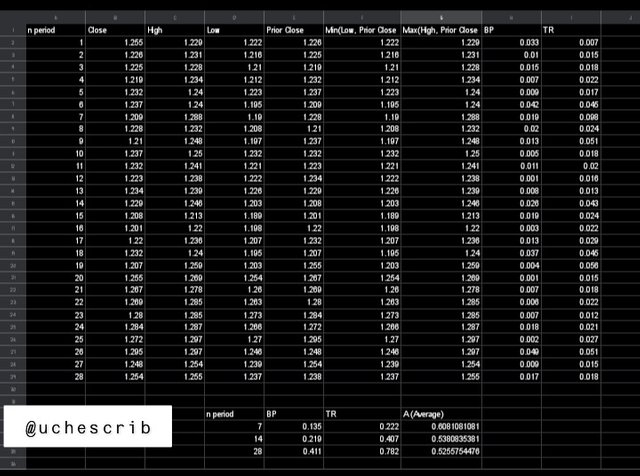
Finally, let's derive the ultimate oscillator value:
- A7 × 4 = 0.6081081081 × 4 = 2.4324324324
- A14 × 2 = 0.5380835381 × 2 = 1.0761670762
- A28 = 0.5255754476
- (A7 × 4)+(A14 × 2)+(A28) = 4.0341749562
- ∴ [4.0341749562÷(4+2+1)]×100 = 57.6310708028571428571428
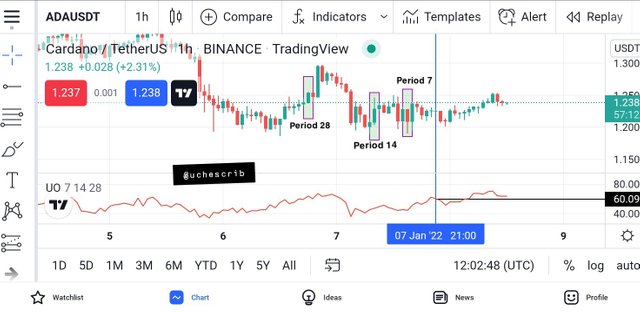
The value obtained from my calculation is approximately 57.63 which is opposed to the value of 60.09 given by the chart. The difference is 3.06 which gives an error 5.09%. The error is acceptable, making the calculation correct.
How to Identify Trend using the Ultimate Oscillator
The ultimate oscillator has a range of values from 0-100. It has already been mentioned that the indicator measures the momentum in price movement. This means that overbought and oversold regions are formed by this indicator.
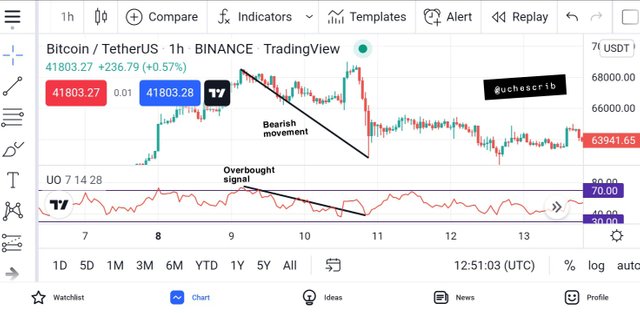
The overbought region is marked at the range of values >70. When the oscillator reaches the overbought region, it is a good signal of a downtrend. This means that the asset is trading above it's fair value and a price correction would be observed. This means that a downtrend is signalled by the oscillator at the overbought region.
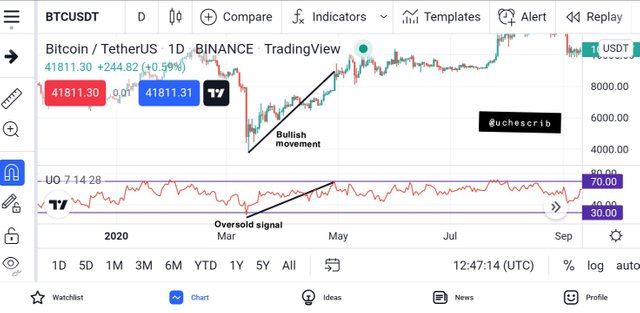
The oversold region is marked at the range of values <30. When the oscillator reaches the oversold region, it is a good signal of an uptrend. This means that the asset is being sold below it's fair selling value and a price correction would be observed. This means that an uptrend is signalled by the oscillator at the oversold region.
Difference Between Ultimate Oscillator and Slow Stochastic Oscillator
The stochastic oscillator is a momentum indicator just like the ultimate oscillator. It is made up of two oscillators which are the %K and %D. The %K is known as the fast oscillator while the %D is known as the slow oscillator.
The slow oscillator is the 3-period moving average of the fast oscillator, which means that it smoothens the signals given by the fast oscillator. The fast oscillator, which the slow oscillator is dependent on, is calculated with 14 periods. This would mean that the signals given by the ultimate oscillator is more accurate than that given by the slow oscillator because it (the ultimate oscillator) is calculated with 28 periods which incorporates more price values.
It is easy to identify trends and trend reversals with the slow stochastic oscillator just like the ultimate oscillator. The only difference is that reading a chart with the slow stochastic oscillator would require the fast oscillator for more precise readings, while the ultimate oscillator is not dependent on any other tool.
Also, the slow stochastic oscillator is more sensitive than the ultimate oscillator. This is because of the 14 periods used for the oscillator's calculation as opposed to the 28 periods used for the ultimate indicator. More periods result in more accuracy and less sensitivity.
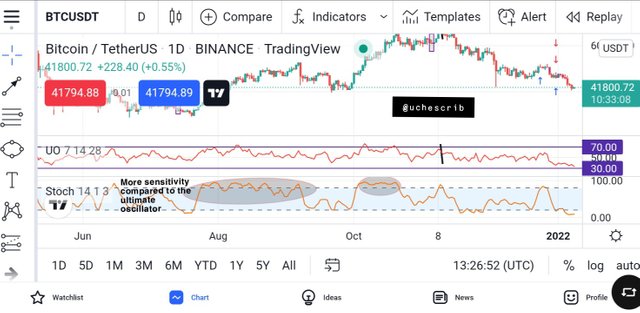
Finally, the slow stochastic oscillator marks it's overbought region at values >80 and it's oversold regions at values <20. This is different from that of the ultimate oscillator which is >70 for overbought signals and <30 for oversold signals.
Identifying Divergence with the Ultimate Oscillator
Momentum oscillators are used for identifying divergences in the market. The ultimate oscillator can be used to identify both the bullish divergence and the bearish divergence.
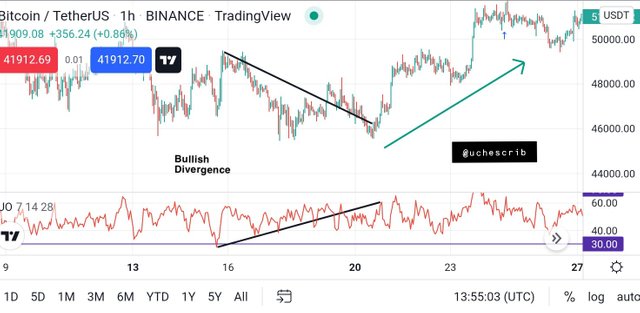
Bullish Divergence
A bearish divergence is a situation where price forms lower lows, but the oscillator fails to record this. Instead of lower lows, the oscillator would instead record higher lows. This situation signifies that the bears are losing their power over the market, and the bulls would take over. A bullish divergence usually starts with price at the oversold region.
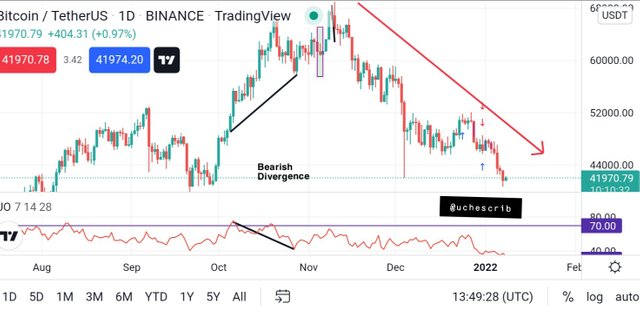
Bearish Divergence
A bearish divergence is a situation where price forms higher highs but the oscillator does not. In opposition to the higher highs formed by price , the oscillator would form lower highs. This demonstrates that the bulls are losing their influence on the market and a bearish trend would be formed. A bearish divergence usually starts with price at the overbought region.
"if we are unable to identify divergence easily than which indicator will help us to identify divergence in the market?"
The MACD indicator can help in identifying divergences if it is difficult with the ultimate oscillator. The MACD is trend-following indicator that also measures momentum. This means that the MACD would follow the trend just like the simple moving average, but can also detect the momentum of the market and move in the opposite direction of the trend if the momentum contradicts the trend.
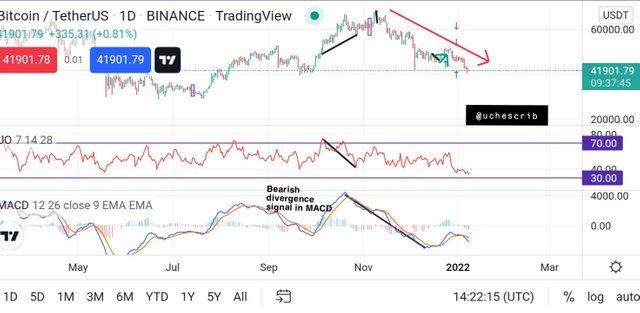
The image above demonstrates a situation where the MACD indicator is used to determine a bearish divergence. The chart is the exact same one I used prior to this one. It was difficult to identify the divergence so I incorporated the MACD indicator to the chart. The indicator can be seen following the trend up until it(MACD) made a sudden reversal in movement. This change in direction was observed even before the price changed.
It is because of this that the MACD is a good indicator. Combining this indicator with the ultimate oscillator would make it easier for divergences to be identified.
3-step Approach for making Entry and Exit with Ultimate Oscillator
Using the ultimate oscillator, entry and exit in the market is very easy. Only three steps are followed to make proper entries and exits.
For a Buy Entry
A bullish trend must first be identified and confirmed. The ultimate oscillator gives bullish signals when there's a bullish divergence. This is when price forms lower lows but the oscillator forms higher lows.
The divergence must start from an oversold region which is marked by values >30 on the oscillator. This implies that the first low must be formed at the oversold region and the oscillator would move upwards.
The final step is for the ultimate oscillator to rise and form a new high which would be higher than the lows that precedes it.
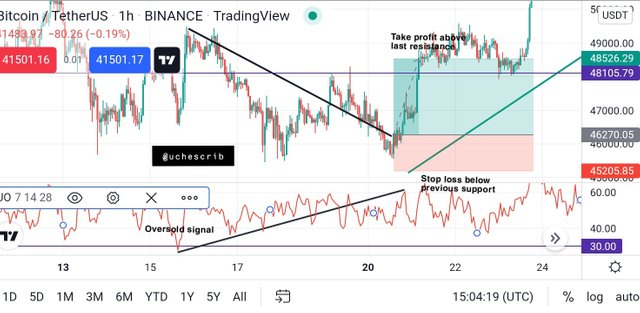
The image above illustrates the steps to make a buy entry. The entry was made at the candlestick that was formed after the bullish divergence has been drawn. The stop loss is set below the last support and the take profit is set above the last resistance.
For a Sell Entry
A bearish trend must be identified and confirmed. Bearish trend is signalled by a bearish divergence, when price forms new higher highs but the ultimate oscillator forms lower highs.
The divergence must start from an overbought region which is marked by values >70 on the indicator. Therefore, the first high must be formed at the overbought region and move in a downward motion.
Lastly, the ultimate oscillator must form a new low that would be lower than the highs and lows that precedes it.
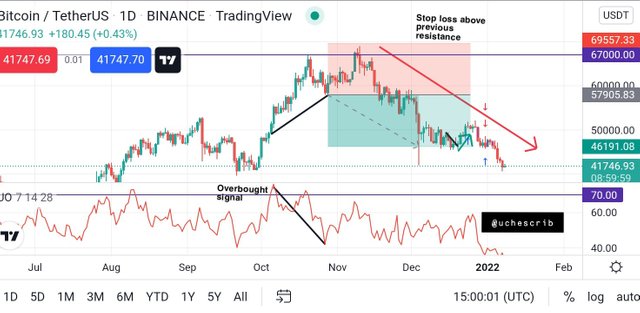
The image above illustrates the steps to make a sell entry using the ultimate oscillator. The entry is made at the candlestick formed after the divergence has been drawn. The stop loss is placed above the previous resistance and the take profit point is set using a risk-reward ratio of 1.
My Opinion on the Ultimate Oscillator
The ultimate oscillator is very effective in market analysis in my opinion. I experienced results that range from fair to very good while using this indicator. It is most useful when identifying divergences which lead to trend reversals in the crypto market. Because of this, it is possible to make correct entries as a new trend begins.
It is also very accurate in giving signals because of the periods that are used in it's calculation. The ultimate indicator has low sensitivity which makes it unaffected by small changes in price. This is a disadvantage as some little retracements cannot be signalled by the indicator, but it becomes advantageous as the indicator does not record insignificant price movements.
The ultimate oscillator is best for smaller timeframes like the 5min timeframe. It is also good for trading in timeframes as little as an hour. This is because of the low sensitivity which the indicator offers. Insignificant price movements are ignored by the oscillator and significant ones are indicated. Intraday trading doesn't necessarily require a lot of signals for optimum results. This is why the ultimate oscillator is most effective with these timeframes.
Conclusion
The ultimate oscillator is a an indicator that measures price momentum of an asset. The extent to which a price has been traded is signalled by this indicator, making it possible to easily detect trend reversals.
For the best results with this indicator, it should be combined with other indicators. Confluence between this indicator and other indicators incorporated into a trade would increase the chances of profit making.
Cc: @utsavsaxena11