Trading Strategy with Price Action and the Engulfing Candle Pattern - Crypto Academy/S5W7 - Homework post for @lenonmc21
Greetings my fellow steemians. It is an honour to be a part of the 7th week of Crypto Academy Season 5. This week's lesson is on a trading strategy that involves price action and the engulfing candlesticks. I will handle the tasks given by the professor in this post. Without further ado, I would begin to tackle the task.

Trading Strategy with Price Action and the Engulfing Candle Pattern
Trends in the market are defined by price movement in a definite pattern. Price moves downwards in a downtrend (or bearish market) and upwards in an uptrend (or bullish market).
The trend of a market always has a harmonious pattern, meaning that the patterns of a particular trend follow a definite order for the the trend to be defined. This makes it possible for traders to be able to make entries and exits in the market.
A break in trend is usually a good situation to make an entry in a market. In this technique, we watch for the formation of candlesticks that indicate a reversal in trend. These candlesticks must be at least three or four and must show clear signs of a reversal.
A retracement would be observed after the trend reversal signal, and an engulfing candlestick would be formed in the retracement. The engulfing candlestick has such name because it is longer than the previous candlestick. The engulfing candlestick would be used to mark a region that would be suitable for making an entry in the market.
This technique requires two timeframes for proper execution. Smaller timeframes like the 15min and 5min timeframes are suitable for this strategy.
Steps for Proper Strategy Execution
- Identify a market with defined trend:
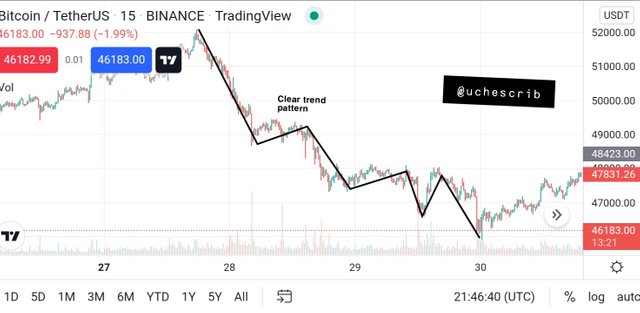
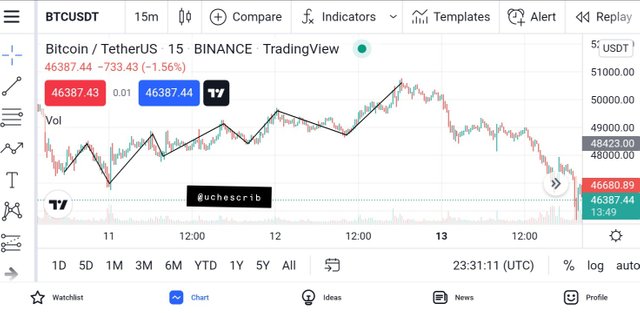
The first step to follow inorder to execute this strategy correctly is to look for a market with a defined trend. A bullish market is defined by higher highs and higher lows, while a bearish market is defined with lower highs and lower lows. Unless the trend is properly defined, this strategy cannot be accurately executed. It is also important for the trend to be defined in a small timeframe. 15mins timeframe works fine for this technique.
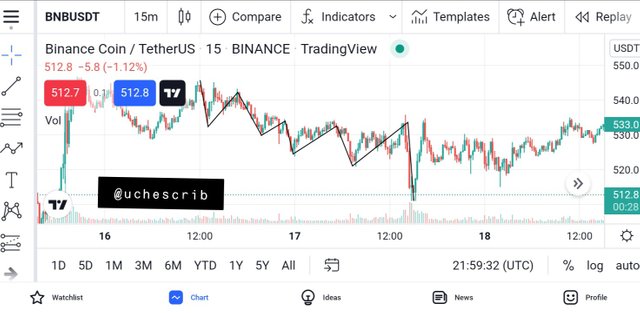
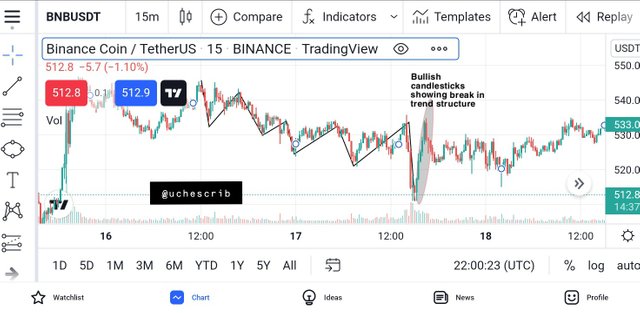
- Identify a break in the structure of the trend:
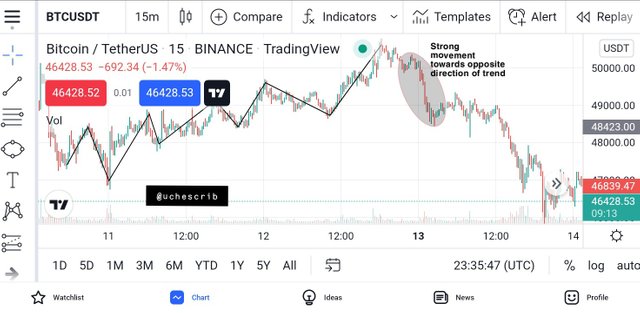
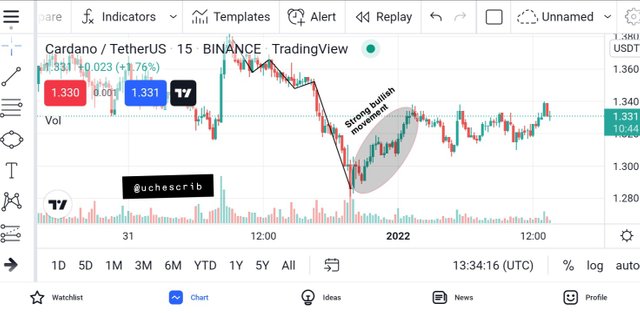
The next step is for the trend to experience a break in structure. This is identified by a strong movement in the opposite direction of the current trend. In the image below, the market was in a downtrend. Strong bullish candles were later formed which broke the structure of a downtrend, indicating a possibile trend reversal.
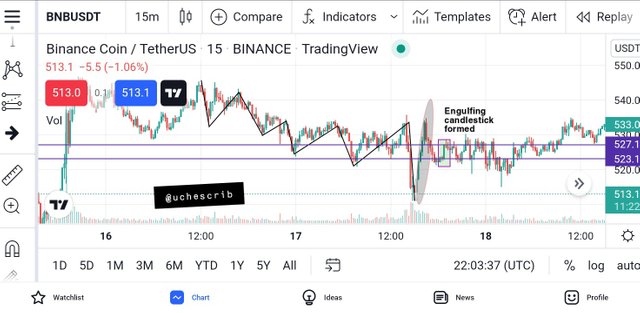
- Identify a retracement of the broken market structure and look for an engulfing candlestick pattern:
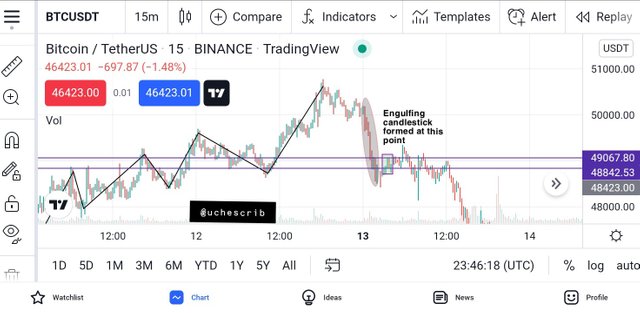
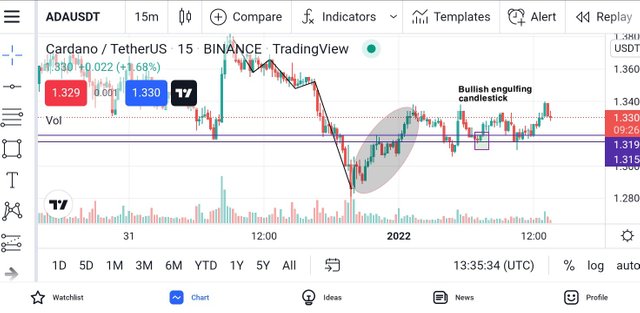
After the strong movement in the opposite direction of the trend, a retracement should occur. During the retracement, an engulfing candlestick should be expected which indicates that a good entry position has presented itself. Let's take the image below as an example. Price experienced a retracement after the strong bullish move and an engulfing candlestick was formed during this retracement. The ends of the candlestick would be marked with horizontal lines to highlight the desired region.
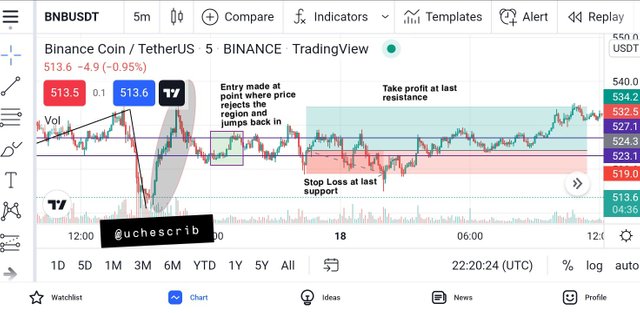
- Switch to 5min timeframe to find a good entry position:
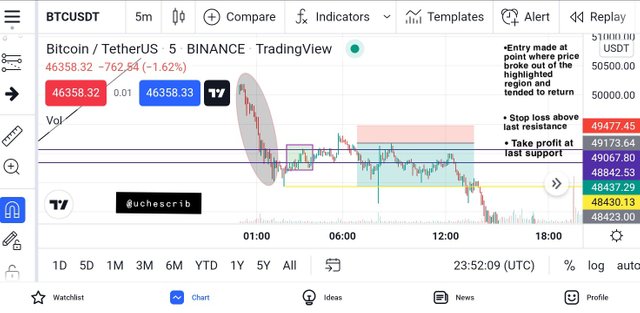
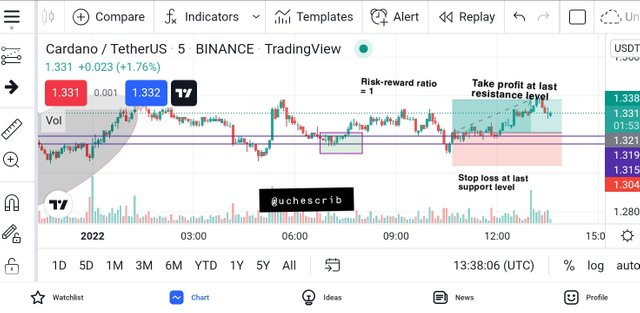
The next step is to switch to the 5min position in order to find a suitable entry position. We look for a situation where price breaks the marked region and moves in again. In the image below, an entry was made as price tends towards the region once more. The stop loss should be at the preview support while the take profit point should be at the support formed during the strong bullish movement.
2nd Illustration with Trade Strategy
Interpretation of a Large Strong Movement in the Market
Price movement in the crypto market is controlled by the activity of buying and selling of crypto assets. Price increases when there's high demand, leading to large number of buy orders in the market. On the other hand, price drops when there is high supply, which is caused by a greater number of sell orders in the market.
In every crypto market, a greater percentage of the asset is held by certain individuals who are involved in the market. These individual are called whales.
Actions of whales have a high influence on the movement of price in the crypto market. A large strong movement is simply a situation when these whales in the crypto market buy or sell a particular asset in large quantities.
Strong movements in the market usually lead to a forced movement of price in the direction of the strong movement. In the situation of a strong downtrend, the whales sell the asset in large amounts, causing price to drop. Other traders would then trade according to the trend which would cause the downtrend to continue. As price reaches a specific region, the whales would buy back the asset in large amounts, and this would cause the price to rise greatly.
It is a never ending cycle in the crypto market. With this knowledge, traders utilize these situations to identify proper trend reversals, trend continuations and false breakouts in the crypto market.
Trade Entry and Exit Criteria using the Price Action and Engulfing Candlestick Pattern for both Buy and Sell Positions
Buy Position
- First step is to ensure that the price is in a downtrend in the 15min timeframe. This downtrend must be defined by price movement downwards as lower lows and lower highs are formed. If there is no defined trend and the price is in a range then the strategy cannot work.
- A strong movement would be made in the opposite direction of the downtrend. This implies that price would make a sharp movement upwards and this movement must be marked by at least 3 or 4 bullish candles.
- A clear bullish engulfing candlestick must be formed at the retracement of price after the strong movement. Both ends of the candle are marked to highlight the desired entry region.
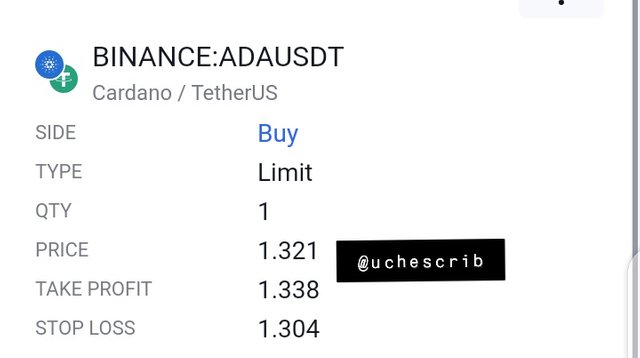
- The time frame is switched to 5mins to get a good entry point. We wait for price to break the highlighted region marked by the bullish engulfing candle in order to create a long position in the market. After an entry has been made, it is time to set the stop loss and take profit points. The stop loss should be at the last support after the strong bullish move and the take profit should be at the last resistance level formed by the strong bullish move. A risk-reward ratio of 1:2 can be used if the change in trend seems to be very strong.
Sell Position
- First step is to ensure that the price is an uptrend in the 15min timeframe. This uptrend must be defined by price movement upwards as higher lows and higher highs are formed. If there is no defined trend and the price is in a range then the strategy cannot work.
- A strong movement would be made in the opposite direction of the uptrend. This implies that price would make a sharp movement downwards and this movement must be marked by at least 3 or 4 bullish candles.
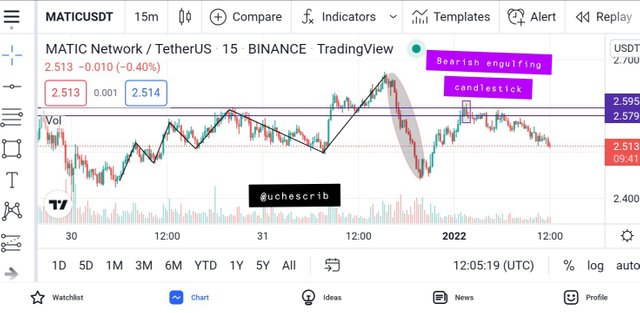
- A clear bearish engulfing candlestick must be formed at the retracement of price after the strong movement. Both ends of the candle are marked to highlight the desired entry region.
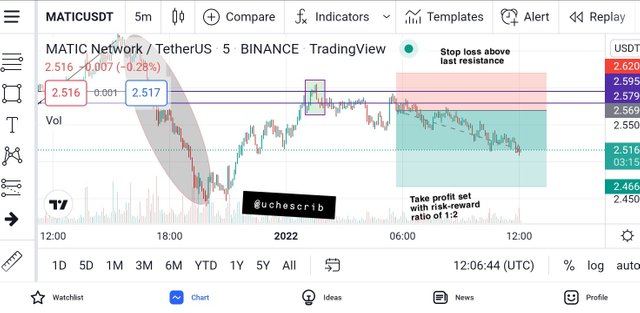
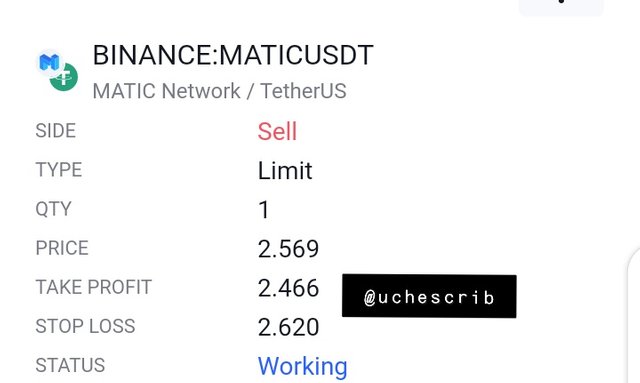
- The time frame is switched to 5mins to get a good entry point. We wait for price to break the highlighted region marked by the bearish engulfing candle in order to create a short position in the market. After an entry has been made, it is time to set the stop loss and take profit points. The stop loss should be at the last resistance after the strong bearish move and the take profit should be at the last support level formed by the strong bearish move. A risk-reward ratio of 1:2 can be used if the change in trend seems to be very strong.
Demo Trade with Strategy
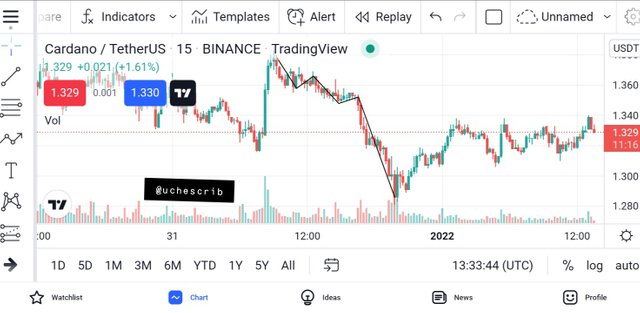
First Trade
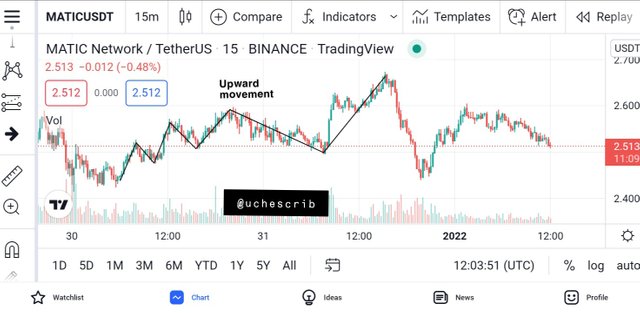
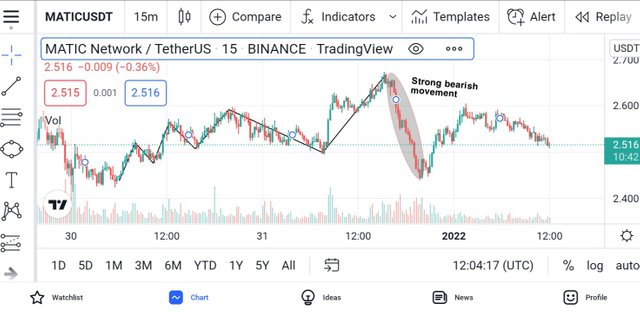
Second Trade
Conclusion
The price action and engulfing candlestick strategy is very effective given that all the parameters are strictly followed. The engulfing candlestick on its own is a strong indicator of a trend.
Combining this strategy with signals given by technical indicators would increase the win rate of trades. Confirmation of signals given by a strategy is a very effective trading technique because it decreases the chances of loss and improves the chances of profit making.
Cc: @lenonmc21