Bichi Indicative Strategy- Steemit Crypto Academy- S5W6-Homework post for @utsavsaxena11

BICHI Strategy
The BICHI strategy is simply the combination of the Ichimoku Kinko Hyo and the Bollinger Bands in technical analysis of a cryptocurrency market.
The Bollinger Bands indicator creates dynamic support and resistance for price movement. This means that it creates an upper and lower boundary for price movement. The baseline of the indicator is used to identify the beginning of a trend reversal as price crosses the line either up or down.
The Ichimoku Kinko Hyo consists of so many parts, but the part needed in this strategy is just the "Lagging span". This would help in identifying the beginning and end of a trend, as well as trend reversals.
Both indicators are used for analysis of strength and momentum of price. This makes the combination of the two a perfect strategy.

Identification of Trends using the BICHI Strategy
To identify trends using the BICHI strategy, the relative position of the Bollinger Bands and Ichimoku to the price chart must be taken into consideration. Let's analyse this accordingly with the two types of trends.
Uptrend
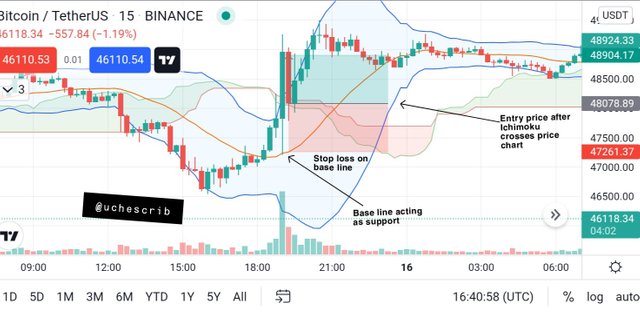
To identify an uptrend, the Bollinger Bands must be moving upwards. The baseline of the indicator must also be below the price chart acting as dynamic support. The Ichimoku should cross the price chart and move downwards to fully confirm the uptrend.
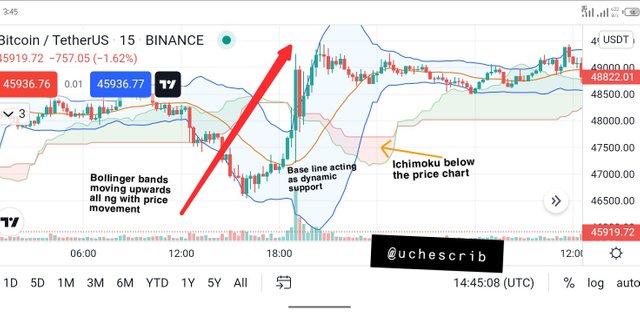
The image above is the 15min chart for BTCUSDT pair. We can observe that the base line of the Bollinger Bands indicator is below the price chart and it is acting as a dynamic support. The Ichimoku crossed the price chart and is below the chart. The Bollinger Bands is also moving upwards along with price movement. All these are taken into consideration when identifying an uptrend using the BICHI strategy.
Downtrend
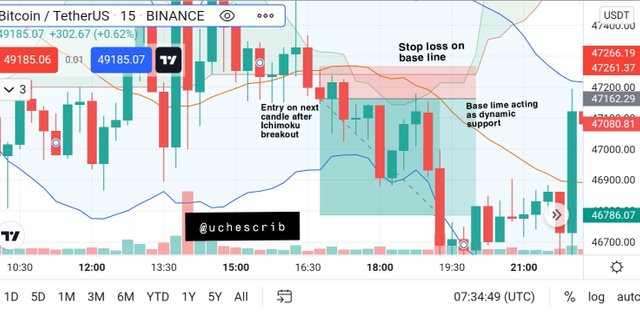
To identify a downtrend with this strategy, the baseline of the Bollinger Bands must be above the price chart acting as dynamic resistance. The Ichimoku must have crossed the price chart to move above the chart. Also, the Bollinger Bands must move downwards along with the price movement.
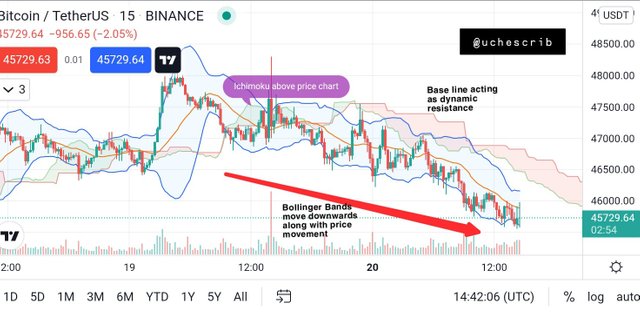
The image above is the 15min chart for BTCUSDT pair. It is observed that the base line of the Bollinger Bands is above the price chart acting as dynamic resistance. The Bollinger Bands is also moving downwards along with price movement. The Ichimoku crossed the price chart and is above price movement. All these are the conditions to note for identifying a downtrend with the BICHI strategy.
Trend Reversal using BICHI Strategy
Trend reversal is very easy to identify with the BICHI strategy. To identify a trend reversal, the Bollinger Bands must be moving in the same direction as the current trend. It gets to a point where the Bollinger Bands move sideways along with price. As the Bollinger Bands move sideways, the Ichimoku cuts the price chart a number of times. After this, price breaks out in the opposite direction of the previous trend.
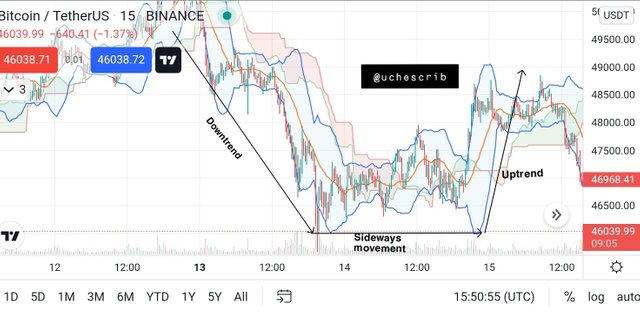
The image above shows a trend reversal from the bearish trend to the bullish trend. The Bollinger Bands is seen moving downwards along the price movement. There's a neutral trend indicated by sideways movement of price. The Bollinger Bands follow the sideways movement and the Ichimoku crosses the price chart multiple times. All these led to a trend reversal, pushing the price upwards.
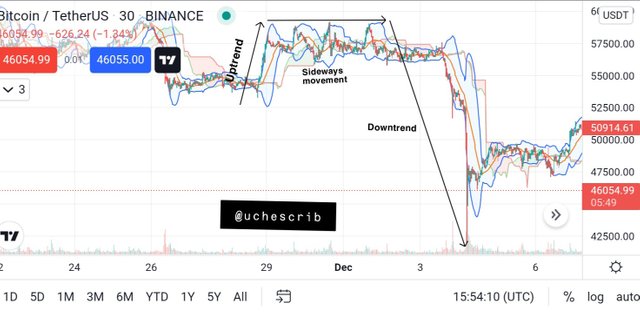
The image above shows a trend reversal from an uptrend to a downtrend. The price was initially seen moving upwards with the Bollinger Bands following along. A neutral trend is observed with price movement sideways and the Bollinger Bands following suit. During the neutral trend, the Ichimoku crosses the price chart a number of times. All these eventually led to a trend reversal, causing price to move downwards.
Market Entry and Exit using BICHI Strategy
Bullish Trend
A bullish trend must first be identified in the market. The base line of the Bollinger Bands must be below the price chart acting as dynamic support. We must wait for the Ichimoku to cross the price chart and move below it. As it crosses, the entry would be made at the candlestick after the Ichimoku has crossed. Take profit and stop loss points should be set, with the stop lop loss at the base line of the Bollinger Bands.
Bearish Trend
A bearish trend must first be confirmed by the base line of the Bollinger Bands moving above the price chart. This means that the base line would be acting as dynamic resistance to price. We must wait for the Ichimoku to cross the price chart and move upwards before making an entry. The entry should be made at the first candlestick after the Ichimoku has crossed the price chart. Stop loss should be set to touch the base line of the Bollinger Bands, and take profit point should be set using a good risk-to-reward ratio.
Demo Trade with BICHI Strategy
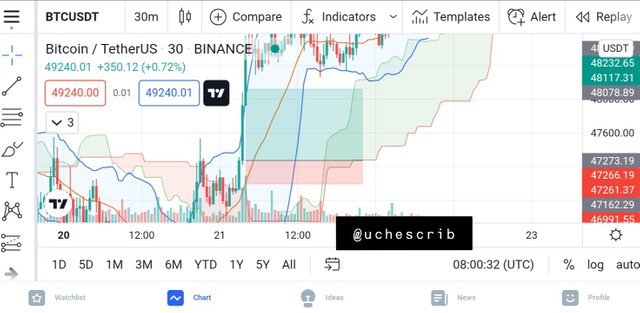
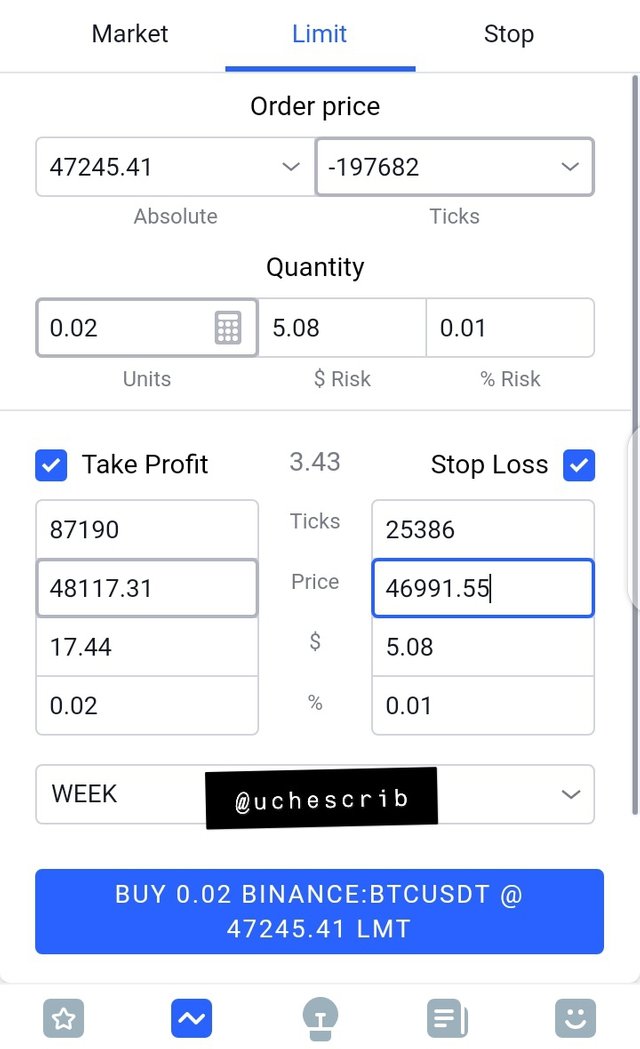
In the scenario below, we can observe that BTCUSDT pair is in an uptrend in the 30min timeframe. This is true because the base line of the Bollinger Bands is acting as dynamic support for price movement. I waited for the Ichimoku to cross the price chart and I made an entry at about 4am on the 21st of December as the cross occured.
The stop loss was set to touch the base line of the Bollinger Bands and I set my take profit point using a risk-reward ratio of 1:3.
My Thoughts on the BICHI Strategy
In my opinion, the BICHI strategy is very effective in trading cryptocurrency. While using the strategy, I encountered a few situations where the strategy does not work. These situations include;
- when the Ichimoku crosses the price chart multiple times at the peak of a trend, making the signal not to be defined.
- when the base line of the Bollinger Bands makes multiple intersections with the price chart during retracements of a trend.
The BICHI strategy is already known to have a success rate of about 80%. With this ratio, a few errors are expected with the strategy.
Tested on all time frames, the BICHI strategy is most effective using smaller time frames like the 15min and 30min timeframes. This makes it most suitable for intraday trading and swing trading. All in all, it is important for traders to familiarize themselves with this strategy in order to get the best out of it.
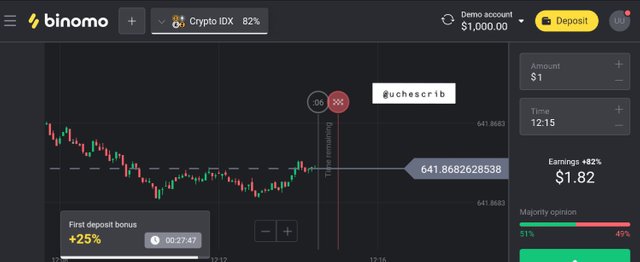
Crypto IDX
Crypto IDX is an asset that is based on the average prices of four (4) cryptocurrencies namely; Bitcoin, Ethereum, Litecoin and Zcash. Crypto IDX stands for Cryptocurrency Index and it is a synthetic asset only tradable on the Binomo platform.
A synthetic asset is a derivative that imitates the value of another asset(s). This synthetic asset also takes into consideration the forces of demand and supply of the four cryptocurrencies. The crypto IDX is tradable at all points in time on the Binomo platform (i.e it is available 24/7).
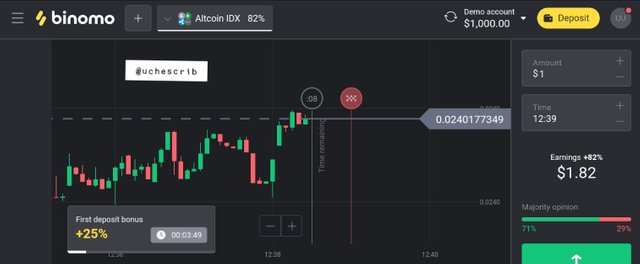
Altcoins IDX
Just like the crypto IDX, the altcoins IDX I s based on the average prices of four altcoins namely; Ethereum, Ripple, Litecoin and Monero. Altcoins IDX is only tradable on the Binomo platform and it is available 24/7 for trading.
Apart from the average prices, the altcoins IDX also considers the forces of demand supply to draw a market flow for this synthetic asset.
Signal Prediction Trading
Signal prediction trading is the type of trading option that Binomo offers. This is a method of trading that involves placing money to predict whether the price of an asset would go up or down in a given period of time.
Is it illegal in my country?
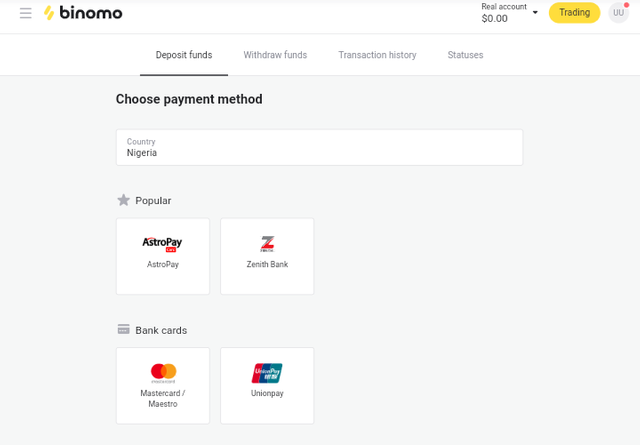
Signal prediction trading is legal in my country (Nigeria). I'll use the Binomo.com platform to explain this. Binomo came into African and Asian markets in 2018. Around this time, the platform announced Nigeria and the Nigerian-born Chelsea football star, Victor Moses, as their official ambassadors.

As a result of the partnership with Nigeria, the platform accepts Naira as a method of payment. The platform also accepts bank transfer from a notable bank in Nigeria, Zenith Bank, as a method of payment.
Binomo has also won the Broker of the Year award in the 2016 IAIR awards ceremony amongst other past achievements.
Given a prominent platform that offers signal prediction trading in Nigeria, it is safe to say that the signal prediction trading method is legal in Nigeria.
Four Penny Currencies I'll pick for my Penny IDX
A penny cryptocurrency is a cryptocurrency with a value of less than a dollar (<$1). For my Penny IDX, I'll pick Dogecoin, Ripple, Tron and Stellar.
These coins are all penny cryptocurrencies with high market capitalization values and trading volumes. This is the major reason why I have picked these four.
Market capitalization is the product of the price of a coin and number of coins in supply. A high market cap is a good investment sign for cryptocurrencies. When this is accompanied by large trading volume, the investment appears to be even better.
Some of these above mention coins like Tron, Stellar and Ripple have a number of use cases and a good whitepaper to backup their projects. Dogecoin on the other hand, began as a meme. There are no projects being developed with this token as of recent, but it is still traded on popular exchanges. This makes the token an object of value for the mean time.
Conclusion
The BICHI strategy is very effective in price analysis of a cryptocurrency market. With a high success rate of 80%, it is a safe technique to practice and include in one's arsenal of strategies for crypto trading.
Trading of crypto index and altcoins index is a skill on its own which has to be learned. Although it resembles the normal chart of crypto assets, price changes in these synthetic assets are very quick and can catch a person who isn't familiar with such market off guard.
Finally, it is best to combine the BICHI strategy with other techniques or technical indicators for better results.
Cc: @utsavsaxena11