Cryptoacademy season 3 week 8- Homework post for @asaj: The Random Index(KDJ indicator)
1.)In your own words define the random index and explain how it is calculated
The Random Index
Being a kind of offspring from the stochastic oscillator, the Random Index is an indicator which helps traders determine trends, support resistance level points (breaks) and also entry and exit points. Most indicators have these similar functions but different method s indication. The Random Index (KDJ indicator) supports these functions through the use of three lines, the %K, %D and %J lines which can help indicate whether a commodity is overbought or oversold. It is said to be birthed from ghe stochastic oscillator because it shares the %K & %D lines with it and the main difference between the two is the %J line and the %J just shows divergence between the %K & %D lines.
How is calculated
So many factors are put in place in the calculation of the KDJ indicator. Factors to be considered in it's calculation include:
- N: number of days
- C: closing price
- L: lowest price
- H: highest price
- RSV value of the day
- K value
- D value
- J value
Formulas:
RSVn= (CN×LN)÷(HN×LN)×100
Kn= 2/3(Kn-1)+1/3(RSVn)
Dn=2/3(Dn-1)+1/3(Kn)
Jn=3(Kn)-2(Dn)
These are how all the lines are being calculated.
N/B:50 is anormal replacement for the previous day value of K&D if there is none.
2.) Is the random index reliable? Explain
This is a question asked time & time again about every single indicator that is being developed Every trader, be it crypto, forex, etc will always want to make profit in every trade being placed and one of the greatest helps they have acquired in attempt to achieve this is indicators. Though they serve as a help or guiding tool, indicators aren't always 100% correct and the KDJ indicator is no exception. The KDJ was derived from the stochastic oscillator and is to serve as a kind of upgrade which it does but it still has some twitches from the stochastic oscillator and because of this, it is NOT 100% reliable.
3.) How is the random index added to a chart and what are the recommended parameters? (Screenshot required)
Adding the KDJ To a Chart
I shall be using the TradingView platform on my Android phone to carrybout this exercise.
Steps
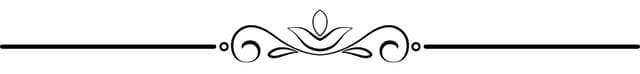
Go to www.tradingview.com
On the landing page, click on the menu bar at the top left of your screen.
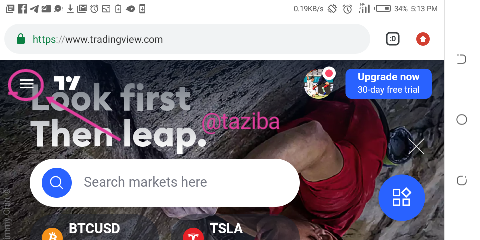
Click on charts
On the chart interface, click on fx indicators located on the the menu bar at the top of your screen.
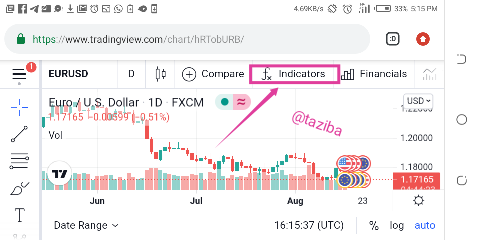
In the search bar, type in "KDJ"
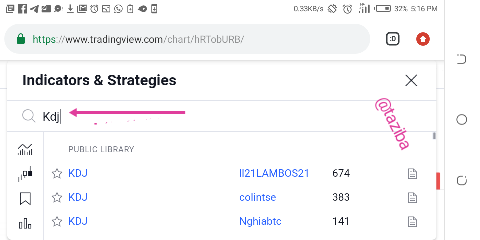
The indicator options will appear, click on any to apply.
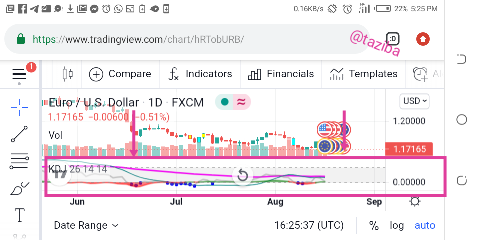
Go back to the charts, you will see that the indicator has been applied.
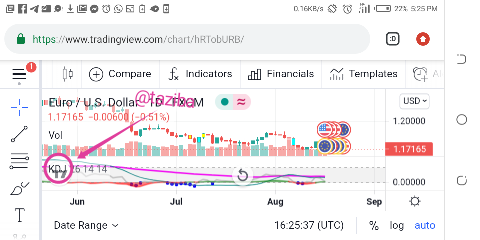
The Random index can be configured to suit the trader. This can be done in the settings. To configure the KDJ indicator, you should:
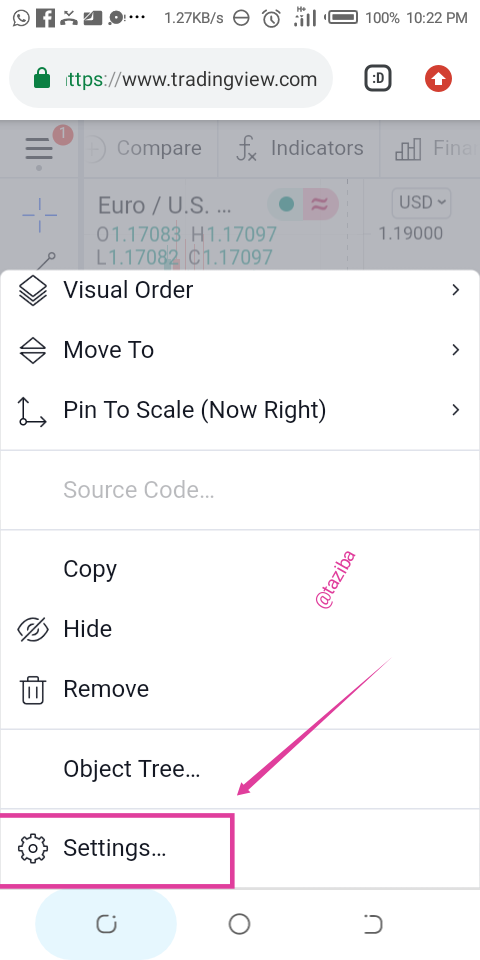
Click on KDJ on the chart
Click on the menu icon and select settings.
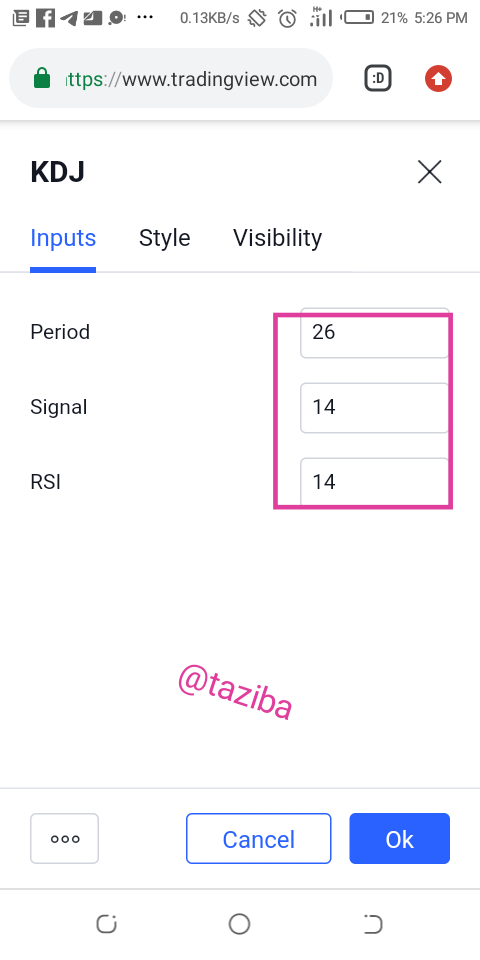
On the next page that comes out, you can set to chart to however you want it. You can choose to go to the input and set the period you want use and also change the style of the indicator.
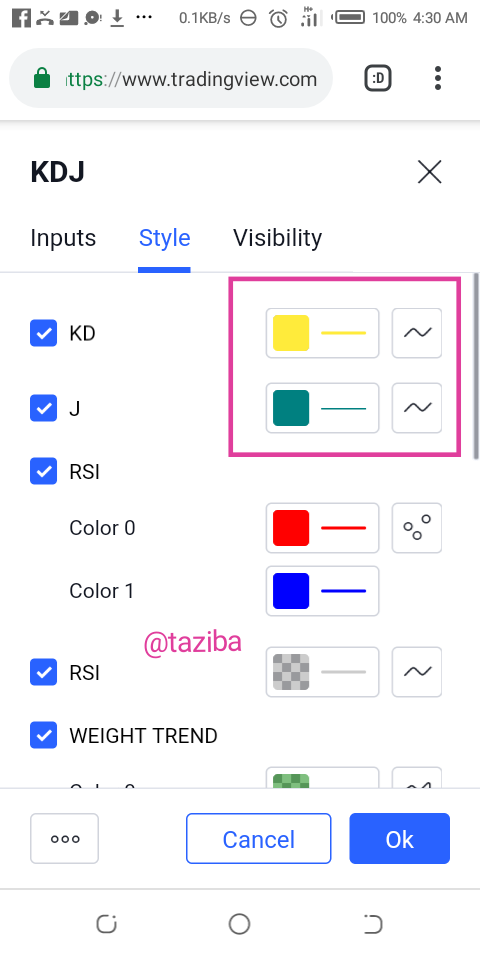
This was the default setting
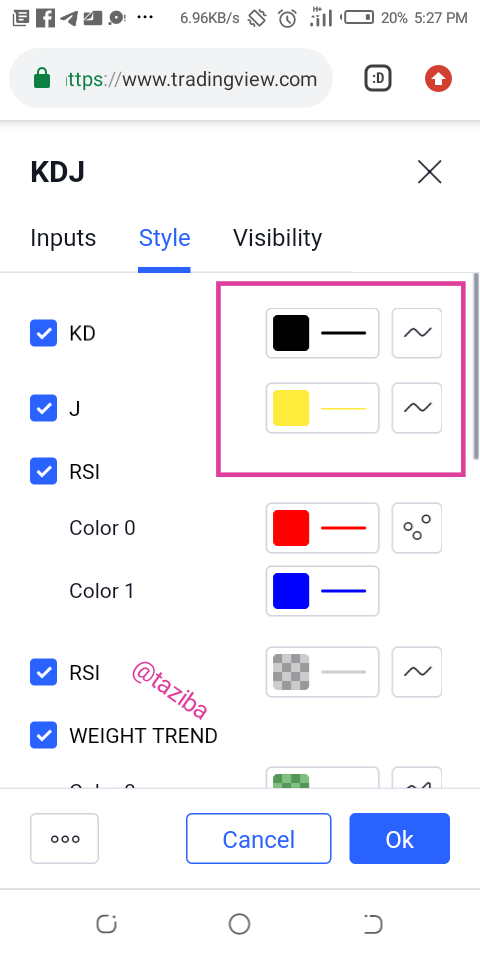
This was how i changed it.
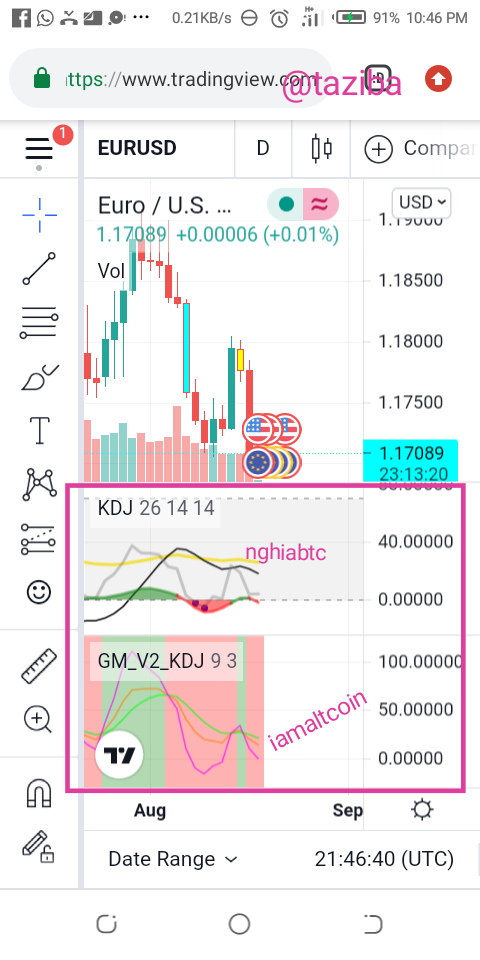
There was a part of the lesson that lead me into performing a sort of observation. Professor @asaj mentioned that indicators made by people with a higher reputation on the platform is always better so I decided to check it out. I applied both KDJ indicators from Nghiabtc(low rep) and iamaltcoin(high rep). It turned out that nghiabtc's indicator was just plain and iamaltcoin's indicator was more helpful as it differentiated between buy and sell zones by colouring the backgrounds.
4.) Differences between KDJ, ADX, and ATR
| KDJ | ADX | ATR |
|---|---|---|
| It combines with ADX & ATR | For proper determination, it can be combined with DMI | It is combined with the moving average indicator |
| It consists of 3 lines(%K %D & %J) | It consists of only 2 lines(DI+ & DI-) | It has only one line. |
| It detects when commodities are overbought or oversold | It focuses majorly on the strength of trends | It is used to determine price movements and also shows a trader the best stop loss point when initiating a trade. |
5.) Use the signals of the random index to buy and sell any two cryptocurrencies. (Screenshot required)
I will be using testnet.binancefuture.com for the trade and TradingView for the analysis.
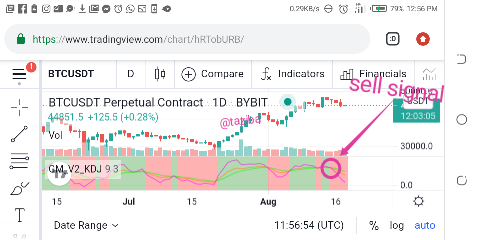
On TradingView, i noticed that on the BTCUSDT chart, the KDJ indicator indicates a sell signal by the way the lines overlap each other. I can now go to my demo account and sell the commodity(bitcoin) against USDT.
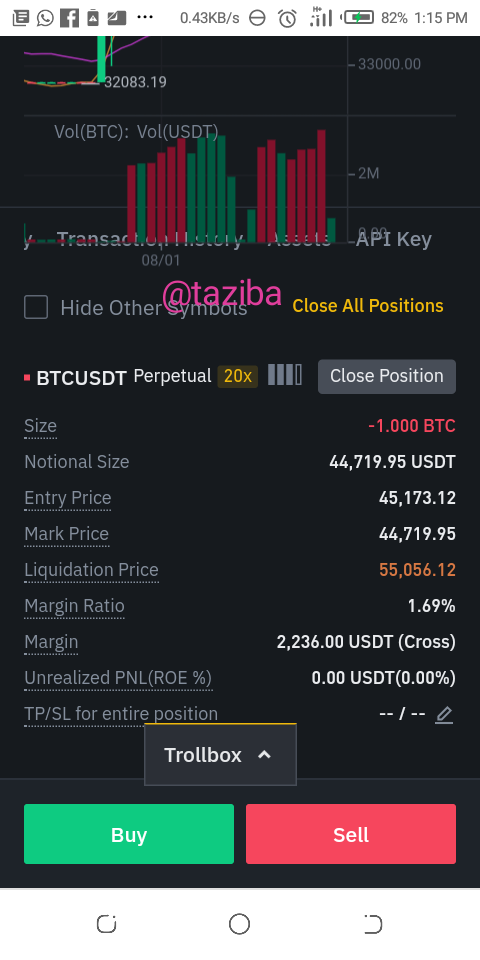
The sell order has been placed.
Conclusion
The KDJ indicator is simply a descendant of the stochastic indicator that has an extra containment which is the %J line. Is it reliable? It comes with some errors from it's predecessor so no, it is not a hundred percent reliable for every trader. Wonderful lesson by @asaj. Thank you and see you next season. I hope you enjoy it.
CC: @asaj
Hi @saarah, thanks for performing the above task the eighth week of Steemit Crypto Academy Season 3. The time and effort put into this work is appreciated. Hence, you have scored 5.5 out of 10. Here are the details:
Remarks
You have demonstrated a good understanding of the topic. You have performed the assigned task excellently. However, your answer to task 5 could have been better if you had analysed two coins with clears charts providing the buy and sell signals as well as a screenshot of your demo account summary.
Hello Professor @asaj,
You are mentioning me in every of your comment. Please, change and replace the username of the person whom you are checking the task.
Thank you for the review prof, but please my username is @taziba