Cryptoacademy season 3 week 6- Homework post for professor @asaj: The Vortex Indicator

Question 1
What is the Vortex Indicator
Just like almost every other indicator, the Vortex Indicator is an analysis tool used to detect bounce-back in trends(reversals) and indicate current trends in the market. It operates with 2 oscillatory lines which indicate either a positive (+VM) or s negative(-VM) trend.
How It Works
By "how it works", I mean the working mechanism by which the Vortex lines are based on. The lines are drawn by calculating the distance between current and previous highs and lows on a trading chart. For the positive (bullish) trend line, it is drawn out by calculating the difference between the current high and the previous low while for the negative(bearish) trend line, it is calculated by calculating the distance between the current low and previous high(vice versa).
How exactly is the VI calculated?
To use this indicator, a lot of calculations need to be carried out. Here are the various steps:
Calculating the upward and downward movements: Like I said in the write up just before this one, the difference between the current and previous highs and lows.
Calculation of period number: Any number of periods can be used for the Vortex indicator but what is commonly used is 14 periods. In calculating the VI, you get the sum of the periods for the number of periods selected. For example, in a 24 day period, the calculations go as follow;
VM24+ = 24 period sum of VM+
VM24- = 24 period sum of VM-Calculating the true range: The True range is simply the maximum of any of the following:
Current High - Previous Low
Current Low - Previous Close
Current High - Previous Close
N/B: True Range must be an absolute value.
Calculate the True Range for the specified period of time: For the 24 day period we're using, it'll be:
TR24= 24-period sum of True RangeCalculate the VI+ and VI-:
VI24+ = VM24+ ÷ TR24
VI24- = VM24- ÷ TR24.
Question 2
Is the Vortex indicator reliable?
In all honesty for me, it actually depends on some factors. Factors like the knowledge of the trader implementing it and period of time being used for calculation. The knowledge of a trader is a factor in the sense that, for example, John is an expert trader and has been trading for about 5 years and when he was learning how to trade, the core indicator used to teach him to determine prices was the Vortex indicator and James, also an expert trader who was taught with the Bollinger bands and moving averages indicator. The Vortex indicator would be more reliable to John than James because he has more of an in depth knowledge of how to use the Vortex indicator than trader James. The other factor is the time period. The reliability of the Vortex indicator depends on this in the sense that the Vortex indicator might not give accurate reading in a compact time frame(e.g 6 days) but would be better with a more distant time frame(e.g 14 or 28 days).
Question 3
Adding a Vortex indicator
The steps in adding a vortex indicator on trading view include:
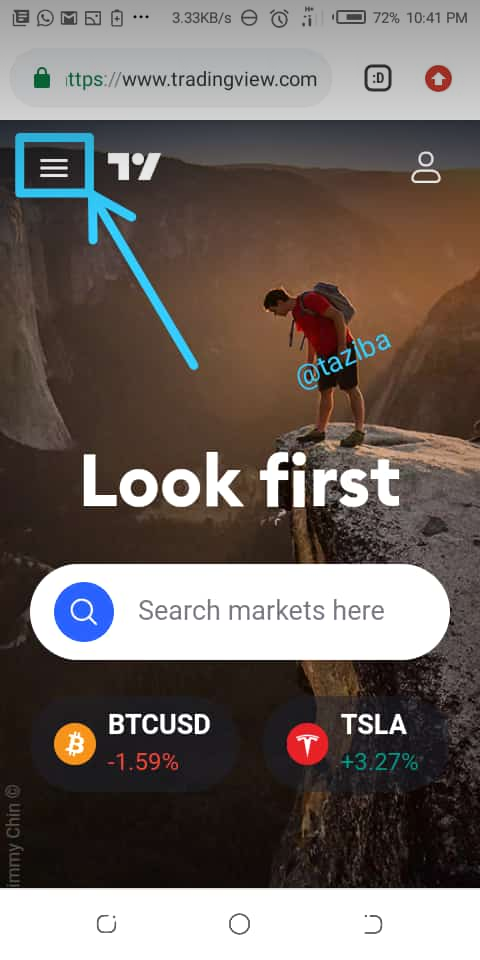
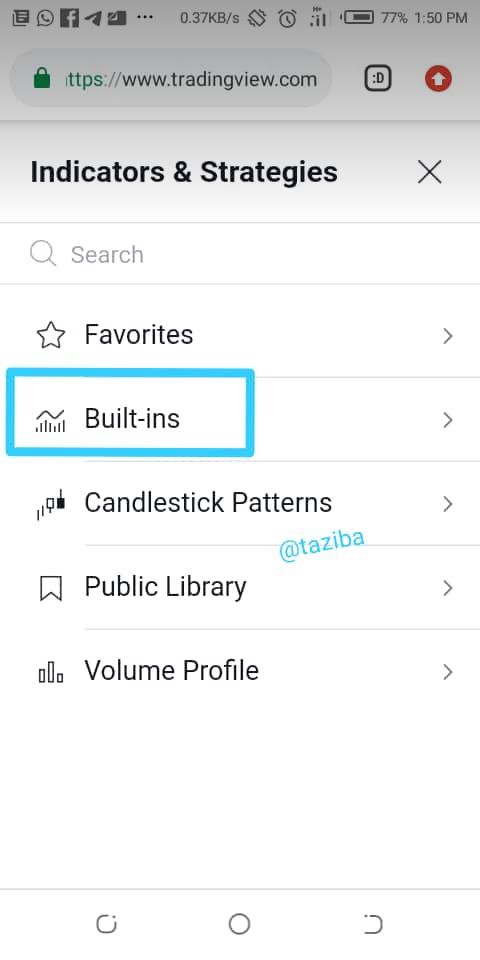
Go to the platform and on the landing page click on the menu button on the top left
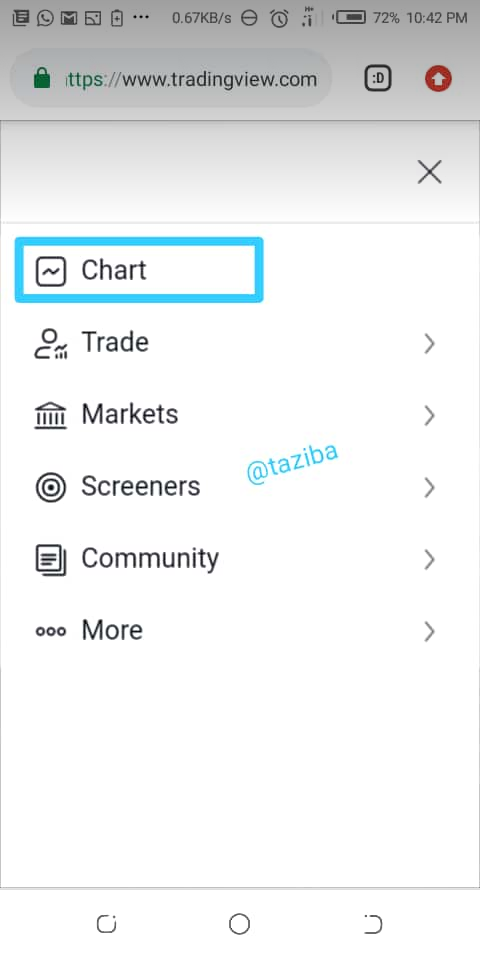
Click on charts
- when the chart comes up, at the top on the menu bar click on the fx indicators icon
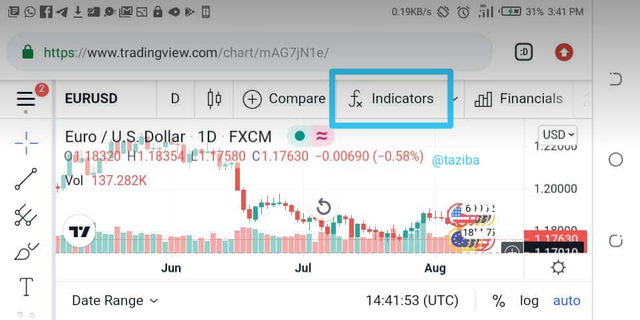
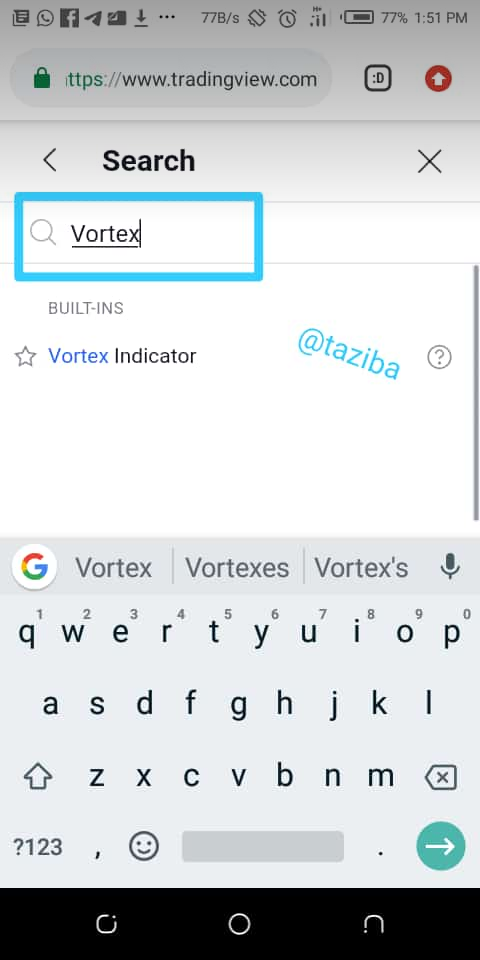
- On the Built-in section, type in vortex and select vortex indicator
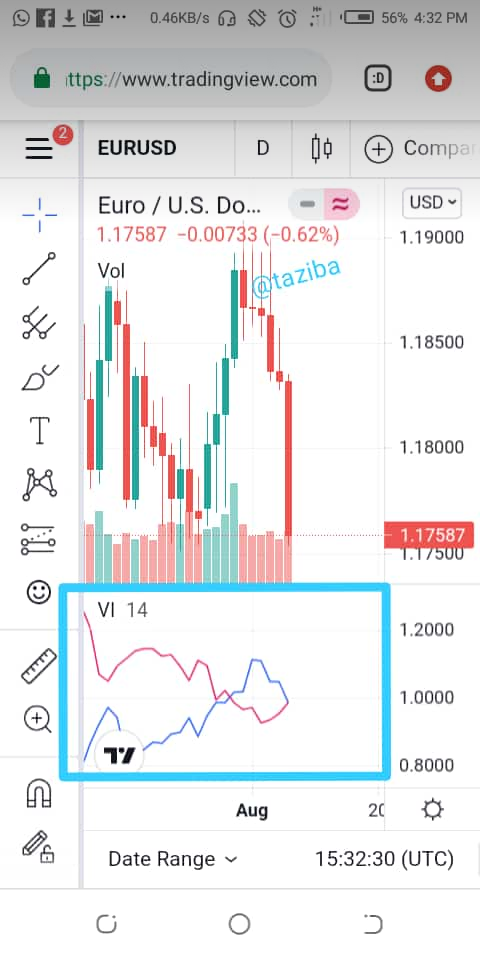
- Go back to the chart, below it is the Vortex indicator
Theparameters needed
To correctly set up the Vortex indicator, one needs to do the following:
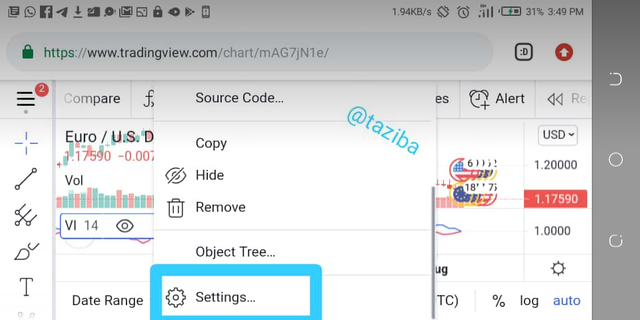
click on VI on the indicator
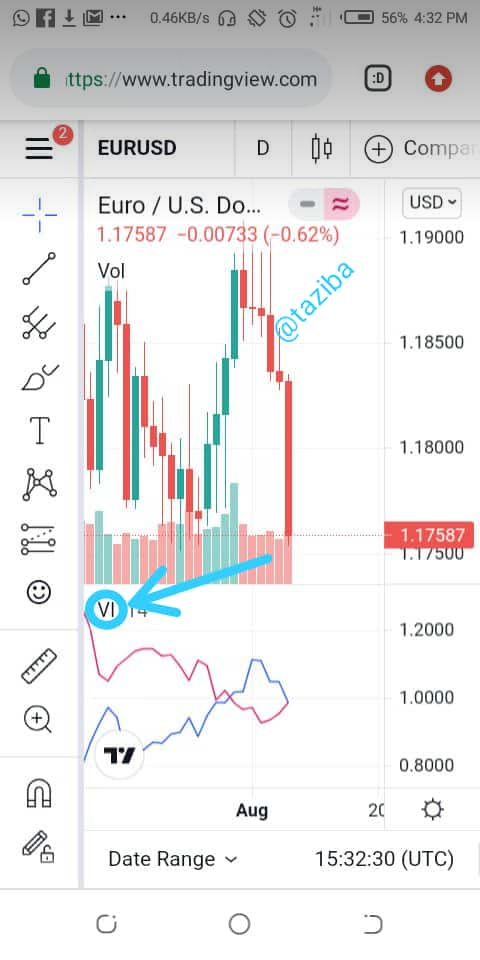
Select more options and go to settings
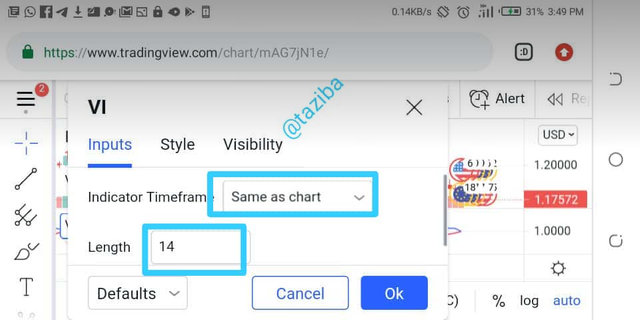
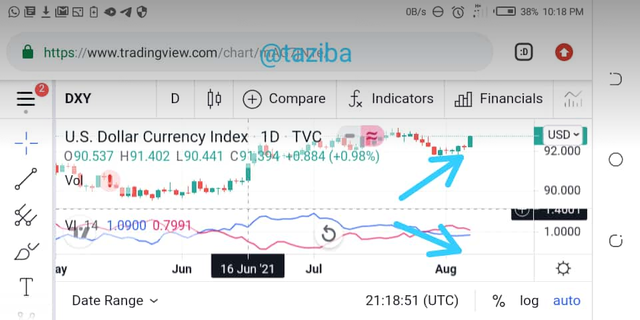
On inputs, set the timeframe to same as chart and the length to whatever you want. Mine is 14.
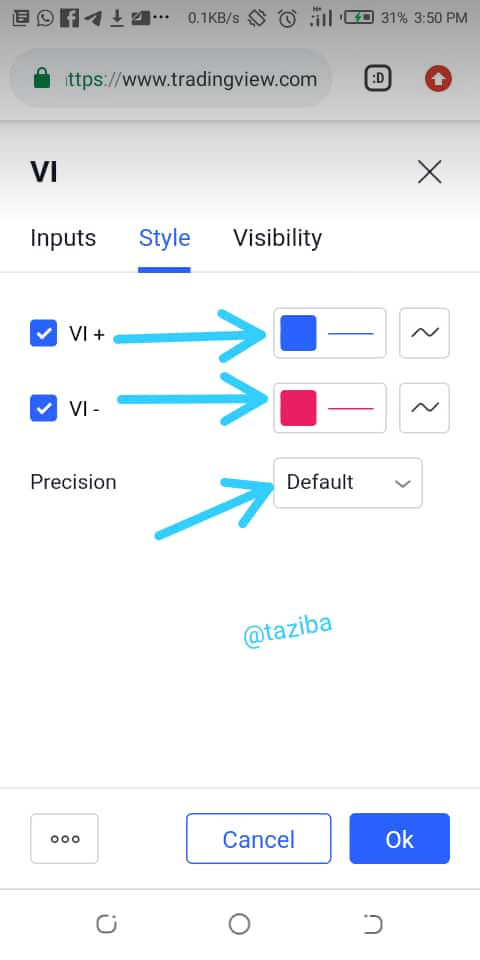
On style make sure the VI+ line is blue and the VI- line is red. Also let the precision be default.
Question 4
What Is Divergence in the Vortex indicator
Divergence in the Vortex indicator is simply when there is a difference in the trend movent in the chart compared to that of the positive trend line(blue) on the Vortex indicator. There are two types of divergence which are both bullish and bearish divergence.
- Bullish divergence: This is when the price chart experiences a lower high while the positive line on the VI experiences a higher high. It is a strong buy signal that indicates a support point on the chart.
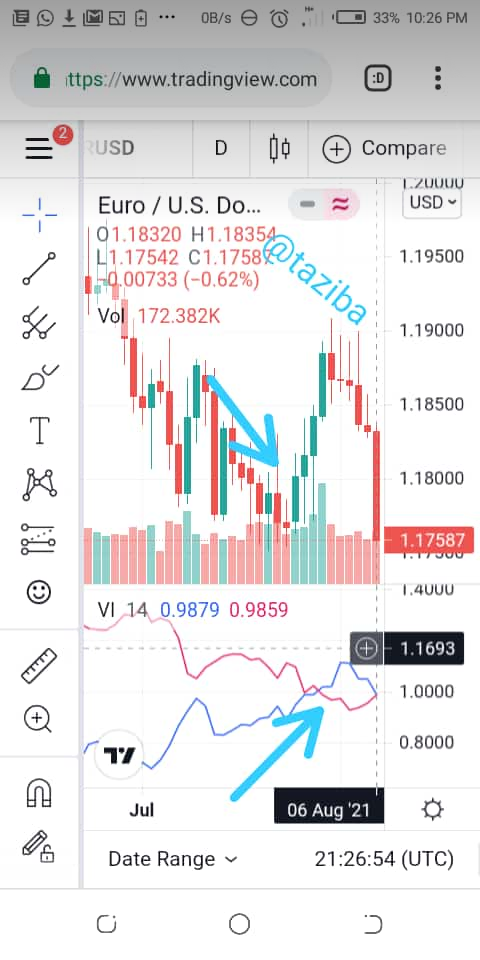
- Bearish Divergence: This is when the trend on the price chart experiences a higher high while the positive line on the VI experiences a power high which indicates a resistance point on the chart. This gives out a strong sell signal.
Conclusion
The Vortex indicator is used to detect support and resistance points on a trading chart as well as current trends through the use of oscillating lines. It doesn't always give accurate readings, especially when used with a small timeframe. It's easy to use and navigate as long as one has the right knowledge about it.
A wonderful lesson by professor @asaj. I hope you enjoy my write up as much as I enjoyed your teaching. Thank you.
CC: @asaj
Hi @taziba, thanks for performing the above task in the sixth week of Steemit Crypto Academy Season 3. The time and effort put into this work is appreciated. Hence, you have scored 5.5 out of 10. Here are the details:
Remarks
You have demonstrated a fair understanding of the topic.