Puria Method Indicative Strategy- Steemit Crypto Academy- S5W4-Homework post for @utsavsaxena11.
Hello all, it's a new week and a new lecture, my warm greetings to the world of steemit, and I hope we are doing great despite all we face through...on the lecture of the week “Puria Method Indicative Strategy” I would be answering the given tasks. Enjoy!

Explain Puria method indicative strategy, what are its main settings. which timeframe is best to set up this trade and why? (Screenshot needed and try to explain in detail)
The puria method is an indicative strategy that consists of two(2) moving average and moving average convergence divergence. This indicator is used intraday trading for making profits in a small amount.
The puria strategy has been in existence for a very long period of time but got popular in 2010, and this is because of its efficiency and simplicity.
The major precept of the puria method strategy is to follow the trend movement. The two moving average helps traders in determining the trend movement, while the MACD helps in sporting the developing wave of an up or downtrend movement.
In other to commence a trade using the puria strategy, we must first add the rightful indicators as mentioned above, after the selection of the assets of interest to trade on.
Meanwhile, I would be commencing the following trade and showing the following images through my trading view app. You can as well trade through the site @ Tradingview.com
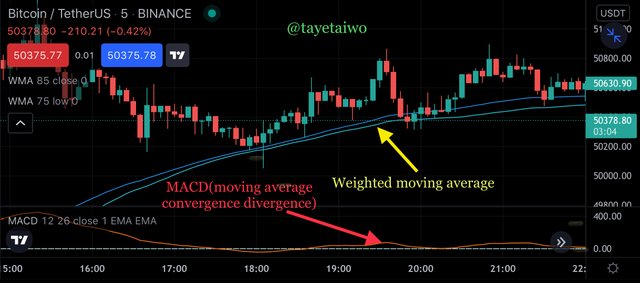
Now that we have applied the puria indicators as shown in the image above, over the asset of interest(I choose BTC/USDT), we would now move over to the settings in other to achieve a complete setup of the analysis for a small but profitable trade.
There are required setups needed to carry out the puria method indicator using the three indicators mentioned earlier.
MOVING AVERAGE WEIGHTED (WMA):
This is one of the indicators used in the puria strategy, which works as a resistance and support to the price chart.
Since we are trading using the WMA indicator, search for moving average weighted in your trading app and then select and apply two WMA on the chart.
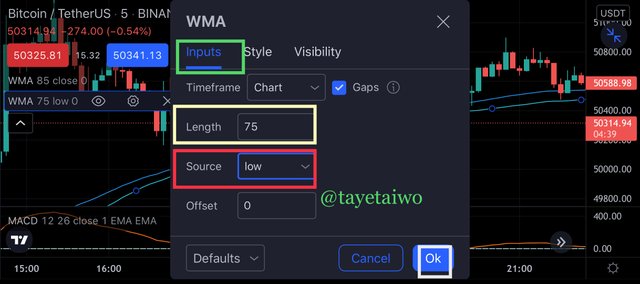
After the application of the two WMA, under Input in the indicator settings (labeled with a green marker), the first indicator is set at a 75-period length and the source at LOW.
The time chosen for this indicator is the same as the chart's timeframe. Let's look at the image below to explain vividly what I'm talking about.
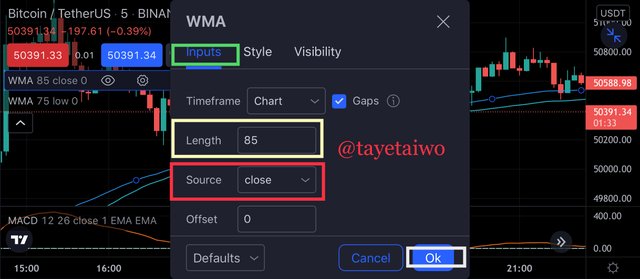
For the second WMA which also works as the support and resistance to the price chart is set at 85-length period with source at close, under input in the indicator settings. Let's look at the image below.
MACD:
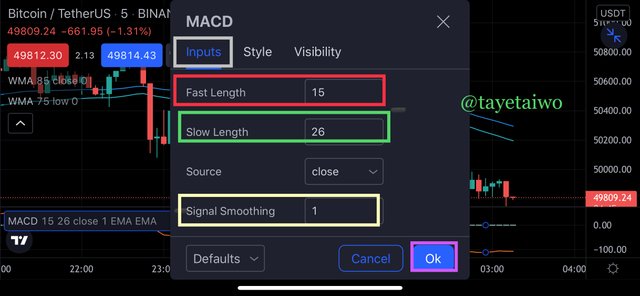
Moving average divergence convergence indicator is used in filtering out wrong signals that are liable to occur and also price entry and exit point. Just the same procedure in applying the MACD indicator, but here, there are 3 changes to be made. Search on MACD on your trading app and apply it to the chart.
Under Input in the indicator settings, set fast-length at 15, slow-length at 26, and the signal smoothing at 1.
Observation would tell you that, after the alteration of the signal smoothing which we changed from 9 to 1, the candlesticks at the MACD indicator vanishes, depicting only the zero line.
The perfect time trade for the puria indicative strategy is a five(5) minutes chart because the puria method is an intraday trading method and for a short period.
Traders can as well choose a time frame of 1 hour if they wish to. But given the fact that profits made from this kind of trading strategy are small profits, it is best advised to use a 5minutes trade chart in other to view and observe the market at its recent exchanges (buying and selling).
A five(5) minutes trade depicts that each bar (candlestick bar) has a total of 5 minutes to make a complete bar (open and close) before the formation of a new bar.
So, placing a trade using a 5minutes time frame depicts fast and short term trading unlike when a trader uses a day chart or more, this is usually for swing traders.
So given the point that the puria indicative strategy is intraday trading, it is best advised to use a five(5) min trading chart.

How to identify trends in the market using the puria method. Is it possible to identify trend reversal in the market by using this strategy? Give examples to support your article and explain them. (screenshot needed)
Just like I explained in my previous question on the indicator that makes up the puria strategy, the moving average convergence divergence (MACD) is an indicator that detects the reversal in price trend, depicting the next price trend movement either to an up or downtrend, which also serves as a signal filter in the puria Strategy.
The MACD is a thin line that runs through in a forward right direction on the chart like the movement of a wave, fluctuating in an up and down direction on the range of (-n) to (+n).
n = numbers varying from negative to positive figures.
These numbers could be negative or positive. But the main number used in the indicator to determine price trend is 0.00.
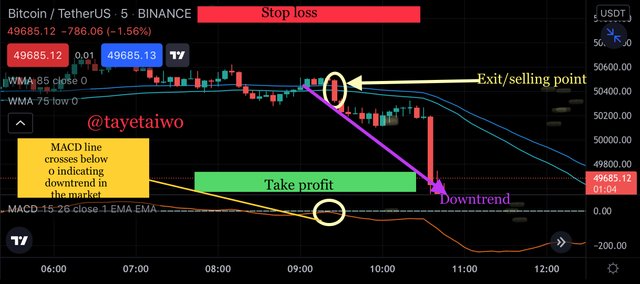
When the MACD crosses above the thin line(vanished candlestick bars) which is equivalent to 0.00, using this method and settings, it means a trend reversal to the upward direction. If it crosses below 0.00, it means a reversal in trend to the downward direction.
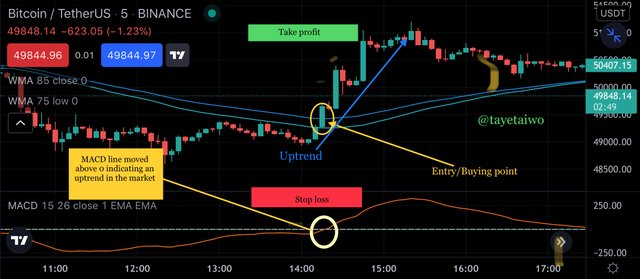
The two WMA which is shown as a fluctuating line following the price trend is used as an indicator to enter or exit the market because it serves as a support and resistance to the price trend.
As we can see on the image above, the two lines following the price chart which are the WMA 85-length period and 75-length period indicator respectively is used in marking the entry point and exit point following the puria strategy.
ENTRY POINT:
This is the point where a trader enters the market to either buy or sell an asset after a well-observed and arranged strategy with the use of various indicators of choice of a trader in other to ascertain a profitable trade or a less-loss trade in case of a false signal or trade divergence.
The entry point using the puria strategy is shown with the two(2) WMA at the point where the candlestick bar break above or below the WMA line in the case of buying and selling respectively, after the MACD must have indicated the next price trend movement.
EXIT POINT:
The exit point is the point at which the trader decides to close the position of the trade after making profits.
Traders usually sell their assets in other to exit their investment, so the point at which the trader sells the asset is regarded as the exit point.
The exit point can be automated with the use of stop-loss and take-profit which can be set on the chart, using the chart trading settings before commencing trade.
As the name implies, this means to sell an asset while buying a long-term asset.

In the puria strategy, we are using MACD as a signal filter, By confirming signals from it we enter the market. Can we use a signal filter other than MACD in the market for this strategy? Choose one filter(any Indicator having 0 levels) and Identify the trades in the market. (Screenshot needed).
I would go straight to the point in other to cover up important things, here we are asked to sort of improvise The MACD with another 0 level indicator Which could serve as a filter to the trade.
I would be making use of the momentum indicator which I would precisely use the stochastic oscillator as a signal filter to my chart and as well as a trend reversal dictator.
STOCHASTIC OSCILLATOR:
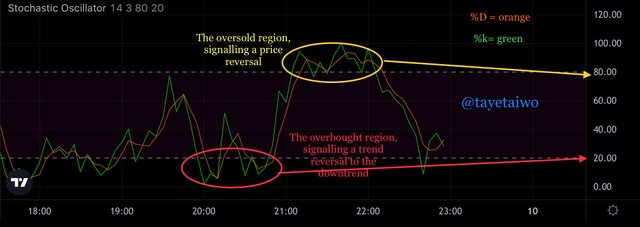
The stoch oscillator is a moment that consists of two lines, one of each line is the %k, while the other line is the %D.
The stochastic oscillator is used in determining the next trend reversal, which is kinda similar to the MACD.
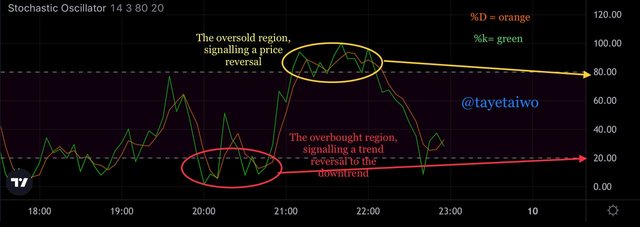
When the stochastic oscillator gets to the overbought region which is the top area of the stoch indicator equivalent to 80.00 (the stochastic number which depicts when the price is at the overbought region), it signals a reversal in trend at the price charts movement towards the downtrend.
Aside from getting a signal using the oversold and overbought regions, the stochastic oscillator consists of two lines with different values, that depicts different meaning.
When the %D line is above the %k line at the overbought region, this signals a reversal in the trend towards the downtrend.
When the stochastic oscillator gets to the oversold region which is depicted on the line number 20.00, it signals a reversal in price movement to the upward direction.
This also can be seen when the %k line crosses above the %D line at the oversold region, this signals an uptrend movement which is a result of reversal in the initial trend.
The stochastic oscillator indicator
Entering the trade using the stochastic oscillator with the puria strategy, excluding the MACD which was substituted for the stochastic oscillator, is done by carefully reading the lines above each other (%k and %D) and also by dictating the price trend movement from careful observation of stochastic oscillator zone, either at 80.00 which is the overbought region or at 20.00 which is the oversold region.
And all this must be ascertained and set before commencing trade using this strategy. Let us look at the following trade shown below as an instance of how to apply and read the stochastic oscillator.
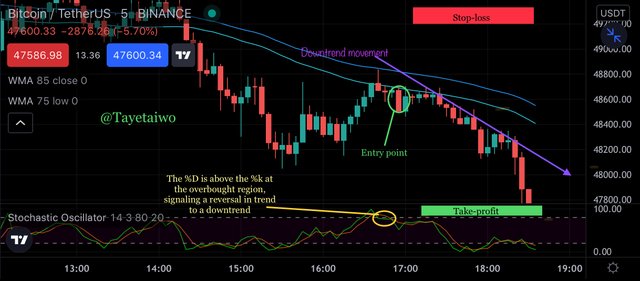
As we can see on the image above, the %D is above the %k at the oversold region which signals a reversal in trend to the opposite direction, we can also see the point of entry on the trade. This is the point traders sell the market after careful settings and strategies.
Traders are also advised to back up their trading with take-profit and stop-loss settings in other to exit the market with some profits when the price reaches the take profit or leave/exit the market with some losses when the price hits the stop-loss respectively.
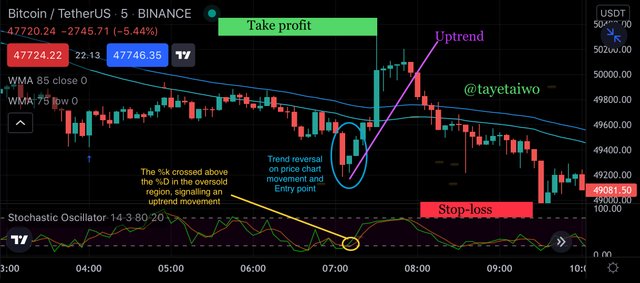
This is the opposite of the previous chart shown above, when the %k is above the %D at the oversold region, it signals a buying time for traders, because of the trend reversal to the opposite direction.
The entry point is labeled on the price chart movement, which shows the point of market entrance to the trade.
Then the take profit and stop-loss, in other to maximize potential gain and minimize losses respectively.

Set up 10 demo Trades (5 buying and 5 selling ) on 5 cryptocurrency pairs using puria method indicative strategy. Explain any 2 of them in detail. Prepare a final observation table having all your P/L records in these 5 trades.

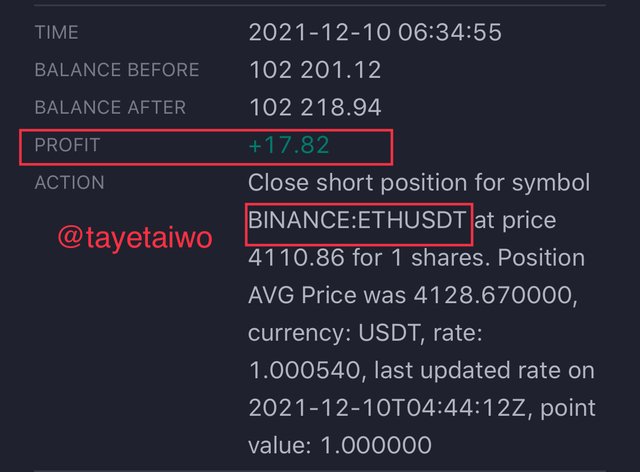

In other to explain two of the trades I would be selecting two(2) of the ten(10) trades uploaded above, for the buying section, I would be explaining the ETH/USDT trade.
Before I carried out the trade, I decided to trade on ETH/USDT, which I opened the chart for it and applied to other settings. Since we are practicing with the Puria strategy indicator, I selected the three(3) indicators that make up the Puria strategy, which are the two(2) Moving average weighted (WMA) and the MACD indicator.
Firstly, I altered the settings on the two WMA indicators modifying their *length-period to 85, close And 75, low respectively. I changed the settings on my MACD indicator; fast length at 15, slow length at 26, then the signal smoothing to 1.
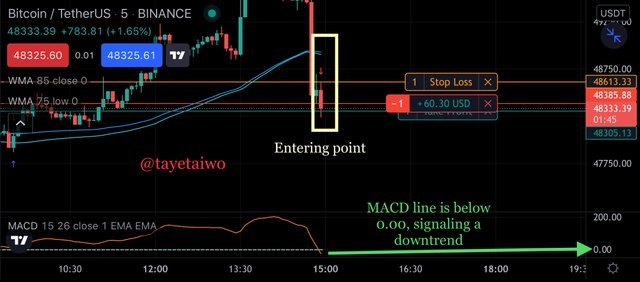
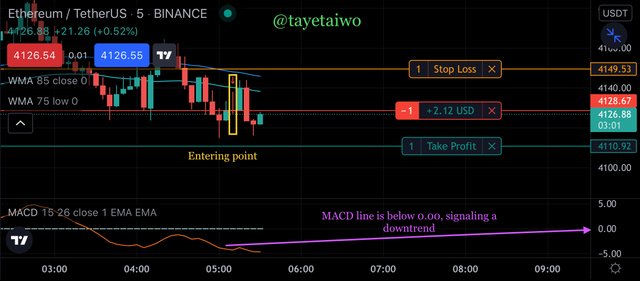
I made sure that the MACD indicator is below 0.00.
After this, I observed and waited for the price to break out, below the moving average indicator, which it did, then I entered the trade at 4128.67, setting my stop-loss at 4149.53, and my take profit at 4110.92.
With these settings I have believed that, if the trade should go in my Favour according to the settings and markings it’s would be a profitable one, but if it should go against my plans and settings, I would have some losses but in a minimal level.
After the calculated risk and all in the trading, my trade went as planned with a profit of $17.82.

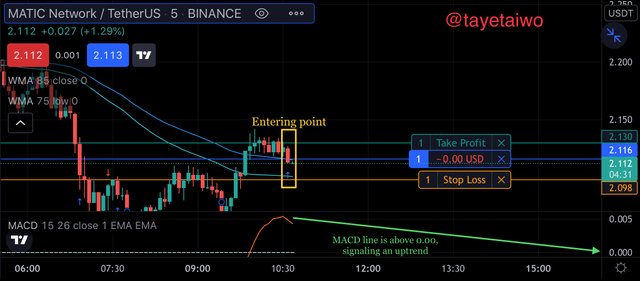
This is the opposite of the previous explanation since they are of the same currency but with different positions in the market.
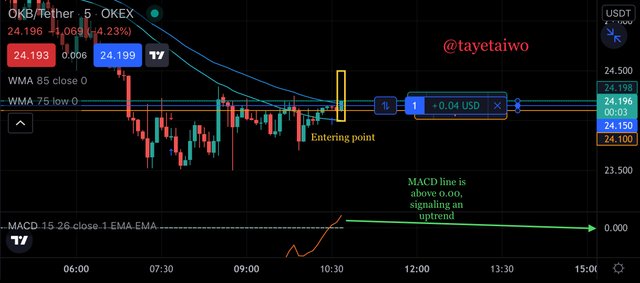
After applying my settings just like I did in my previous explanation, I made sure my MACD line is above 0.00, then I waited for the candlestick bar to break through, above the moving average. This is why I said it is the opposite of the previous explanation.
Though entering the trade very late, it was still a successful one, as you can see I indicated the candlestick bar at which I would have entered the trade.
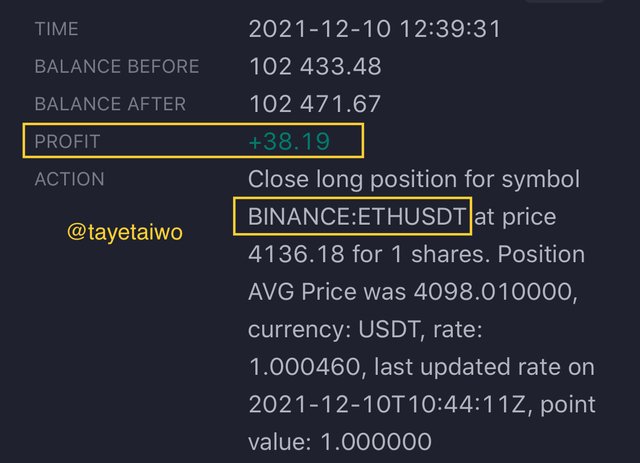
So, I entered the trade at 4098.01, setting my stop-loss and profit to 4060.76 and 4135.51 respectively.
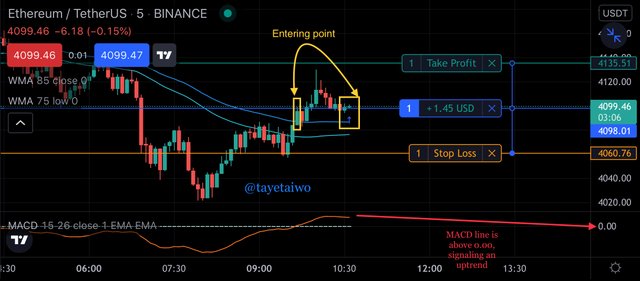
I successfully, as I said earlier, made a profit of $38.91, exiting the trade.

| S/N | PAIR | BUYING PRICE | SELLING PRICE | PROFIT | LOSS | TF |
|---|---|---|---|---|---|---|
| 1 | ETH/USDT | Null | $4126.88 | $17.82 | Null | 5min |
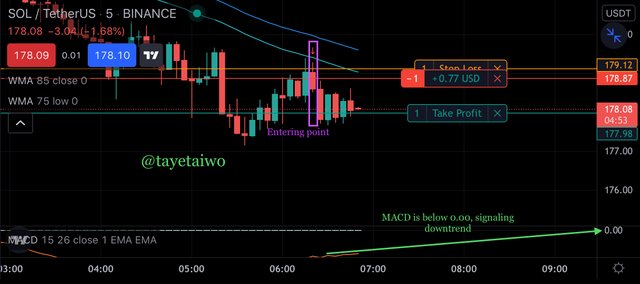
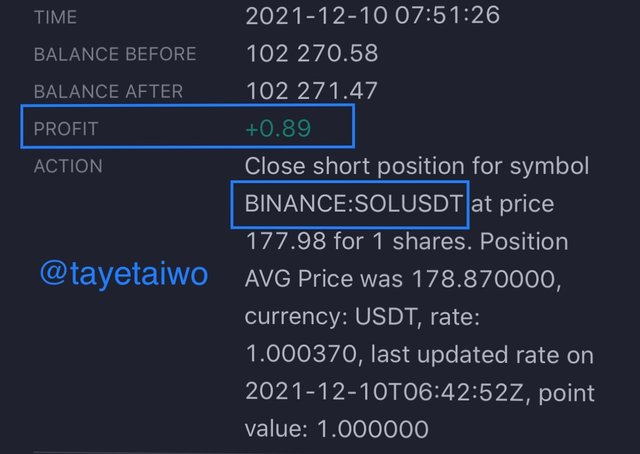
| 2 | SOL/USDT | Null | $178.87 | $0.89 | Null | 5min |
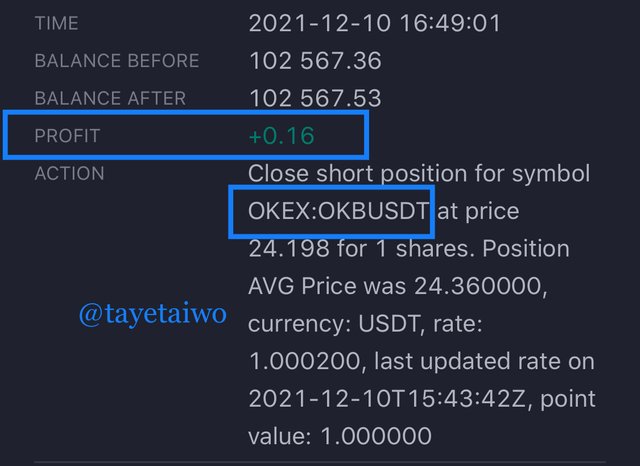
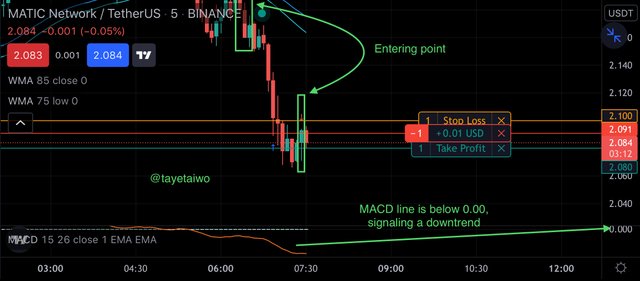
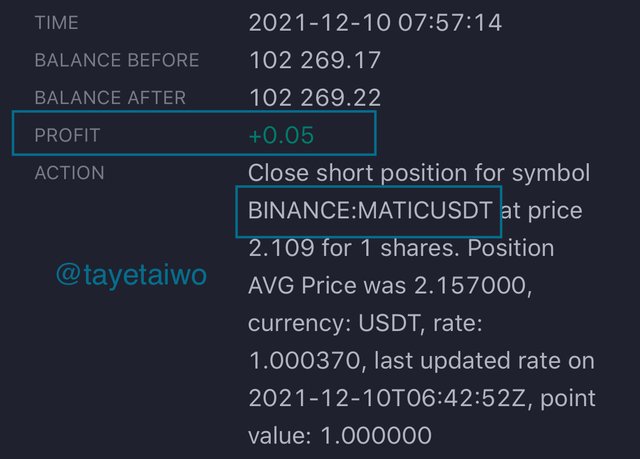
| 3 | MATIC/USDT | Null | $2.091 | $0.05 | Null | 5min |
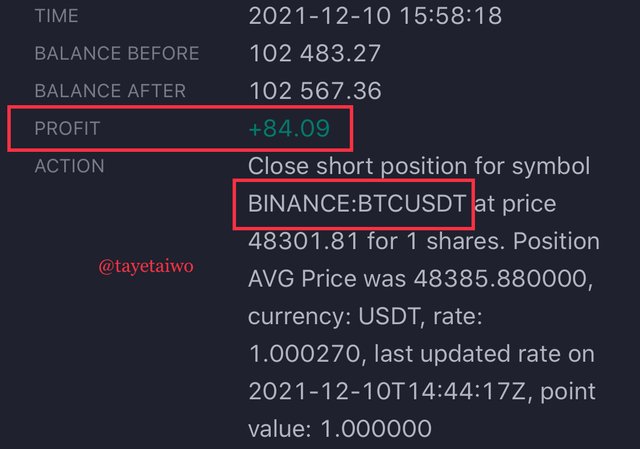
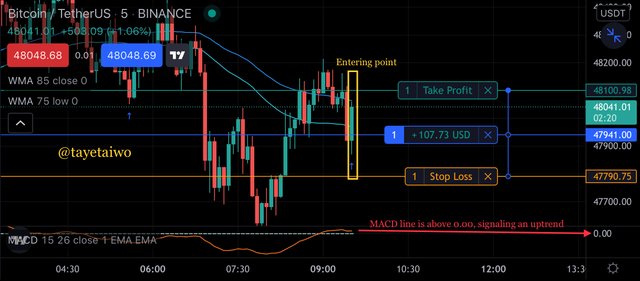
| 4 | BTC/USDT | Null | $48385.88 | $84.09 | Null | 5min |
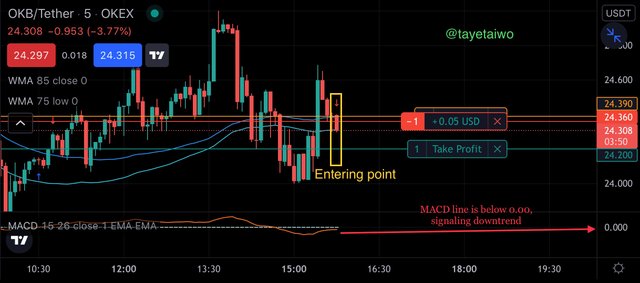
| 5 | OKB/USDT | Null | $24.360 | $0.16 | Null | 5min |
| 6 | ETH/USDT | $4098.01 | Null | $38.19 | Null | 5min |
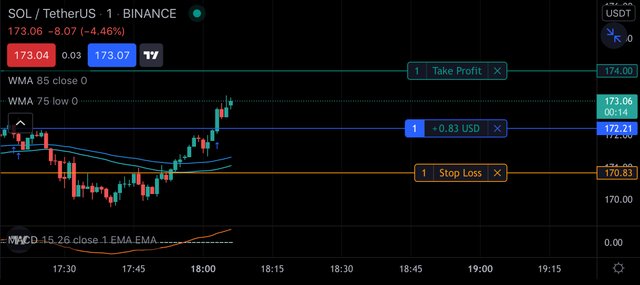
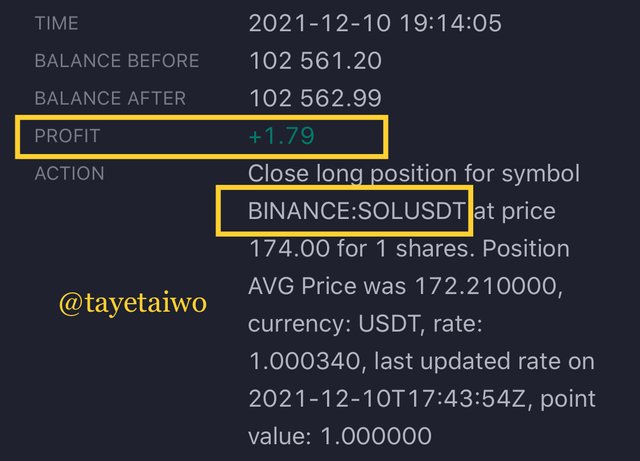
| 7 | SOL/USDT | $172.21 | Null | $1.79 | Null | 1min |
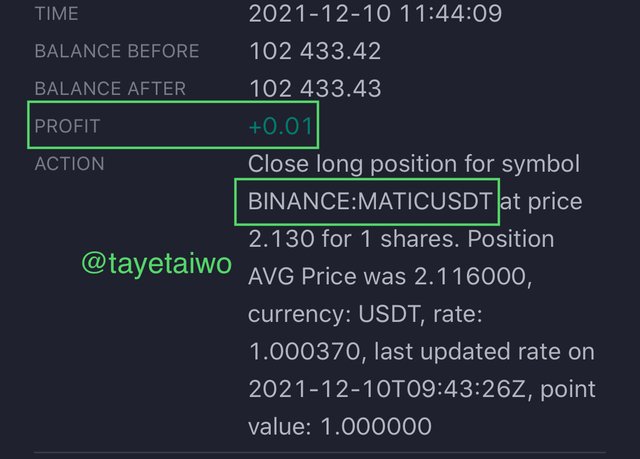
| 8 | MATIC/USDT | $2.116 | Null | $0.01 | Null | 5min |
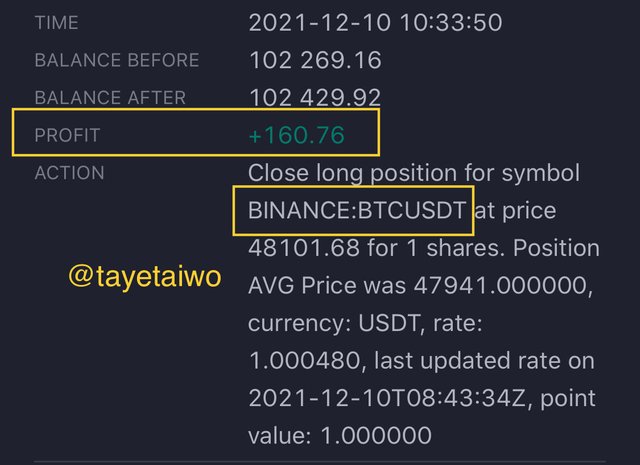
| 9 | BTC/USDT | $47941.00 | Null | $160.76 | Null | 5min |
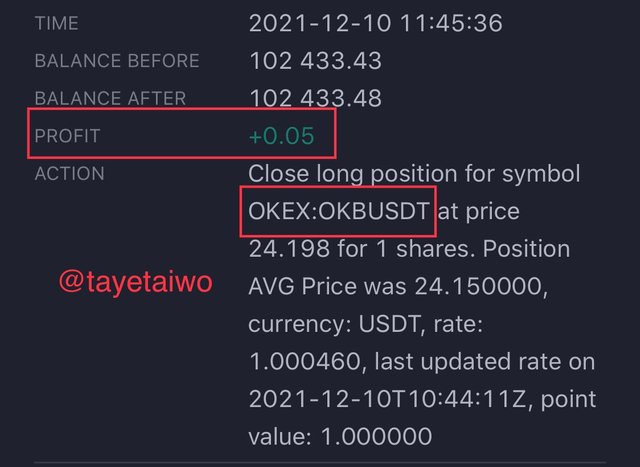
| 10 | OKB/USDT | $24.150 | Null | $0.05 | Null | 5min |

You have to make a strategy of your own, it could be pattern-based or indicator-based. Please note that the strategy you make must use the above information. Explain full strategy including a time frame, settings, entry exit levels, risk managment and place two demo trades, one for buying and the other for selling.
Giving this opportunity to develop a strategy of interest, I would choose to use an indicator-based strategy which I would call the Lascel strategy.
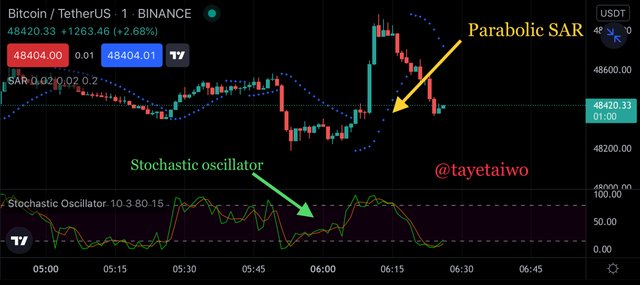
This indicator comprises of two different indicators which we have a moment indicator and a stop and reverse system. The momentum indicator here is the stochastic oscillator while the SAR system is the parabolic SAR, the SAR stands for the word “stop and reverse”.
This two technical indicators have their various functions and can be used in our day to day trading if studied and mastered well.
In other to apply the lascel strategy, we must learn to understand the functions of this indicators that makes up the strategy.
PARABOLIC SAR:
The parabolic sar was developed by a man named J. Welles Wilder For the purpose of determining the direction of an asset in the market. This indicator was made in other to determine the reversal in price pattern of an asset.
The parabolic SAR is a good technical indicator which is used in determining the Next trend of an asset in the market.
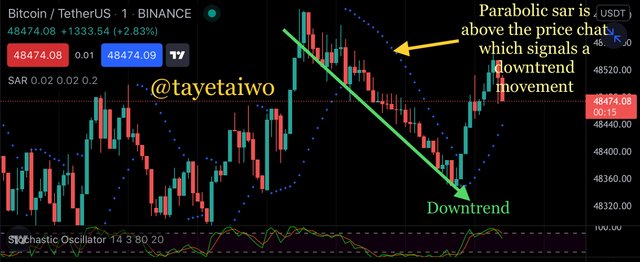
The display as series of dots when applied on a chart. When ever this series of dots are below the current price, it depicts a bullish trend (Uptrend), and when it appears to be above the current price, it signals a bearish trend (downtrend). Now that we have understood how the parabolic sar works, I would love to show the settings which are required to apply the indicator.
SETTINGS:
Parabolic SAR indicator makes use of the highest price, the lowest price and acceleration factor in other to determine the position at where the SAR indicator would be.
For the uptrend SAR we would have;
Prior SAR - prior acceleration factor (AF) Which is equal to prior EP - prior SAR
For the downtrend SAR we would have;
Prior SAR - prior AF, which is equal to prior SAR - prior EP
The EP determines the highest point reached by a price in an uptrend or the lowest price that was achieved during a downtrend. The EP is the extreme point in a trend.
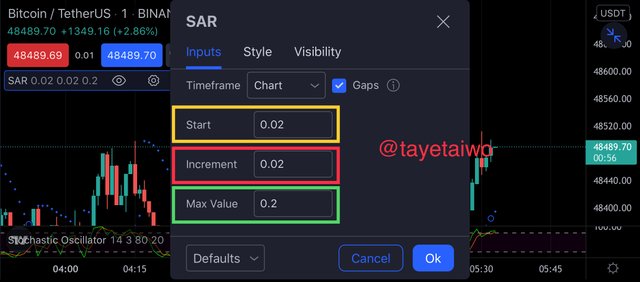
The AF which is the acceleration factor is initially at 0.02, and it is increased by 0.02 at the time of recording the EP, with the max of 0.20.
Although these acceleration factors can be adjusted according to traders choice and pattern of trade. This dots above are due to the results created from the above calculations, which is plotted against the price action of an asset, above or below the price action, which helps in the determination of the direction of the price.
STOCHASTIC OSCILLATOR:
The stochastic oscillator is a momentum indicator that consists of a double line that entangles each other while depicting a downtrend or uptrend movement.
They are calculated as %K and %D, whereby when %k crosses below %D it signals a don't tend movement, and when the %K crosses above %D it signals an uptrend movement.
The stochastic oscillator is used in the calculation of price at the overbought and oversold region which indirectly is used to determine the next price trend movement.
When the stochastic oscillator is at the overbought region it depicts a fall in price, signaling a downtrend movement. Also, when the stochastic oscillator is at the oversold region it signals an uptrend movement next.
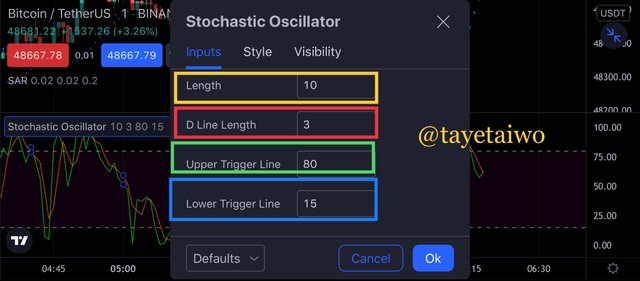
SETTINGS:
The settings adjusted in the stochastic oscillator was the upper trigger length which I put at 80, and the lower trigger length which I put at 15.
The adjusted settings were to expand the line at which the indicator signals the overbought and oversold region, and this helps me in filtering out false signals.
As we have understood fully the Lascel strategy we would apply them practically in other to commence trade, but before this what must we do first, we would first apply the two indicators on the chart of any asset of our choice, the adjust the following settings just as instructed above, then we monitor the trade observing point of entrance and exit.
ENTRY/EXIT POINT:
This is the point at which the trader enters a trade, either to buy or sell an asset. Here, I would be showing the perfect entry point using the lascel strategy and as well as the exit point.
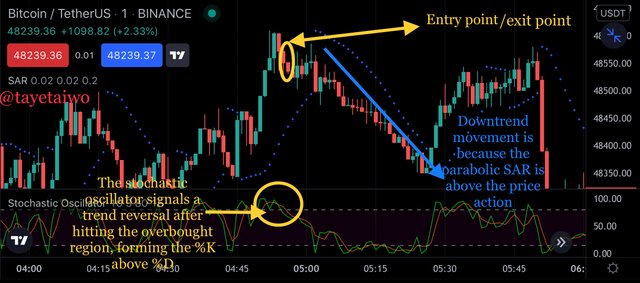
Explanation of the image above, we would notice that at the stochastic oscillator indicator, at the circled area, the %K which is depicted by the green line formed below the orange line which we call the %D, signaling a downtrend movement in price action.
It confirmed the selling/exit signal from the parabolic SAR after the parabolic SAR formed the initial dots above the price action, signaling also a bearish trend.
TIMEFRAME:
In terms of time frame for a chart, it is dependent on the trader and the method in which the trade. For the lascel strategy, the perfect timeframes can be as follows; 5minutes, 15, 30, 45, up until an hour time frame. This time frame is mainly for scalpers who trade on a short-term basis in other to ascertain profits within a short time.
RISK MANAGEMENT:
The risk management comes with it's own settings in other to reduce and minimize the rate of loss accumulated in a trade. We use the stop-loss and take profit in other to manage the risk in the market by making use of the stop-loss to take profit ratio at 1:1, 1:2, 2:4, 3:6 respectively.
This is so in other to minimize the rate of loss in case the trade goes in the opposite direction of what we planned and also the maximize the rate of profit in case the trade goes in favor to the plan.
Since it is a demo trade, the main aim is to understand the concept of the Lascel strategy and make profit out of it.
I would be showing an example with BTC/USDT trade before entering into the main trade I placed on ETH/USDT chart. As I said earlier, the main concept is to understand how this strategy works.
Before entering the trade, I made some observations after applying my indicators in other to determine a perfect entrance
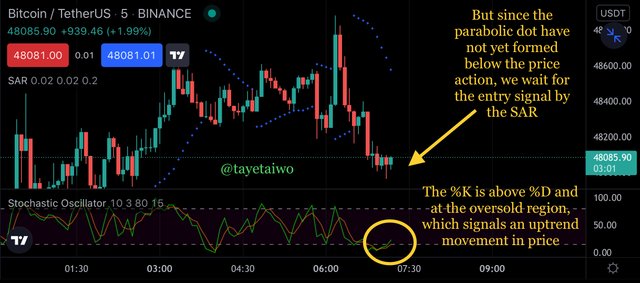
Using the BTC/USDT chart as an instance to the observations made, I waited for the formation of the parabolic SAR below the price chart in other to buy the asset after the momentum indicator below signaled a bullish trend.
ETH/USDT
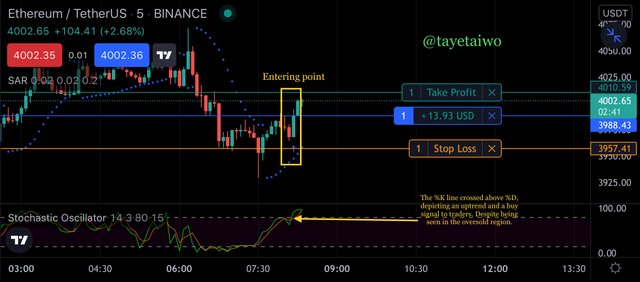
I entered the trade at 3988.43 with applied risk management, setting my stop-loss at 3957.41 and my take profit at 4010.59.
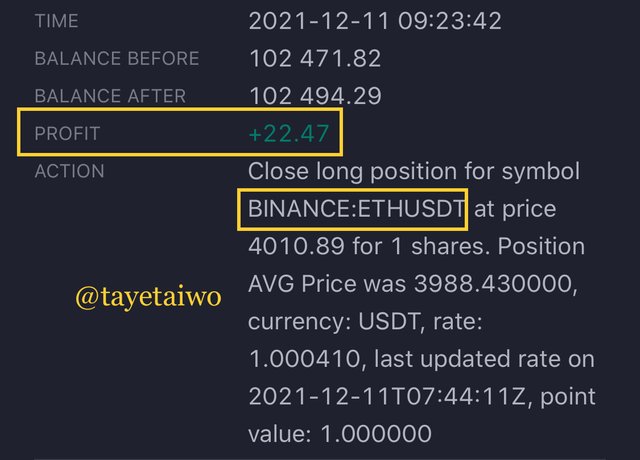
After the usual ups and down in a trade, I made a successful trade which yielded $22.47
After I applied the lascel indicator with its complete settings, I waited for the signal from both indicators in other to Exit the market.
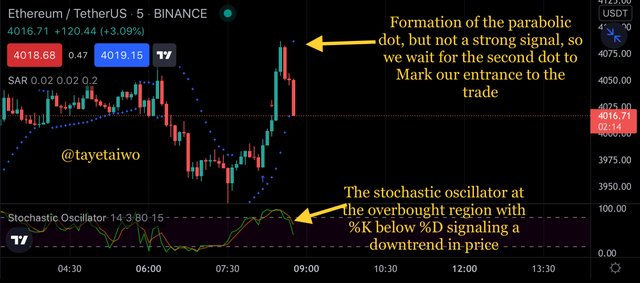
After being signaled by the stochastic oscillator to sell because of the %K crossed below %D, and that the price was at the oversold region, I waited for a stronger signal from the parabolic SAR in other to exit the trade.
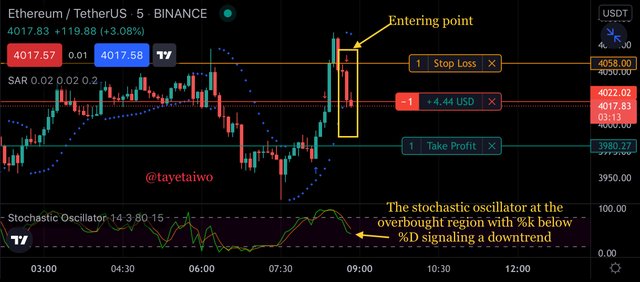
After the formation of the second dot by the parabolic SAR, I exited the trade at 4022.02, placing my stop-loss at 4058.00 and my take profit at 3980.27.
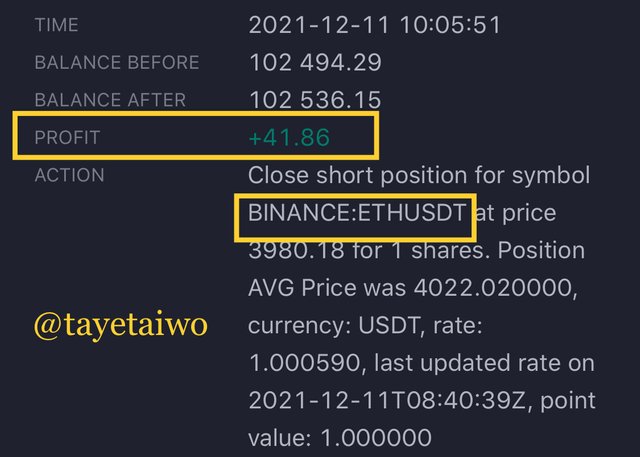
Was a profitable trade because it went successful with a profit of $41.86.

One can create a strategy suitable for their style and method of trading, we all as humans vary, starting from how we live our lives to how we see things and also, to how comfortable we can be on a particular thing at a particular time.
This affects us in our trading world as well, which leads to the different kinds of traders; scalpers and swingers. So, our method, pattern, and strategy in trading would vary as well.
The puria strategy being discovered by someone who has the love for scalping (short-term trader) is a great and unique strategy for determining price trends with the use of the two moving average weighted indicators and MACD.
As we can see, through observations in this post, with the use of the puria indicator and the lascel indicator there was no loss recorded in any of the trades using this strategies, this was due to the careful, patient and calculative methods used in the above strategies in the trades.
Thanks to our prestigious professor @utsavsaxena11 for this wonderful course
CC: