Metric Indicators - Steemit Crypto Academy - S5W2 - Homework post for professor @ pelon53
Greetings, it is a pleasure to be a student of this lecture on metric indicator, I will be answering the following questions.

Indicate the current value of the Puell Multiple Indicator of Bitcoin. Perform a technical analysis of the LTC using the Puell Multiple, show screenshots, and indicate possible market entries and exits
- PUELL MULTIPLE INDICATOR :
Puell multiple market metric is for the estimation of the degree of sell pressure coming from miners in the market.
Historically, the income from mining comprises block assistance primarily, which is awarded to miners for discovering a block.
The values of this contribution change daily as we observe the changes in bitcoin price. These values are measured in USD.
Understanding more on what puell multiple is all about, I would love to show the current value of the puell Indicator of Bitcoin
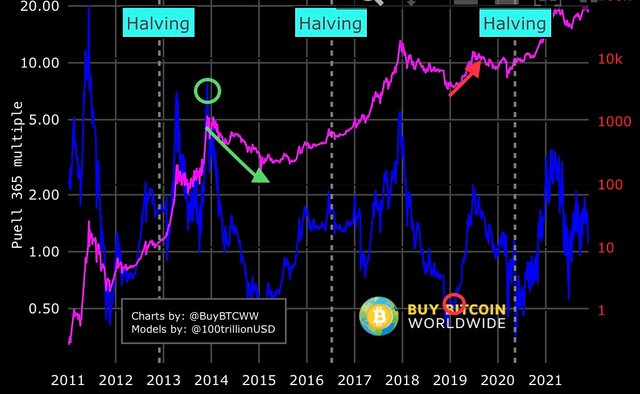
At the puell 365 multiple region, the following numbers depict the undervalued and overvalued region of Bitcoin.
Now, the undervalued region consists of (0.50 - 1.00), and the overvalued region consist of (5.00 - 20.00). At this point, it is good to know that when the puell multiple gets overvalued, the region means high profitability for miners and as well a possible sell signal to investors. (puell multiple is the purple color of the trend)
And when the puell multiple gets to undervalued, the region means low profitability for miners and as well a possible buy signal to investors.
As of 2013-11-29, the puell multiple was at 7.41 (green circle) with the price of bitcoin at $1148, which later declined (downtrend) to $165.07 in 2015-01-14.
The second notification on the chat was on 2018-11-26 where the puell multiple was at 0.44 (red circle) with the price of $3,784.58 which later went up (uptrend) to $11,248 on 2019-07-06.
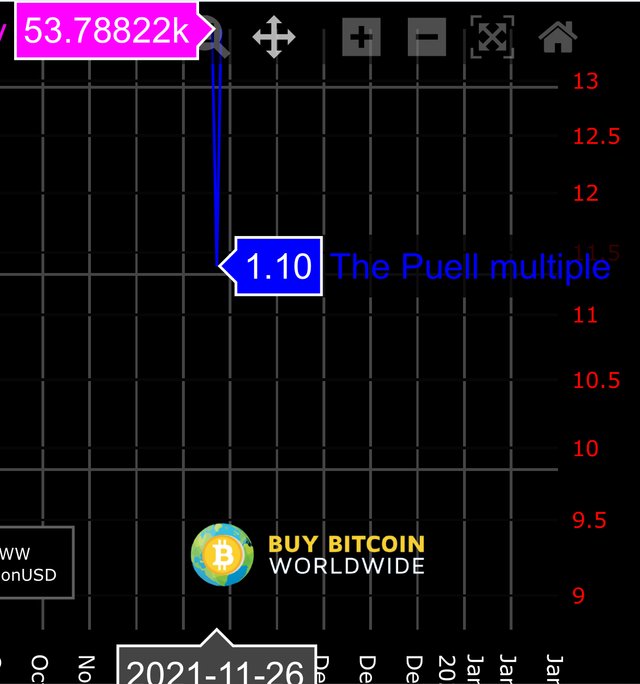
- CURRENT PUELL VALUE OF BITCOIN:
The current value of the puell multiple of bitcoin is 1.10 at $53,788 on 2021-11-26 and this is a buy signal for investors (watch out).
Before I proceed to the technical analysis of LTC using puell multiple, I will love to throw a little insight into what technical analysis is.
- TECHNICAL ANALYSIS :
This analysis is based on historical data, observing trend patterns in price movement from the past.
Technical analysis is for short-term investment because it is mainly based on an asset's past performance.
| LTC | FEATURES |
|---|---|
| Price | $199.47 |
| Trading Volume24h | $2,726,384,334.42 |
| Market Rank | #15 |
| Market Cap | $13,661,087,297.20 |
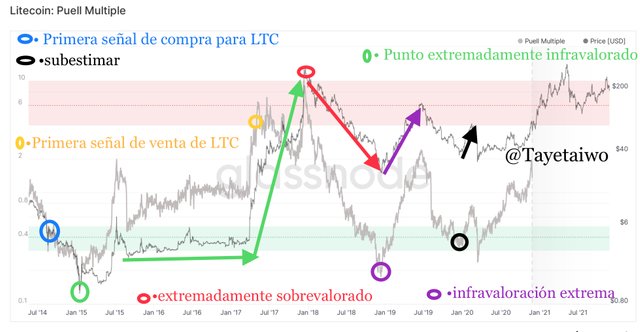
Following the puell multiple of LTC, undervalued region is shown by a green mapped zone below the chart which ranges from (0.1 - 0.5), and the overvalued region shown by a red mapped zone above the chart which ranges from (4.0 - 10.0).
As we all know that when the puell multiple gets to the undervalued zone its a buy signal for investors, and when it gets to the overvalued zone a sell signal for investors.
Now, the first buy signal of LTC was on Friday 22nd August 2014 with a puell multiple of 0.4 at the price of $5.21 (blue circle). At this point the signal to investors was to buy, so using this as the first entry point won't be a bad idea.
After the signal to buy, we would notice that the price kept on going down (downtrend) till it got to the extreme undervalue zone (green circle), which from here was a little increase in price before it's stationary trend (green horizontal arrow) on 20-01-2015 with a puell multiple of 0.157 and price of $1.32. After this was an increase in price which is shown by an upward arrow(green arrow).
The puell multiple got to its first sell signal zone(yellow circle) on 2017-05-16 with a puell multiple of 4.37 at the price of $23 which instead of retracing the price kept going higher until it got to an extreme point( red circle) with a puell multiple of 8.2 at the price of $321 (LTC first all-time high) on 2017-12-17. This two-variable points are entry points for investors but with a smart and well experience trade formation.
From there we could see the dipping that took place (red arrow) which the price retraced back to $23 at a puell multiple of 0.21 (purple circle) on 2018-12-13. At this low point is an entry point for investors to buy.
After that was an increase in price (uptrend) shown by an upward arrow (purple arrow) to a price of $136.60 at 2.38 puell multiple on 2019-06-19.
Another entry point I choose to show was on 2019-12-19 where the puell multiple was at 0.34 with the price of $39.89 (black circle), which thereafter was an uptrend movement to $75.29 on 2020-02-16 (black arrow).
Puell multiple indicator is a very special indicator used in detecting the next uptrend or downtrend movement of the price of an asset in the market which is dependant on the overvalued and undervalued region of the puell multiple chart.

2.- Explain in your own words what Halving is, how important Halving is and what are the next reward values that miners will have. When would the last Halving be. Regarding Bitcoin
Halving means to “divide by 2” (n/2), In bitcoin there are group of individuals known as “miners”, miners solve mathematical problems concerned in the block chain as well as resolving the cryptographical issues, and this is so because every transactions made in the block chain needs to be secured, encoded and protected cryptographically.
The also earn crypto currencies as a reward every time they mine a block. Now, halving is the computerizedprocess that halves each reward paid to miners.
When a certain number of blocks are mined, the system is been programmed to half the rewards mined, and this values (rewards) are dependent on the cryptocurrency.
Initial the reward for Bitcoin mining was 50 BTC, in 2012 Bitcoin mining was halved and was reduced to 25 BTC, it then reduced to 12.5 BTC in 2016. This halving process is expected to continue until the total supply of BTC (21,000,000) is mined.
The idea for halving is to reduce the rate at which newly-minted coins are distributed to the market.
BTC halving occurs after every 210,000 blocks are mined, which takes approximately 4 years.
halving is Vital in crypto because it ensures the slow process to the max supply of tokens, Inflation is controlled also in cryptocurrency through halving.
Another motive for halving is to secure a stable price by making the coin increasingly scarce. Cryptocurrencies tends to increase in price historically at their year of halving.
Halving reduces the mining rate of a coin, thereby increasing it's worth, value and need in the market.
reduction in time to completion of the total supply
Increase in scarcity
increase in demand
Increase in price value
Increase in miners
The current reward a miner obtains from generating a block in bitcoin block chain currently is 6.25 BTC which is approximately equivalent to US$350,000, this level of reward was achieved in during the 3rd halving and the total amount of BTC procured will depreciate over the years until clocking its total supply of 21 million BTC.
The following table depicts the date of the next BTC halving including the reward gained by miners and the last block to be formed.
| Halving | Date | Block where the halving is executed | Miners Reward |
|---|---|---|---|
| 3rd Halving | May 2020 | 630.000 | 6.25 BTC |
| 4th Halving | year 2024 | 840.000 | 3.125 BTC |
| 5th Halving | year 2028 | 1.050.000 | 1.5625 BTC |
| 6th Halving | year 2032 | 1.260.000 | 0.7812 BTC |
| 7th Halving | year 2036 | 1.470.000 | 0.3906 BTC |
| 8th Halving | Year 2040 | 1,680,000 | 0.1953 BTC |
| Last Halving | year 2140 | 6.930.000 | 0.00000000BTC |

Analyze the Hash Rate indicator, using Ethereum. Indicate the current value of the Hash Rate. Show screenshots.
- HASH RATE INDICATOR :
Proof-of-Work(PoW) is the ability for a miner to complete a block solving cycle of complex mathematical operations. There are many other cryptocurrencies which makes use of the proof-of-work system aside bitcoin.
The proof-of-work which the bitcoin blockchain makes use of is a cryptographic proof which a party proves to the others the expansion of a certain amount made from specific computational effort.
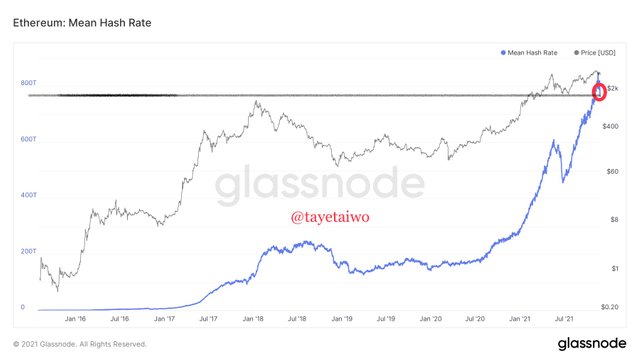
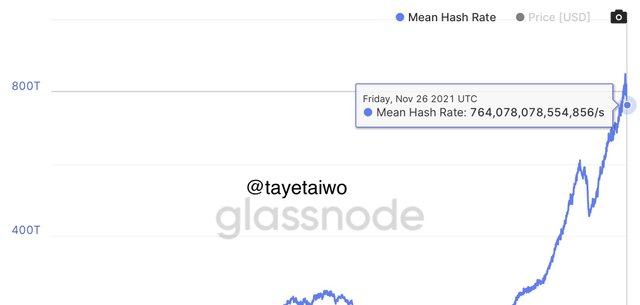
The Hash Rate, is an indicator that indicates the amount of computational power necessary to be able to mine a block.
The current value of the Hash Rate to mine Ethereum is 764 TH/S as of Friday 26th November 2021.
This method of determining the hash rate is correct but inaccurate because of the uncertainties of the number of hash rates.
Currently the level of complexity to mine Ethereum is very high in comparison with past times, and also the higher the Hash Rate, the more difficult it is to mine.
In other to mine a block currently, both for bitcoin and ethereum coin it is necessary and important to have super computer with a high computational power. This is so because of the number of miners and rate of mining currently. As halving continues to occur, the more difficulty mining.
Historically, Bitcoin was once mined with just a normal computer with low computational power, but currently not all computers are able to mine bitcoin except computers with a very high computational power.
The also is in the case of Ethereum coin.
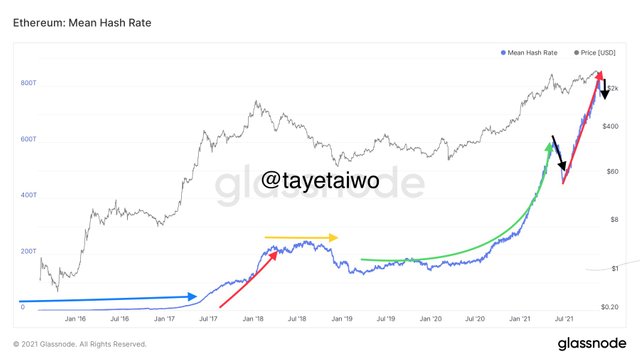
As we could notice in the diagram above (Diagram of the ethereum hash rate), formation of a linear harsh rate line(blue arrow) which was on 2015-08-15 on Saturday, showing how low the harsh rate was and non-investment wise Eth was as of then.
This was up until may 8th 2017, when the hash rate line made its first upward movement( red arrow) and at the price of $89.47. At this point different investors both large and small scale investors started purchasing and using eth for transactions. This spiked the hash rate from $89.47 to $538.64 as of 2018-03-18 on Sunday.
Here comes an equilibrium movement of the hash rate flow (yellow arrow) up until 2018-10-08 being Monday before the downtrend movement of ETH.
This could be due to potential doubt of investors towards the coin, leading to the depreciation of Ethereum price as well as its harsh rate.
As of 2019-04-06 on Saturday, after the decrease in ETH which was due to the reduction of investors and users, ETH price was now at $165.98 with a lower hash rate compared to the previous year after its first spike.
As of April 2019, ETH remained at a range of price which was between $160-$169 up until mid - late 2020 when the first smart contract was introduced using ETH network and blockchain know as million money. This smart contract brought a lot of people into exchanging and transacting with Ethereum coin on Ethereum blockchain. And the smart contract was built to make use of ETH as means of payment.
This added to the boost of ETHs hash rate and price from mid July 2020 - may 19th 2021 (green curved arrow on the chart) from $169 - $2,478.4.
A lot of smart contract was done then which I was a member to the money gaining scheme built on a two by two matrix designed by ethereum. ETH became more famous and had a lot of value which later affected the transaction price of ETH.
Gas fees increased, time of transaction increased as well leading to slow and dull transactions, and this was due to the compactness in the use of ETH which affected its network system. In other to transact with Ethereum you will lose a significant amount as gas fee. This lead to the decrease in the use of ETH by investors.
The ban which was put on Bitcoin mining as of July 2, 2021 in China affected the decrease in the Hash Rate of Bitcoin starting from May with a value of 180 TH/S to a lower value of 84.79 TH/S. This also affected the decrease in the price of ethereum and its hash rate. I feel this is because, bitcoin in a way influences all other coins.
A downtrend movement followed after all the predicament that happened to ETH, which the price and hash rate of ETH declined to $1,976.33 on 27th June, 2021(black arrow).
After the lunching of ETH 2.0(ETH new version in solving and rectifying issue with transaction)and relocation of Bitcoin miners from China, ETH increased in value as well as price as of 27th June up until now 2021-11-26(red arrow) with a price of $4,350 and a hash rate of 764 TH/ S.
As ethereum continues to increase in price so is the hash rate, because the both work in hand.

Calculate the current Stock to flow model. Explain what should happen in the next Halving with the Stock to Flow. Calculate the Stock to flow model for that date, taking into account that the miners' reward is reduced by half. Show screenshots. Regarding Bitcoin.
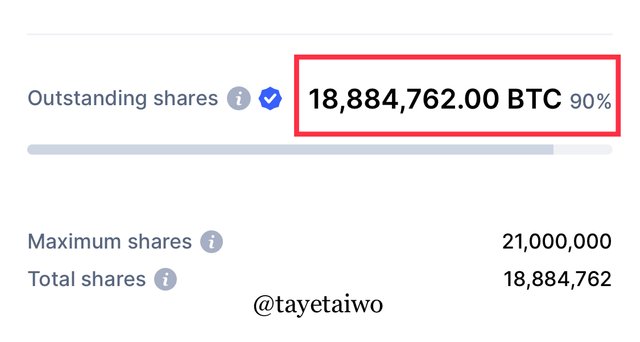
In other to calculate the current Stock to flow model, we would first discover the current circulation of BTC. In other to find this data we would visit Coinmarketcap.com
In other to calculate the stock to flow model
SF = Stock / Flow.
For the date November 27, 2021:
Stock (existence) = 18,884,762.00 BTC.
Annual flow = Reward / block (miners) * Annual block production.
Annual flow = 6.25 BTC / Block * 52,560 Blocks / year = 328,500 BTC / Year.
SF = 18,884,762.00 BTC/ 328,500 BTC / year
SF = 57.4878599695586
SF~ 57.49 (approximately)
To obtain the value of the indicator line (Stock to Flow model) it would be:
Stock to Flow model = 0.4 * SF ^ 3
Stock to Flow model = 0.4 * (57.49) ^ 3
Stock to Flow model = 0.4 * 190,010.2047
Stock to Flow model = 75,004.0819BTC.
Estimated BTC by 2024 would approximately be 1,9687,500.00 BTC
Reward of miners will be = 3,125 BTC / Block.
The Stock to flow calculation for 2024 would be;
Stock (stock) = 1,9687,500.00 BTC
Annual flow = Reward / block (miners) * Annual block production.
The Annual flow = 3,125 BTC / Block * 52,560 Blocks / year = 328,500 BTC / Year.
SF = 1,9687,500.00BTC/ 328,500 BTC / year
SF = 59.93
In other to obtain the value of the indicator line which is the Stock to Flow model, to obtain the future stock to flow price by 2024 during next halving, it would be:
Stock to Flow model = 0.4 * SF ^ 3
Stock to Flow model = 0.4 * (59.93) ^ 3
Stock to Flow model = 0.4 * 215.24
Stock to Flow model = 86,096 BTC.
Estimated stock to flow index would be at 86,096 BTC by next halving (2024)
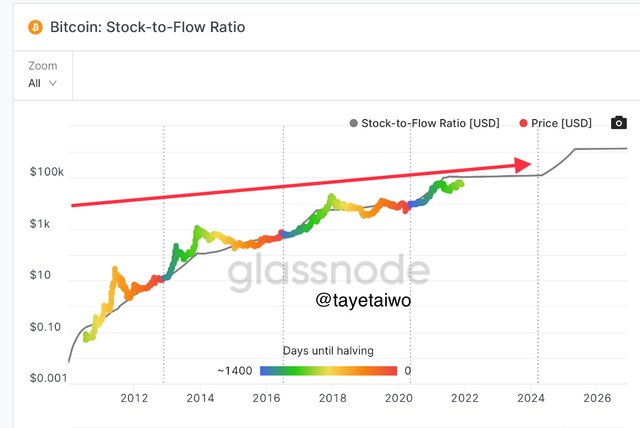
According to the above image, it is predicted that the stock to flow index would continue to increase as the years go by, as well as the price of BTC.

A type of metric indicator which is the Puell multiple is the ratio of issued coins in USD in daily basis which is divided by 365-day MA of daily value of issued coins.
This determines the profitable rate of miners and the signals to investors, for instance, when the puell multiple is at the overvalued region it means the high profitability of miners and eagerness of miners to sell their assets and also to investors, a sell signal.
This is vice versa to when the puell multiple is at the undervalued region, it depicts the low profitability ratio of miners and a buy signal to investors.
Thanks to professor @pelon53 for this intriguing lecture. See ya!
CC:-
@tayetaiwo
