Head and Shoulders and Inverted Head and Shoulders Pattern- Steemit Crypto Academy- S5W2- Homework post for @utsavsaxena
Hello great steemians, hello professor, a humble and warm welcome and congrats on your professorship @utsavsaxena in the steemit crypto academy.
I'm most glad to be a partaker of your intriguing and knowledgeable course on the technical indicator “Head and shoulder”, which signals a reversal trend from bullish to bearish.
I would make my intro and greetings short in other to commence on what we have for the week...Happy reading!😌

Explain Head and Shoulder and Inverse Head and Shoulders patterns in details with the help of real examples. What is the importance of voulme in these patterns(Screenshot needed and try to explian in details)
- HEAD AND SHOULDER
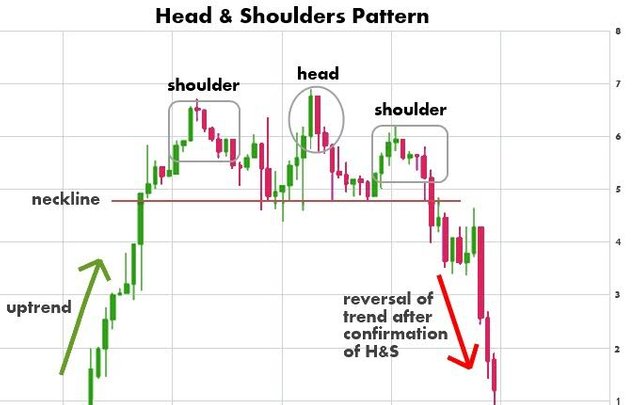
The head and shoulder indicator is a technical indicator used in the prediction of price trend reversal.
The price trend reversal here is specific and precise, it is the bullish to bearish-trend reversal.
The head and shoulder structure is formed by price action which is depicted by the candlestick bars.
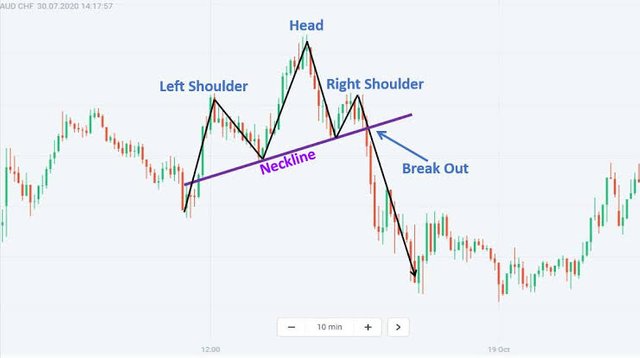
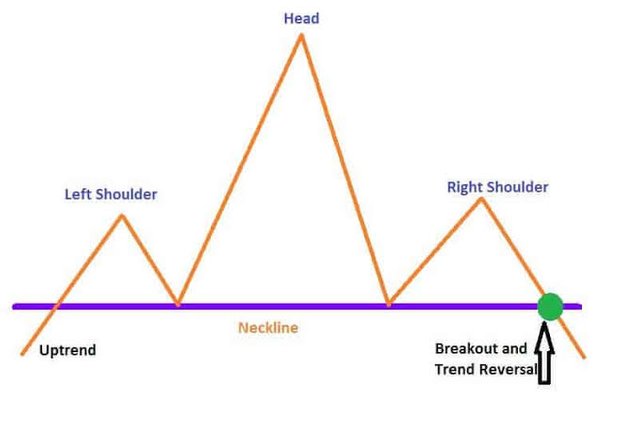
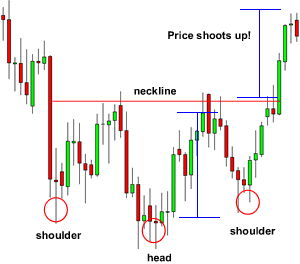
The head and shoulders structure is depicted by a left shoulder, head, and a right shoulder, where the middle peak (head) has the highest peek among the two shoulders.
The head and shoulder pattern is formed by the following patterns;
- The left shoulder
- The head
- The right shoulder
- THE LEFT SHOULDER
The left shoulder is a price trend in an upward movement, Which depreciation of price movement follows next. The left shoulder is always shorter to the next price trend increase.
- THE HEAD
The head follows the immediate formation of the left shoulder with a projectile movement higher than it.
- THE RIGHT SHOULDER
The right shoulder follows the immediate decline of the head, with another projectile movement but not up to the level of the head, but half-way.
The head and shoulder pattern is said to be complete after the formation of the left and right shoulder with the head as well.
This pattern tends to predict price trend reversal, but doesn't give a 100% assurance of a positive trade .
This is because of the fact that in the crypto market, volatility and other fundamental attributes can stultify the head and shoulder pattern predictions at the moment.
Trading criterias needed to commence trading using the head and shoulder pattern indicator must be met before the entry of the trade.
This is as a result of making sure that the patterns are formed as it should consisting of a left shoulder, head, and the right shoulder.
The neckline must be drawn as well in other to be able to calculate your target profit using the neckline as a medium of calculation.
The neckline is measured from the two low points of the head.
As I said earlier, “a projectile movement”, and the neckline is gotten from the onset of the heads projection to its landing point.
After deriving all these patterns and specific marks (neckline), we now wait for the entry point
At this point, you are sure of fulfilling All positive criteria needed in trading with the head and shoulder pattern.
Now, the entry point is the point at which the price trend level crosses the neckline towards the bearish angle. Did I mention that the head and shoulder pattern is precisely and strictly for bullish to bearish-trend reversal? And the action on meant to be carried here is to sell.
Sort of a dip, and you can't tell how deep the dip could go, so a target level is advised to be used as well as stop-loss, to prevent a reversal in price to the bullish angle which could lead to “loss” in the trade.
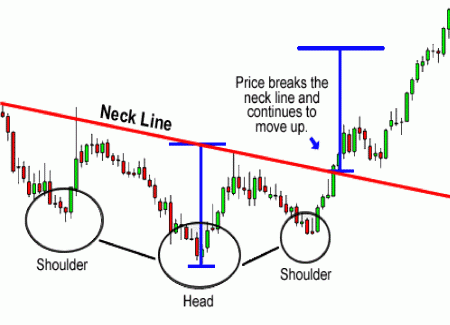
Patient traders would wait for the price to retest the neckline level after the first insight of entry which is the breakout below the neckline.
Remember that when the breakout happened, it crossed the neckline level towards the bearish angle, the point of crossing is called the entry point. Retesting of price at the neckline is when the price trend moves upwards again touching or crossing the neckline as if its moving to the upward direction then with a decline back towards the bearish angle.
The main aim of the head and shoulder is to sell the dip. Speaking about the target level, I would explain the mathematical means of acquiring the target level which is your take-profit.
- TARGET LEVEL
The target level is ascertained in the following ways in the head and shoulder pattern;
derivation of the difference between the head peak and the low side of either shoulder.
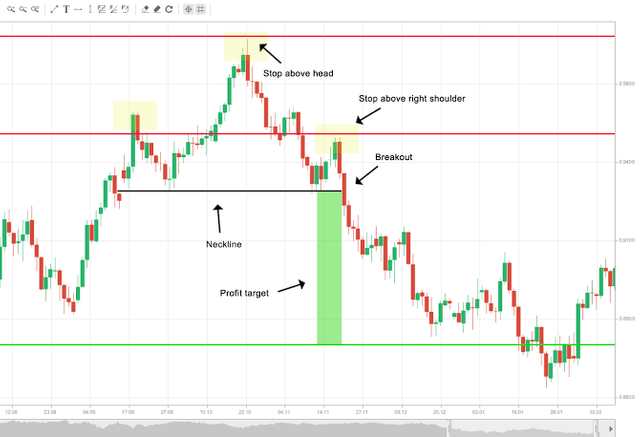
the difference derived from the above method is subtracted from the neckline point, whatever answer we get is out target level.
Let’s look at the exemplary method;
Let’s take the peak of the head to be $70, and the low of either shoulder you choose to use is $30.
70 - 30 = 40
$40 is the difference between the head peak And the shoulders low.
Now after this, in other to get our target level, we would be subtracting the neckline level from it.
The neckline level is $30
:-
40-30 = 10.
$10 is my target level.
- STOP-LOSS
Stop-loss for the head and shoulder pattern is advised to be placed a little above the peak of the right shoulder.
Risk traders can as well place their stop-loss above the peak of the head, but its to the users possible detriment.
- INVERSE HEAD AND SHOULDER
I know we all at least can guess or predict what the inverse head and shoulder pattern is all about, because it’s the inverse, opposite to the head and shoulder.
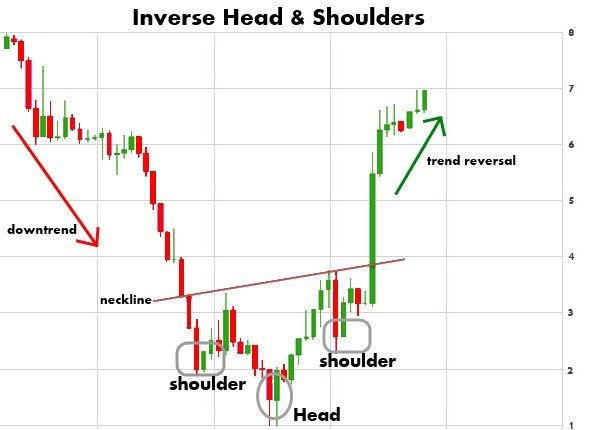
This pattern is the upside down of the head and shoulder pattern, also one of the best trend reversal pattern but precisely for the buy-side (bearish to bullish-trend reversal )
inverse head and shoulder pattern
The inverse H&S pattern consist also of three components which forms the inverse head and shoulder, and the are as follow;
- The left shoulder
- Head
- The right shoulder
- THE LEFT SHOULDER
The left shoulder is formed when the price trend moves toward the bearish angle with a Reversal in price movement to an upward Direction, forming an inverse A.
- HEAD
The head is formed following a bearish movement (downward price trend) Which dips more that the first shoulder, with an upward movement as next price trend.
- THE RIGHT SHOULDER
The right shoulder is formed after the head, with a decline in price movement towards the bearish angle, which it’s low is higher than that of the head, following a reversal towards the upward trend which at this stage, we get ready for our entry.
This is a very infrequent pattern to be formed in a market price trend.
Just as the head and shoulder pattern has trading techniques and criteria’s to meet, the inverse head and shoulder as well has the same criteria’s but opposite from that of head and shoulder.
Discovering all the criteria’s starting from the formation of the left shoulder, the head, and the right shoulder is the first thing.
Then we mark out neckline which is derived from marking the high end of the left shoulder and the high end formed before the right shoulder.
At this point all we have to do is stay and observe the market as at this point a signal is given, which is an uptrend price movement.
But this takes place once the price trend crosses the neckline, moving upward. This signals the buying period For traders.
- ENTRY PERIOD
The entry period is the point at which the price has crossed the neckline moving towards the bullish position.
Safe traders could actually wait for the trend to retest The neckline (falling back to the neckline, sometimes below, before the uptrend movement commences. And at this point of the price taking of again to the bullish angle is another point of entering the trade.
- STOP-LOSS
The stop-loss is placed a little below the Low of right shoulder.
Risk traders can as well place there’s at the low point of the head. But this only reduces their risk-reward ratio and put them to more danger.
- TARGET LEVEL
The target level here is the same with the head and shoulder target level calculation format but due to the inverse structure, we would have a different means of deriving and rather than subtracting, addition the the values.
The following steps to the calculation are;
The different between the head lowest point and either of the shoulders high point.
After getting the difference in the previous step, we now add it to the neckline price level In other to get our target-profit level.
Let’s look at the following example on “target level” for inverse H&S pattern.
If the head lowest end is $60 and either shoulders high trend is $80, our difference would be;
80 - 60 = 20
20 as the difference here would now be added to the neckline price.
The neckline price is $80.
:-
80 + 20 = $100
$100 is my target level for inverse H&S pattern.
Volume differs in the different head and shoulder patterns. We could have a diminished volume, which is as a result of buyers inability to keep up to their initial aggression in the market, and this forms the head in the head and shoulder pattern precisely.
There is an increase in volume when the price trend is closed above neckline which is drawn between the left shoulders high and head high which complies with bullish reversal
There is usually a higher volume on the left shoulder compared to the head and right shoulder.

What is the psychology of market in Head and Shoulder pattern and in Inverse Head and Shoulder pattern (Screenshot needed)
The psychology of the market in relation to the head and shoulder & inverse head and shoulder pattern Is what actually leads to the formation of this patterns.
Investors contemplate on the supply and demand of a particular asset and indirectly forming a head and shoulder pattern which is respect to the choices of buying and selling made.
As we all know that the head and shoulder pattern predicts price trend reversal which is precisely the bullish to bearish-trend reversal.
The psychology behind the formation of the head and shoulder pattern are the traders emotions, which affects the market (buying & selling).
The formation of the first (left) shoulder in the head and shoulder pattern is as a result of increase
In the greed Emotions of traders which their fear took over after on, leading to decline in price movement.
The head is formed from another greed emotions of investors who believes that the asset still have the potential to rise, this time around , the held longer that than the previous investors leading to the high peak at the head region over the left shoulder. Then another Retracement occurs due to the fear emotions of loosing their capital or asset.
The right shoulder is formed from greed emotions of traders but not to the extent of that of the “head” greed emotion, that is why the peak of the right shoulder is smaller compared to the head peak. But as always, there would be fear in the system which leads to the Retracement of price trend.
As this trend goes on the lower the volume and the higher the fear emotions...which shows the tendency of the asset to dip for a while or period.
In the inverse head and shoulder pattern every emotions in the market that resulted to the formation of the pattern “head and shoulder” is also responsible for the formation of the inverse head and shoulder.
Since inverse head and shoulder depicts price trend reversal from bearish to bullish-trend reversal, this means that the fear emotions in the market Is low compared to at the head and shoulder pattern.
Investors are willing to buy and hold, but just few can also affect price trend.
This is vice versa to all activities that took place at the formation of head and shoulder pattern.
Formation of the first (left shoulder) is because of the fear emotions of traders, which led to the decline in price movement. But due to the fact that buyers are constant here and sellers are few, led to the Retracement of price trend to an upward direction.
The head is formed following the fear emotions of traders leading to another Retracement of price to the bearish angle. The fear emotions here got higher compared to the left shoulder, which led to the formation of lower low at the head. The head here has the lowest low among other components in the inverse head and shoulder pattern. Traders are affected by their greed leading to an uptrend movement, forming a complete Head component.
Their is another Retracement in Upward price trend to bearish angle, but the fear here is low compared to the head. The formation of the right shoulder is complete following the Retracement back to the upward trend which is the strong zeal of buyers in the market.
As I said, the zeal of buyers here are quite much which leads to the increase in price action conforming the function and law of inverse head and shoulder.

Explain 1 demo trade for Head and Shoulder and 1 demo trade for Inverse Head and shoulder pattern. Explain proper trading strategy in both patterns seperately. Explain how you identified different levels in the trades in each pattern(Screenshot needed and you can use previous price charts in this question)
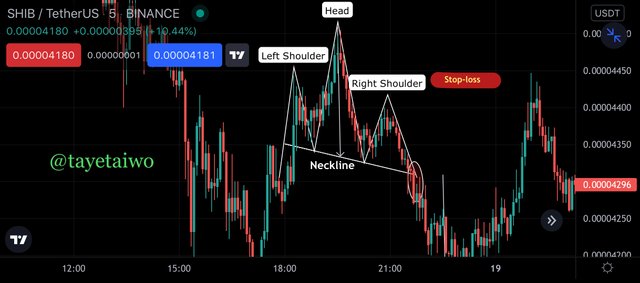
- Firstly, the trade below depicts a demo trade of SHIB/USDT using the TradingView app. The chart trade is a 5 minutes chart.
The formation of the head and shoulder pattern was derived from the marking of the left shoulder which started with an uptrend movement and later declined, following the formation of the head, which makes an uptrend movement from the declined point of the left shoulder crossing the peak of the left shoulder forming a higher peak which later declines, then the right shoulder picks up from the declined point of the head towards an upward movement but falls back without reaching the heads peak, thus making the head the highest peak.
After deriving the head and shoulder, mark out the neckline which is derived from the two lowest point of the head, a line is drawn across , touching the two low points.
Now we observe and wait for the entry-point Which is the main action of all this processes.
The entry-point starts with a hint showing the formation of a candlestick bar crossing the neckline region to the bearish direction.
My trading view app
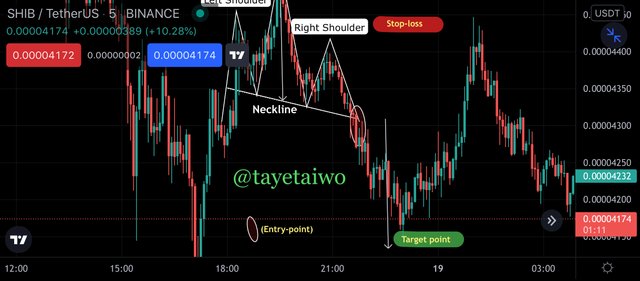
As we can see that the candlestick bar as predicted has crossed the neckline, heading bearish, at this point the trade was placed on the sell-side.
Now it’s time to derive stop-loss and the target level. The stop-loss was placed a little distance above the right shoulder, this is for a safe repercussion.
The target level was derived as well by finding the difference between the head and the low of the left shoulder. The answer gotten from the difference is subtracted from the neckline in other to get the target level just as we could see in the graphics above.
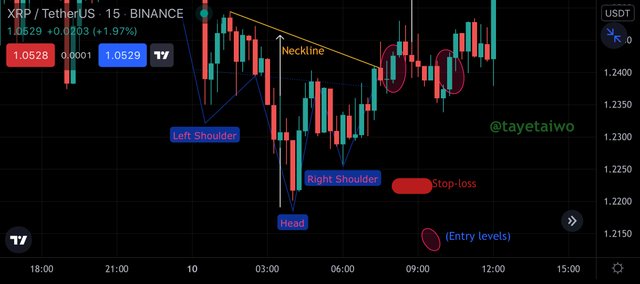
The trade below depicts a demo trade of XRP/USDT using the TradingView app. The chart trade is a 5 minutes chart.
The formation of the inverse head and shoulder pattern was derived from the marking of the left shoulder which started with a downtrend movement and later went up, following the formation of the head, which makes a downtrend movement following the left shoulder crossing the inverse peak of the left shoulder forming a higher inverse peak which later moves upward (opposite direction), then the right shoulder picks up from the upward price point of the head and make a downtrend movement but rises back without reaching the inverse heads peak, thus making the head the highest peak.
After deriving the inverse head and shoulder, mark out the neckline which is derived from the two highest point of the head, a line is drawn across , touching the two high points.
Now we observe and wait for the entry-point.
The entry-point starts with a hint showing the formation of a candlestick bar crossing the neckline region to the bullish direction.
My tradingview app
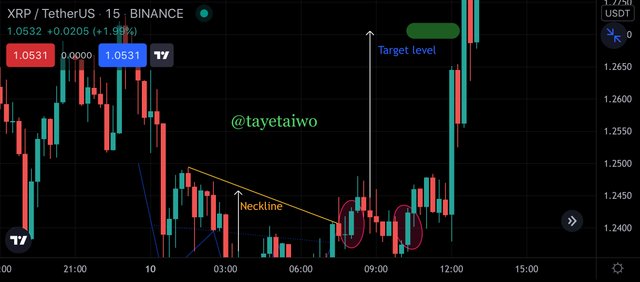
As we can see that the candlestick bar as predicted has crossed the neckline, heading bullish, at this point the trade was placed on the buy-side.
Now it’s time to derive stop-loss, stop-loss was placed a little distance below the right shoulder, this is for a safe repercussion as well and always.
The target level was derived as well by finding the difference between the head and the low of the left shoulder. The answer gotten from the difference is added to the neckline value in other to get the target level just as we could see in the graphics above.

Place 1 real trade for Head and Shoulder(atleast $10) OR 1 trade for Inverse Head and Shoulder pattern(atleast $10) in your verified exchange account. Explain proper trading strategy and provide screenshots of price chart at the entry and at the end of trade also provide screenshot of trade details.(Screenshot needed.)
In this question I will be trading for inverse head and shoulder pattern.
The value traded was CHESS/USDT for the inverse head and shoulder, which means to buy CHESS against USDT (selling USDT).
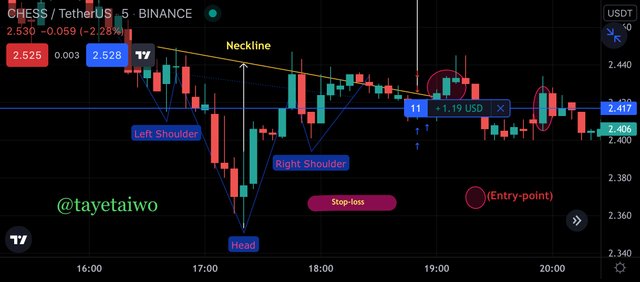
I first observed to make sure I have my inverse head and shoulder pattern formed, then I marked them as seen in the image below; the left shoulder, head, and the right shoulder. I also marked out my neckline Which serves as a medium to market entry.
Then I have to wait for the formation of a candle stick bar above my neckline. This is sort of an indicator saying “let’s buy, it’s time.”
An entry order was placed immediately at the price of $2.41, with my stop-loss at $2.367 which was placed a little below the right shoulder.
My target level was also derived, through the calculation of the difference between the inverse peak of the head and the high point of the head. The result gotten from the difference was added to the neckline in other to get my target level. My target level is $2.513.
My trading view app
After setting up my trade on my trading view app, I logged into my verified binance account in other to place my order.
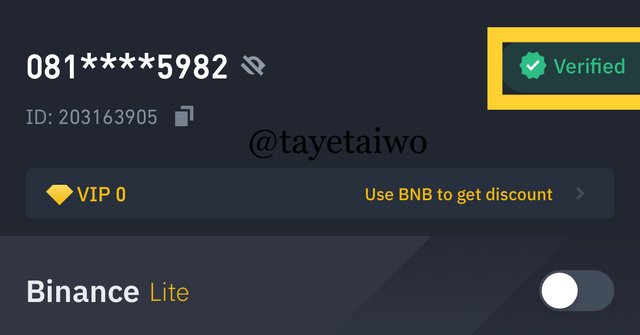
My Binance app
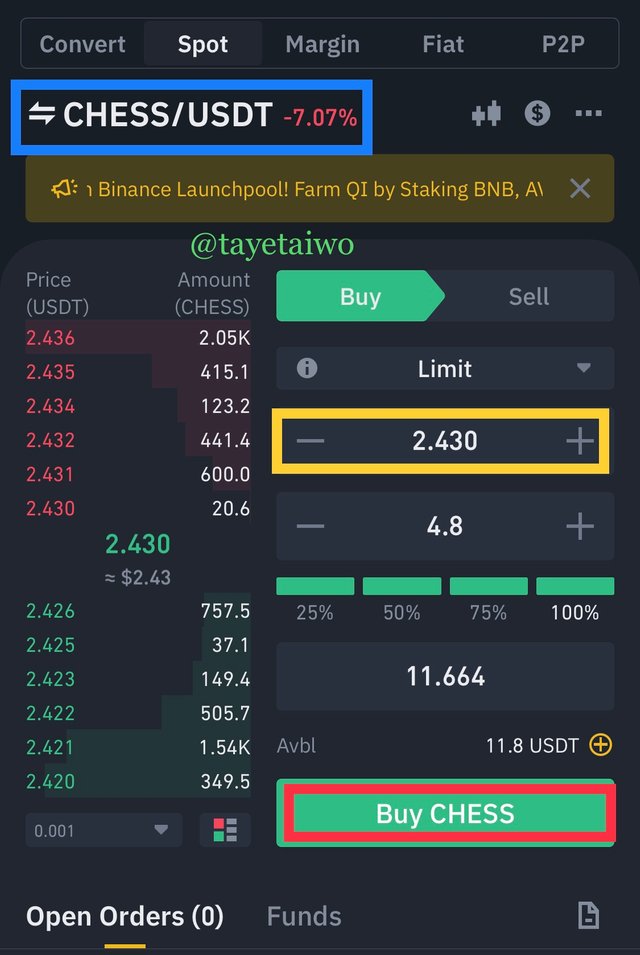
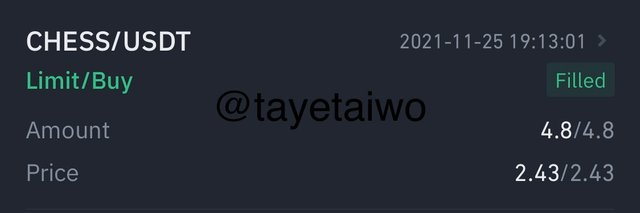
There was a real fast increase in the rising of CHESS/USDT before I could get to access my Binance app, this lead me into placing a buy order at $2.43 instead of the initial $2.41 at my tradingview app, let’s continue.
I bought a total of 4.8 CHESS At $2.43.
My Binance app
My Binance app
Below is the screenshot of my order detail.
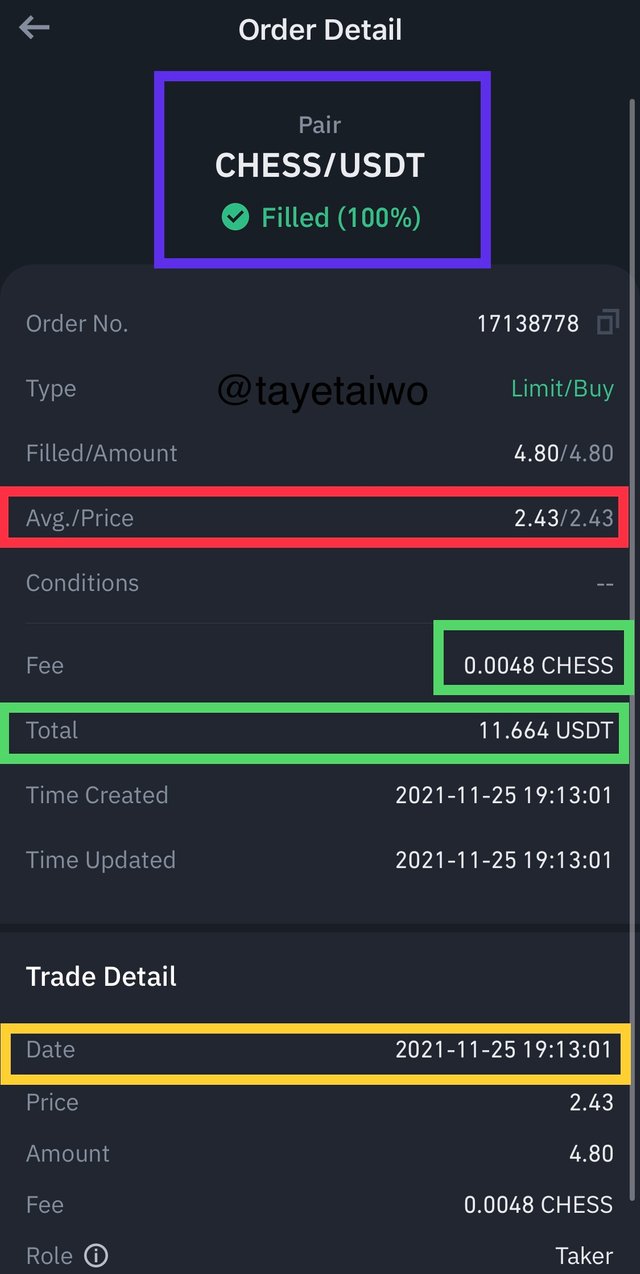
My Binance app
I was charged a fee of $0.0048 CHESS and purchased the sum of 4.8 CHESS.
The date and time of the transaction was at 19:13:01 on 2021-11-25.
I bought CHESS with the sum of $11.664.
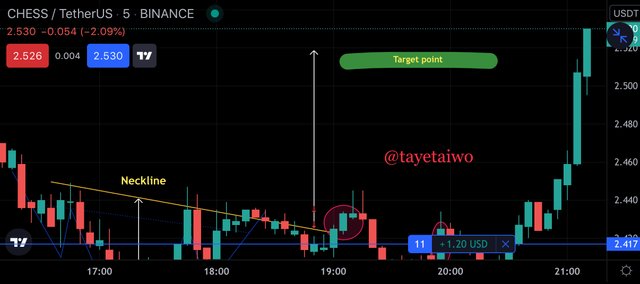
I made profit from the trade because my target level which was at $2.513 was achieved and yielded the end sum of $12.01 as the current CHESS value.
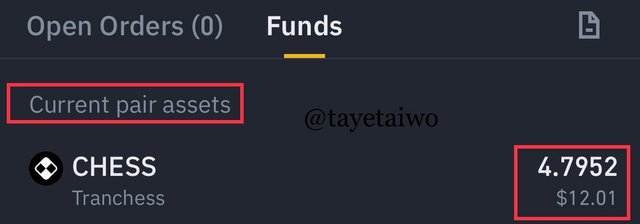
My Binance app

Inverse head and shoulder is a bearish-bullish trend reversal and one of the best trend reversal indicators and signals if not the best. In as much as the positivity of the indicator as a stand-alone, it is also advisable to not use the pattern indicator as a stand-alone for a more safer and profitable trading.
The volatility in the crypto market are also affected by other fundamental analysis; (government, politics, Economy , etc) as this can affect price trend movement, it is best to use another indicator which would serve as a complimentary indicator to detect false signals.
Just to show the CHESS/USDT trade continuation, my target level was over crossed
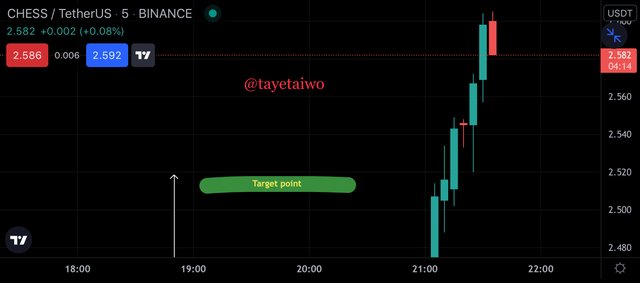
My Binance app
It was a wonderful and intriguing lecture by professor @utsavsaxena11, and I can’t wait to be a partaker of your next lecture, to enjoy a well presented and knowledge gaining lecture.
Thank you!
