Candlestick Patterns || Steemit Crypto Academy Season 4 ||Homework post for Task 10 by @tasmiya
Hello friends how are you I hope you will be fine and live a peaceful life? this is my homework post for the fixed introductory courses Task 10. Which is about Candlestick patterns.
.png)
Candlestick Patterns by @tasmiya
- Explain the Japanese candlestick chart? (Original screenshot required).
- In your own words, explain why the Japanese Candlestick chart is the most used in the financial market.
- Describe a bullish and bearish candle. Also, explain its anatomy. (Original screenshot required).

Explain the Japanese candlestick chart? (Original screenshot required).
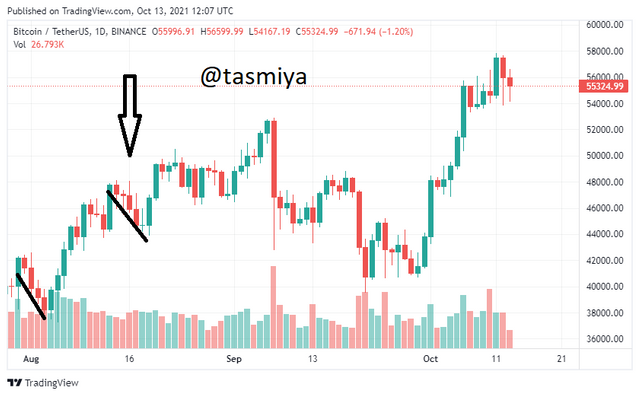
Japanese Candlestick Chart
The Japanese Candlestick Chart represents the graphical representation of price in the financial market. It is made of an element known as Candlestick. We use this Chart to determine the entry and exit points. We can see that the shapes of this chart are similar to candles.
In the 1700s it was developed in Japan based on tracking the price of rice by Homma. It shows emotions based on its different colors and representing the size of the price. We use Candlestick to make trading.
An important point of the Candlestick chart is that it has four price points such that open, close, high, and low. It represents the movements of the price at the required time.
source
In this picture, we can see that all assets easily. With the help of this chart, we make important decisions. For the technical analysts, we use this chart for important technical analysis and perfect decisions. It is a graphical interface of this chart.
.png)
In your own words, explain why the Japanese Candlestick chart is the most used in the financial market.
Japanese Candlestick helps its traders to know the future prices based on the past pattern. Candlestick helps the traders to keep accurate analysis on future trade and financial markets. In trade, it is very easy to use. IT differentiate between the price of an asset and crypto traders for financial gain. Japanese candlesticks give accurate information about price movements as compare to the bar charts.
And most things candlestick gives a very clear picture it means it shows a very clear graph for analysis. Candlestick analysis bases on market cap, chart pattern, and candle patterns. We make any decision on the basis of open, close, high, and low in the future. Japanese candlestick is a very powerful chart and its color is red and green. These colors show bullish trends and bearish trends it means the green color shows a positive price and the red color shows a negative price. some times its color is green and black instead of red.
Describe a bullish and bearish candle. Also, explain its anatomy. (Original screenshot required).
Japanese Candlestick has two types.
- Bullish Candle.
- Bearish Candle.
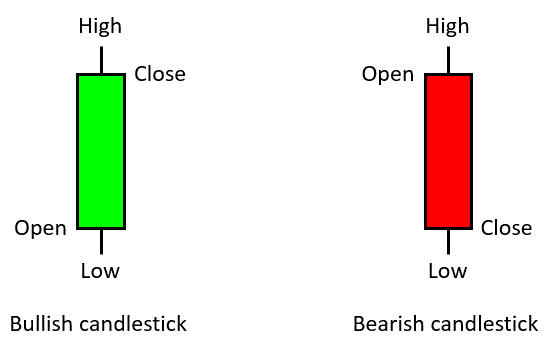
Bullish Candlestick
Bullish is a type of candlestick. A bullish Candlestick signifies uptrend movement in the market. If the opening price is less than the closing price. In the chart its color is green. It is indicated increased assets in the market. It is mostly used economically advantage.
Bullish is a reversal pattern and it is in form of a downtrend. It tells us about the rising value of commercial assets. These are shows low assets at the bottom and high prices at the top.
.png)
Screenshots are taken from Binance.
Bearish Candlestick
Bearish is a type of Candlestick. A bearish candle signifies a downtrend movement in the market assets. If the opening price is above the closing price it shows decreasing assets. It is denoted in red colors. It is opposite the bullish candle. We say it is bearish if the opening price is higher than the price of closing.
This patterns also shows that buyers are overtake the sellers. It is less important in a choppy market.
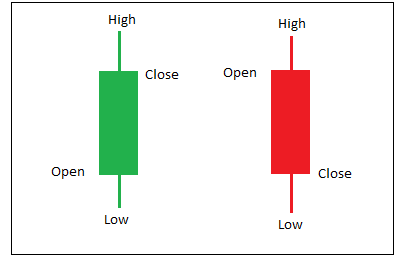
A Bullish and Bearish Candlestick Anatomy
A Candlestick consists of four parts which are open, close, low, and high. It shows different values at different points. Bullish and bearish candlestick are opposite to each other. Such that Bullish is open low and close on high and bearish are open high and close low which are completely opposite each other.
.png)
Open:
It shows the starting point framework.
Close:
It shows the ending point framework.
Low:
It shows the lowest price recorded at a point in the candle.
High:
It shows the highest price recorded at a point in time.

Conclusion
Japanese Candlestick is very important in trading. With the help of this we making important decisions. With the help of this, we see market ups and downs. This is a great lecture for me. I learn many new things from this topic. I am very thankful to professor @reminiscence01.