Support and Resistance Breakouts - Crypto Academy / S6W3 - Homework post for pelon53
Hey Steemit!
Here is my homework post for Professor @pelon53. It was a great lesson, and I hope you will enjoy reading my post.
.png)

1.- Explain in detail the advantages of locating supports and resistances on a chart before trading.
The benefits of establishing support and resistance areas on a graph before trading cannot be overstated, since they are important locations that the trader uses to generate a profit. Trend reversal generally occurs at places of support and resistance. Now, before we move on, let's understand what support and resistance levels are. If the price of an item is rising, it will reach a point when the upward trend will halt, i.e., purchasers will lose faith in the asset and begin selling it; this point is known as the resistance level. After then, the pattern will reverse and begin to go downward. Likewise, if the price of the asset is falling, it will eventually reach a point where it will stop falling; this point is known as the support level. After then, the tendency will reverse and begin to go higher.
As a result, a point of resistance that's where a bull move of an asset comes to a stop and a reversal to a negative movement occurs. Similarly, a point of support is really a position when an asset's negative movement comes to a stop and a reversal to positive movement occurs. Another reason it's important to find areas of support or resistance on the a graph prior trading is that these are our entrance and exit points. For a buyer, this support level or area is where he enters the market, and the resistance level is where he exits. Similarly, for a selling, trade entrance is generally made at the resistance level, while trade exit is usually made just at support level. When a trader employs this strategy, his or her odds of profit skyrocket while his or her chances of losing plummet.
Another advantage of identifying areas of support or resistance prior trading is that it allows traders to determine the market's momentum or strength. The market's strength might indicate whether or not a trend is about to break out. Traders will be able to collect assets at the correct moment and disperse them at the appropriate time if they understand support and resistance.
2.- Explain in your own words the breakout of supports and resistances, show screenshots for the breaking of a resistance, use another indicator as a filter.
The sustained upward or downward movement of the trend is referred to be a break in support or resistance. Breakout of resistance simply refers to a persistent upward rise of price above initial points at resistance. A breakthrough in resistance occurs when the price goes above the prior resistance mark. In the following question, I'll go through the topic of support. In general, resistance breakout may occur in one of two ways. Let's have a look at them.
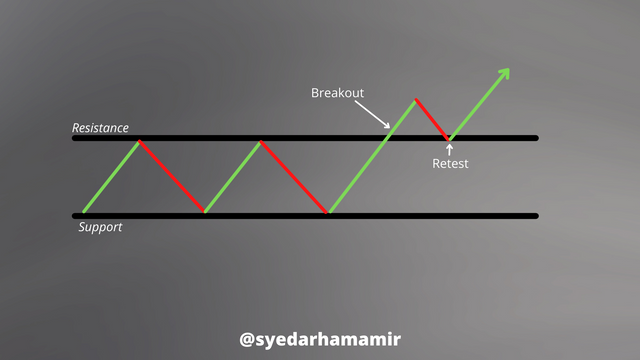
First, a resistance breakout may occur, followed by a retest of the first resistance level, at which time that first resistance level will function as a support level, and the trend will then go higher with in path of the first breakout. Take a glance at the picture below for an example.
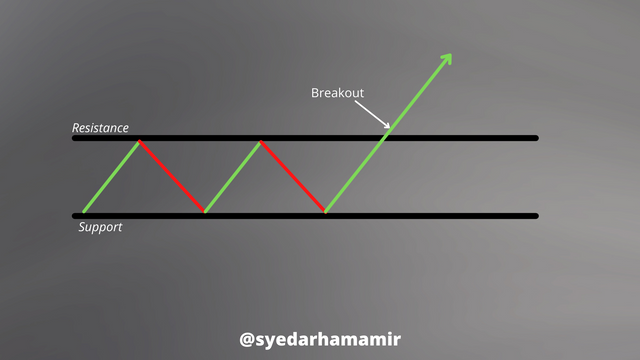
Another kind of resistance breakout is one in which the trend does not retest the original resistance point, but instead continues to move higher after breaking the barrier. Take a glance at the picture below for an example.
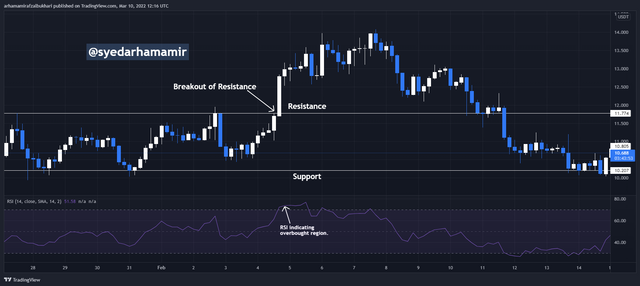
I've put the RSI indicator on my chart in order to confirm the breakout. Because the RSI line was above upper band level in this resistance break, we can observe that asset is overbought. By using RSI indicator, a zone from 70 and above is considered overbought, as seen in the chart below, where resistance was broken and we ended up in this area. This has been shown by the indication.
3.- Show and explain the breakage of a support, use an additional indicator as a filter, show screenshots.
Breakout of support simply refers to a continuing downward movement of price underneath the first points of support. A breakthrough in support occurs when the price goes below the prior support level. Support breakout might happen in one of two ways. Let's have a look at them.
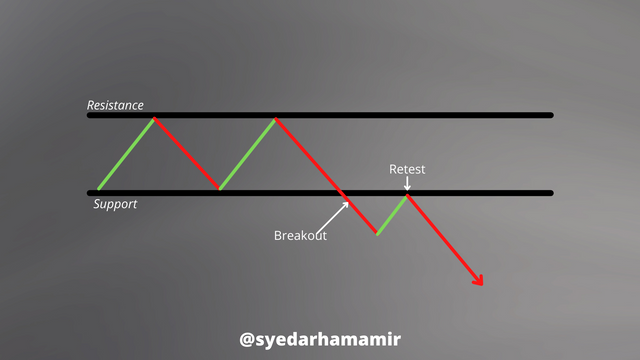
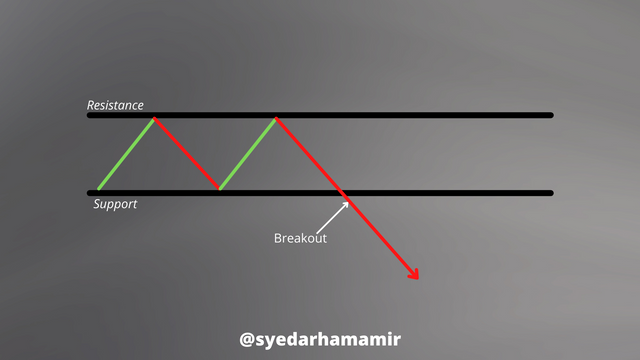
First, a support breakout may occur, followed by a retest of the first support level. At this point, that initial support area will act as a resistance level, and the trend will then go lower in the path of the first breakout. Take a glance at the picture below for an example.
Another kind of support breakout is when the trend does not retest the original support point and instead continues to move lower after breaching the support. Take a glance at the picture below for an example.
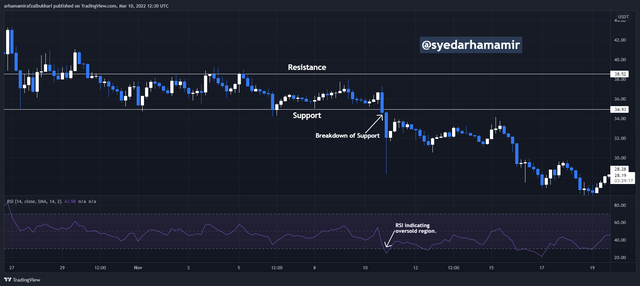
I used the RSI indicator on my chart in order to confirm the breakthrough. We can observe that the asset is oversold inside the support breakout since the RSI line is below lower band level. By using RSI indicator, we can observe that from a level of 30 and below, there is an oversold zone, as seen in the chart below, where the breach of support led us to this area. This has been shown by the indication.
4.- Explain what a false breakout is and how to avoid trading at that time. Show screenshots.
A false breakout, as the name indicates, is a breakout which is not genuine, that is, something not real. This false breakout may occur at either a support and resistance level. When a false breakout occurs at a resistance level, the breakout does not continue in the path it broke; instead, it rises a little in the scenario of a false breakout just at resistance level, then reverses, or it travels down a little more in the scenario of a false breakout just at support level, then reverses. This fake breakout is usually caused by whale in the market, who would give a lot more liquidity and afterwards withdrawal their asset once they observe traders entering the market, causing the little traders who were caught by breakout to money.
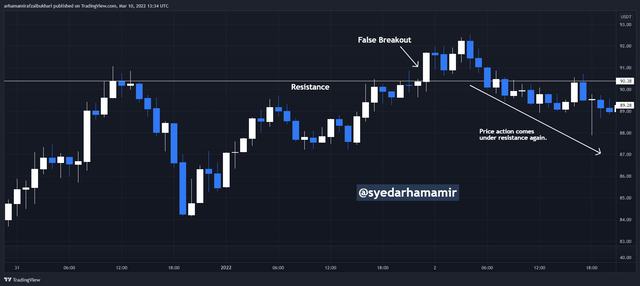
A false breakthrough just at resistance level can be seen in the image above. These points of resistance have been noted on the chart above, and the price broke through and rose higher, but not much farther; the price has since reversed and is moving lower. Many traders who didn't wait for the breakout to be clarified would join the market at this moment, causing them to lose a lot of money since they predicted that the price would go higher when it really did the opposite. All we have to do to prevent trading during a fake breakout is wait for a definite breakout before joining the transaction. Traders must use two or even more indicators in a trade to filter out this misleading signal in additional to wait for breakout to be extremely apparent. Once this condition is taken into account, you would be able to prevent trading during a fake breakout.
5.- On a demo account, execute a trade when there is a resistance break, do your analysis. Screenshots required.
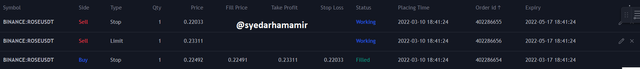
I used Support and Resistance lines in confluence with Volume indicator to execute this trade. This price is seen to be ranging in a channel and travelling with support and resistance lines. A breakout and a successful retest can be seen above the resistance line. A confluence to this is the Volume candle, the bullish volume candle is high at the breakout, it is longer than the average volume candles. I took the entry and placed my stop loss at support line. I placed my take-profit at a resistance.
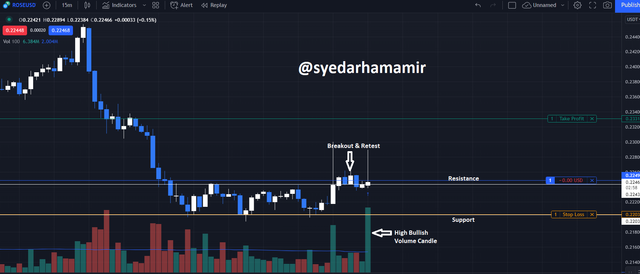
Below is the screenshot attached showing the orders for this trade:
6.- On a demo account, run a trade when there is a breakout of the support, do your analysis. Screenshots required.
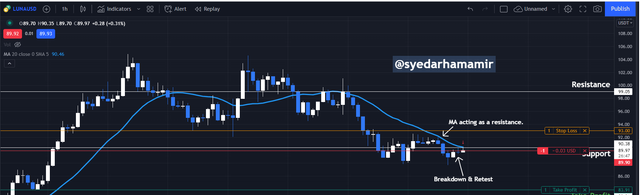
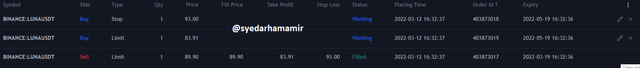
For this trade, I used support and resistance lines along with Moving Average. You can see the support breakdown on the chart, there is also a retest. In confluence with this, the Moving Average is also acting as a resistance to the price action. So I decided to take my entry at this point. I placed my Stop loss above the support line and set my take profit according to a decent risk-to-reward ratio.
Below is the screenshot attached showing the orders for this trade:
Any trader who want to be profitable in the crypto market must be familiar with and comprehend support and resistance. In any technical analysis, the levels of support or resistance are crucial. Traders employ support and resistance levels for a variety of reasons. As previously indicated, these locations act excellent entry and exit for traders. In terms of trading, understanding support and resistance levels can aid traders in minimising losses and maximising profits. Lastly, I would like to thank Professor @pelon53 for giving us such an amazing lesson. Thank you!