[Psychology of Trends Cycle] - Crypto Academy / S6W4- Homework Post for @reminiscence01
Hey Steemit!
Here is my homework post for Professor @reminiscence01. It was a great lesson, and I hope you will enjoy reading my post.
.png)

1. Explain your Understanding of the Dow Jones Theory. Do you think Dow Jones Theory is Important in technical analysis?

This Dow Jones Theory was created by Charles Dow in 1897. This idea did not cease once he introduced it; rather, it continued after his death, based on the numerous editorial publications on analysis which he had authored between 1900 and 1902.
The Dow hypothesis is an economic theory which explains if a market is trending up or down. It's a hypothesis that the both traders and investors use to figure out just how strong the market is. In a word, the Dow theory is a technical framework it forecasts whether a market is in an uptrend or not, as well as if one of averages has moved above a recent high, which is particularly significant when accompanied by a similar move by another average.
The following are the six concepts that describe that how Dow theory works. One of the principles is that all information is discounted by the market. The other is that there are three sorts of market trends. The next point to consider is that the marketplace contains three distinct trends: major, secondary, and minor. The fourth point to consider is that the trend has three distinct phases: accumulation, public engagement, and panic (distribution). The sixth point would be that the indices must first corroborate each other. The sixth point is that the trends must be supported by volume.
Importance of Dow Jones Theory in Technical Analysis
The Dow hypothesis is particularly essential in technical analysis since it aids traders/investors in accurately identifying market trends, allowing all traders and investors to take advantage of probable price action levels. Another reason I believe Dow Jones Theory seems essential is that it aids traders in being cautious of market patterns. This encourages traders to follow market trends rather than going against them, and to be cautious about if they're in the market. Overall, Dow theory is significant in technical analysis since it emphasises the importance of closing price, making it a stronger indicator for the market as a whole.
This is especially true since an asset's closing price is decided by how traders behaved as the trading day progressed. This assists traders in determining the market's direction. Finally, the Dow Jones Theory may assist us in making informed trading judgments.

2. In your own words, explain the psychology behind the Accumulation and Distribution phases of the market. (Screenshots required).

The psychology of the Accumulation as well as Distribution phases is based on the three-phase market trend concepts. It states that if the market is heading upward or downward, each trend is defined by three stages: accumulation, distribution, and public distribution. We will examine the psychology underlying the accumulation as well as distribution phases (A/D).
An accumulation phase is a period that follows a step downturn and during which many of the market's major participants lose optimism, believing that prices would not move higher. Despite the fact that the cost of the traded item may have reached its lowest point, major players are always willing to acquire it. As a result, the value of the traded item will no longer remain at low levels.
At this moment, major firms join the market. They realise that the marketplace has reached a low point, and they begin to purchase in big numbers in order to amass the asset at extremely low (cheap) rates. It is essentially what led to the development of support levels: the asset was purchased in huge amounts (volumes) by major players who understand the market better than small players, resulting in a strong demand for the assets in the market, leading to an upward movement.
A positive trend is also rising in the market at this time. Small traders get so terrified that they close their sell positions to make room for the available purchasing opportunity. As bigger quantities of the assets are pumped into the market, more buyers are becoming interested. Take a look at the image below for an example.
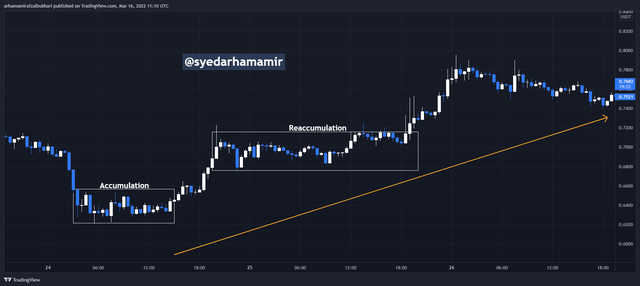
The value of the traded item had broken out the accumulation phase, as seen in the screenshot above. The price of the asset continued to move upwards as market purchasing activity increased. Looking at the picture, you also see that these major players that buy the asset at the wrong moment take a gain out of the market, which is why the price is falling. The accumulation phase occurs when the price has reached a new low point. (That is, the moment at which the item was acquired in huge quantities at the lowest possible price.)
A distribution phase is when large players that bought assets during in the accumulation phase begin to sell them off. When other market participants are more concentrated on buying the asset, the large players begin selling what they have previously acquired during the accumulation period.
However, as a result of this, the asset's supply grows. When the price of an asset tends to rise above a specific level, large-scale selling stops the price from increasing beyond that level, resulting in the formation of resistance levels. It is because a big portion of the item has been sold, preventing the price from growing higher. When something like this happens, now next thing that happens is a downward movement that leads to a gloomy market.
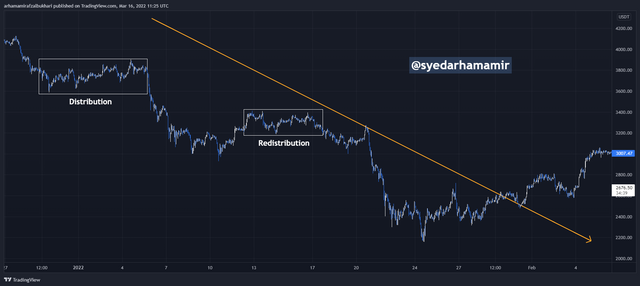
Due to the obvious sell off to take profit, the value of the trader assets will slow down then retrace to establish a high point during a downtrend, which is referred to it as a redistribution phase. Traders take advantage of this chance to execute sell orders.

3. Explain the 3 phases of the market and how they can be identified on the chart.

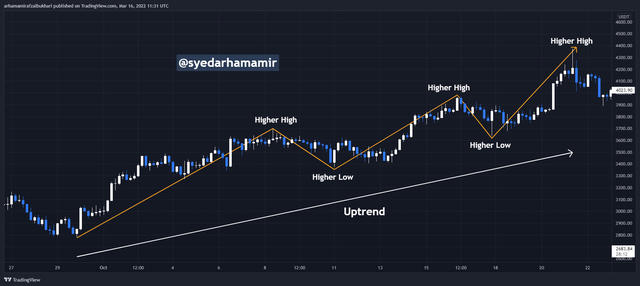
You'll notice that the market is making higher highs and lower lows if it's in an uptrend. Whenever the market is in an upswing, it means that demand for the traded asset is very strong, indicating that buyers are now in command of the markets. A picture of what we're talking about is shown below.
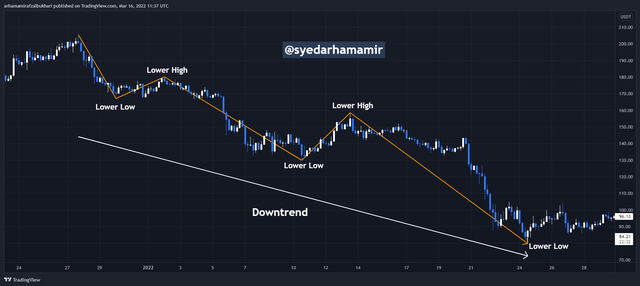
The first thing you'll notice if you're looking for a downtrend is just how the market is decreasing, with lower highs and lower lows. Whenever the market is in a downturn, it implies that the supply of the traded item in the market is extremely large, indicating that the market is now controlled by sellers. (In other words, selling pressure is greater than purchasing pressure). A picture of what we're talking about is shown below.
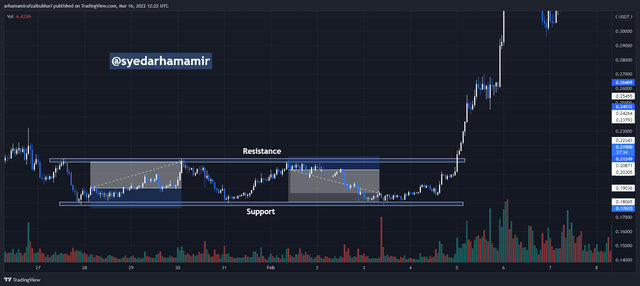
The market is in the area of bouncing off the levels of support and resistance throughout the accumulation and distribution phases. This means that demands are equal, and the market has gained enough traction to start a new trend. Following the conclusion of a trend, the following event is the sideways market, which occurs at the trend's midway. The breakout direction will tell you whether the value of the traded item will continue on its current trend or whether it will be reserve supported. Below is an illustration of a sideways market that demonstrates what we're talking about.
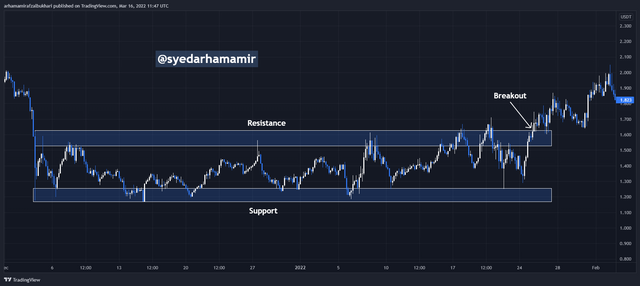
As the market continues to trend, there will be two sorts of trends. These are the impulse and retracement trends. An impulsive trend is one that moves in the opposite direction of the initial trend. The retracement trend, on the other hand, changes direction of the initial trend.

4. Explain the importance of the Volume indicator. How does volume confirm a trend? Do this for the 3 phases of the market (Screenshots required).

Many traders overlook the volume indicator because they don't understand why it's so significant in trading; nevertheless, I'll briefly explain why it's so crucial as a technical component.
Whenever it comes to trading, the volume indicator is critical in technical analysis or on our chart, as it aids us in verifying patterns and trends. The Volume Indicators is also essential since it allows traders to see how many assets have been bought and sold over a specific period of time. The volume Indicator, on the other hand, contributes to price action of the traded asset, which is one of its most essential features. The volume indicator, for example, provides early warnings whether the price of a traded item is about to stabilise or continue moving. It also assists us in determining when the market is more active:
Whenever there is a lot of interest in an asset and there is a lot of purchasing pressure, the volume indicators will show us a lot of volume. The high volume, represented by green coloured candles, suggests that there will be more buyers interested in acquiring the asset. The volume Indicators will also show whether the asset is in a downturn. The volume Indicator's red candles signal that the more sellers are eager to sell their asset, indicating a decline.
Confirmation of Trend using Volume Indicator
According to the Dow Jones Theory, a market movement, whether up or down, must be backed equally by volume growth. When we can see from the graph above, as the asset's price rises, the trading volume rises with it, and as the asset's price falls, the trading volume falls with it. Following the upswing rather than the decline is the ideal strategy for traders.
Consider the case of a marketplace where the traded asset's price is declining. Trading volumes should rise when the value of the traded item falls, and decrease when the price rises, so order is for volume to validate the trend. Take a look at the image below to see what I mean.
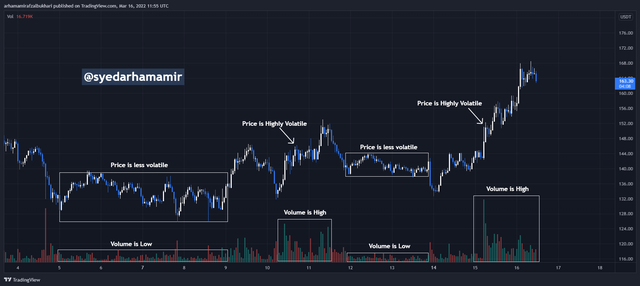
Looking at the picture above, we saw how trading volume grows even while the value of the traded item lowers, and how volume reduces as the value of the traded item rises. This signifies that the downhill movement is accompanied by a bigger volume (number) of transactions, resulting in a bearish market, as seen in the image above.

5. Explain the trade criteria for the three phases of the market. (show screenshots)

Trade Criteria for a Bullish Trend
The market will make higher highs and lower lows during a bullish trend. When the market moves in a positive direction, it indicates that buyers are all in charge. After you've seen this, you'll want to think about a few things before you make your purchase order.
Make that the traded asset's price is rising, with higher highs and lower lows. (i.e., the positive trend should be accompanied by an increase in trading volume). Wait for the traded asset's price to reach a low point in the retracement trend. Put a buy trade position just on development of a bullish candlestick after the major bullish trend has been reserved. The bullish engulfing candlestick formation or another candlestick pattern may be used as the target for a purchase order. Using a risk-to-reward 1:1 ratio or 1:2, set your Stoploss underneath the current retracement trend's low point. A screenshot of what we're talking about is shown below.
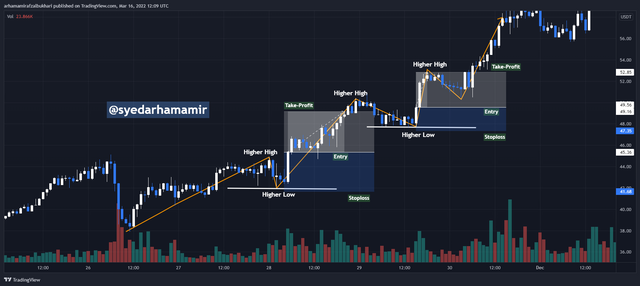
Trade Criteria for a Bearish Trend
The market will be make lower highs and lower lows while it is in a negative trend. Whenever the market moves in a negative trend, it indicates that the market is controlled by sellers. After you've seen this, you'll want to think about the following items before you place your sell order.
If you want to trade in a negative trend, make sure the value of the traded item is in a downtrend, with lower highs as well as lower lows and a higher trading volume. Wait for the traded asset's price to develop a high-level retracement trend. Put a sell trade position on the appearance of the a bear market candlestick pattern after the main negative trend has reversed. A bearish engulfing formation or similar candlsticks pattern can be used to place the sell order. A screenshot of what we're talking about is shown below.
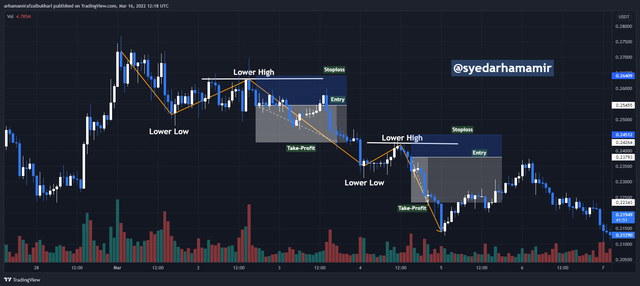
Trade Criteria for a Ranging Market
Because of the danger involved in trading the sideways market, it is not a simple market to trade. Beginner traders should steer clear from sideways markets unless they have a thorough understanding of them. In a sideways marketplace, the value of the traded item is often controlled, and breakout might occur in either way in the market. To trade the sideways market effectively, you must ensure that you use adequate risk management.
You, on the other side, focus on following information. Set your stoploss just above resistance level and open your sell trade at the resistance level. The take profit level should be established at the range's support level. Set a buy order entry at the range's support level, with a stoploss below the range's support level. Set the take profit level for this trade at the resistance line. The image below is an illustration of what we're talking about.

6. With the Trade criteria discussed in the previous question, open a demo trade for both Buy/ Sell positions.

Buy Trade
In the following picture, we can see that the price is in an uptrend as it is forming Higher Highs and Higher Lows. The price can be currently seen at its Higher Low which is a potential buying zone. Then, I used Tradingview's Paper Trading feature to take the demo trade. I placed my take-profit at the recent peak and my stoploss below the Higher Low while maintaining a decent risk-to-reward ratio.
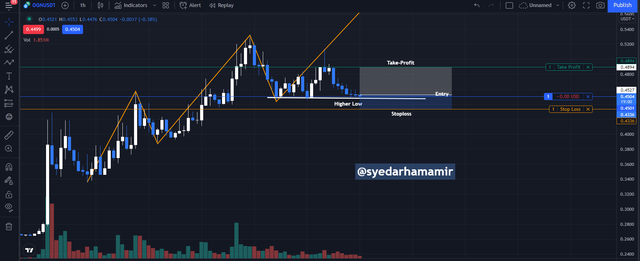
Following is a screenshot of the placed orders:

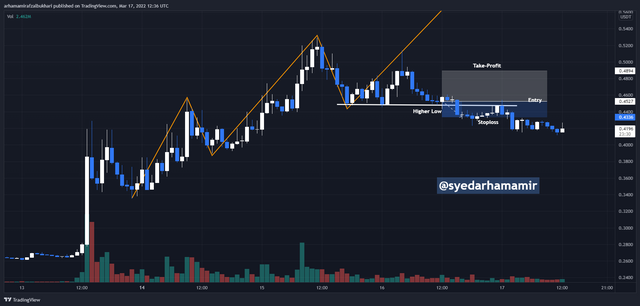
I waited for the results of my trade and the following screenshot shows that my Stop loss has been hit.
Sell Trade
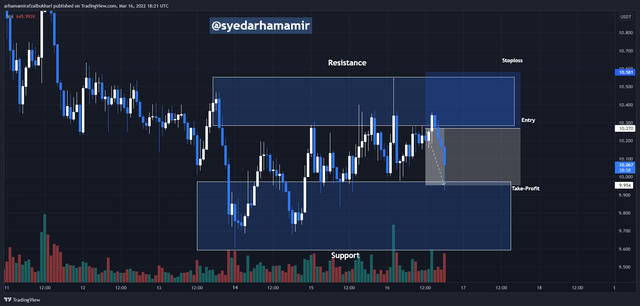
In the following image attached below, you can see two zones marked, support and resistance. The price is seen to be respecting these zones. Currently, we can see that the price is at its resistance and it indicates a bearish reversal. Therefore, I took a sell entry here. I placed my Take-Profit at the Support and my Stop loss above the resistance while maintaining a decent risk-to-reward ratio.
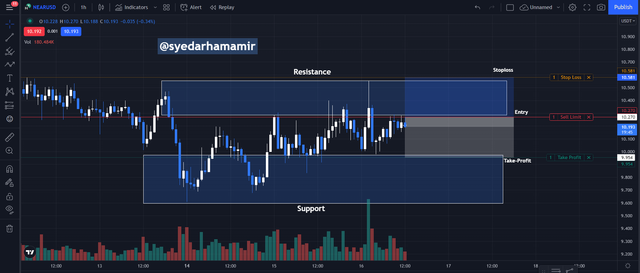
Below is a screenshot attached showing the orders placed:

The screenshot below shows the result of our trade. We have seen a retracement in the price and it has successfully hit our target point marking it as a win trade.


This Dow Jones Theory has been a trading theory which is still in use today. Understanding this idea will aid traders in their ability to spot market trends. Finally, knowing the Dow Jones Theory can assist us in determining the health of a market. At the end, I'd like to thank Professor @reminiscence01 for this amazing lecture. Thanks!
Hello @syedarhamamir , I’m glad you participated in the 4th week Season 6 at the Steemit Crypto Academy. Your grades in this Homework task are as follows:
Observations:
This is not a good example of the distribution phase.
Recommendation / Feedback:
Thank you for participating in this homework task.