[CRYPTO TRADING STRATEGY WITH MEDIAN INDICATOR]- Steemit Crypto Academy- Homework post for Professor @abdu.navi03 by (@syedarhamamir)
Hey Steemit!
Here is my homework post for Professor @abdu.navi03. It was a great lesson, and I hope you will enjoy reading my post.
.png)

1-Explain your understanding with the median indicator.
Technical indicators are instruments that are utilised in technical analysis. They aid in determining an asset's trend direction, strength, and momentum. Some indicators are ideal for determining trends, while others assess an asset's velocity and strength. A helpful indicator for determining an asset's trend is the median indicator. That really is, it is utilised to determine the price trend over a certain time period. It also calculates the market's volatility over a certain length of time. It depicts the average price difference between both the high and low points for a certain time period. The indicator consists of a thick line that is placed to the graph and changes colour from green to purple when an asset is in an uptrend and purple whenever the market is in a decline.
There is a bottom and top band on the indicator. The top band would be a green line by default, while the bottom band is a purple line. When price goes through EMA lines from bottom to top, that thick green line appears, and then when price goes through EMA line from top to bottom, the purple line appears.
2-Parameters and Calculations of Median indicator. (Screenshot required)
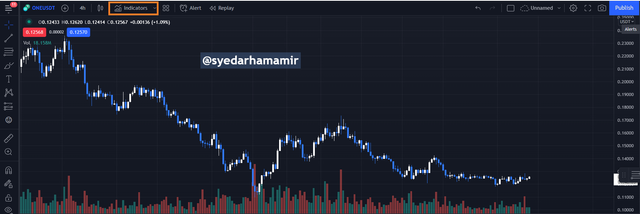
First of all, I'll show you how to use the trading view platform to add this indication to a chart. To add this indication to your trading view chart, go to top of trading view and click indicator, as seen in the image below.
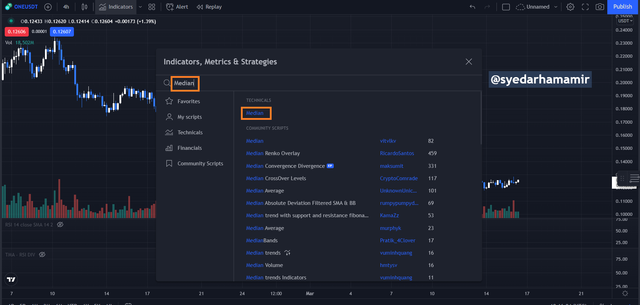
Then a search bar with an indication will display for you. Type "median" into the search field and hit enter. Then, as shown in the picture, it will provide a result for you. In the example below, click "media," which is represented by a red box.
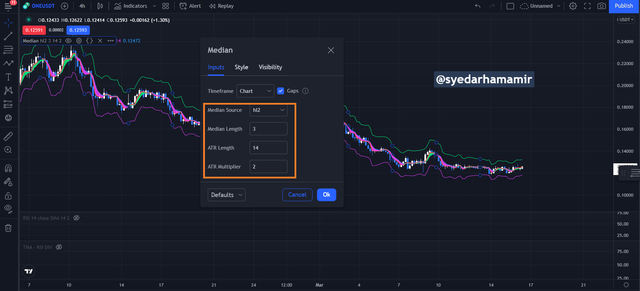
The indication is then applied to the chart, as shown in the picture below. We can see from the screenshot that the median indicator includes many parameters, each with its own function.
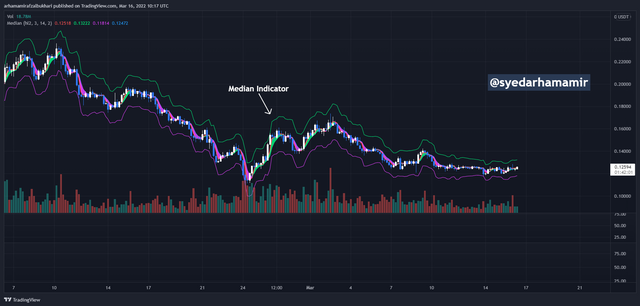
Following are the main parameters:
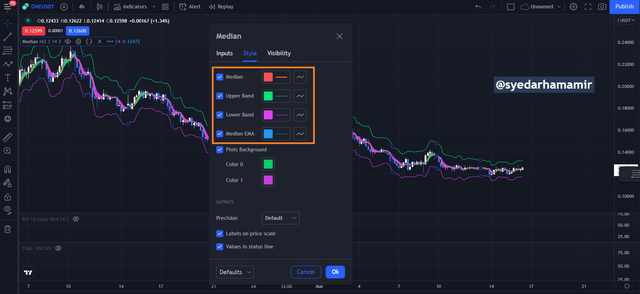
By standard, the higher band is known as the mean upper band, and this is a green narrow line that runs along the top of the price and functions as a level of resistance. The bottom band is known as the mean lower band, and this is a purple fine line that works as a support. As shown in the picture, the mean and mean EMA are indeed the centre lines that are constrained together to produce a thick line. As shown in the picture below, the default median length is three. This is the information that is used to calculate the media length. The ATR multiplier, which has a default value of 2, aids in the computation of top and bottom bands.
3-Uptrend from Median indicator (screenshot required)
When price consistently makes higher highs and higher lows, it is considered to be in an uptrend or bullish trend. Traders may notice uptrends in the market in a number of ways. An asset's uptrend or decline may be detected using market structure, technical indicators, trendlines, and other indicators.
Surprisingly, the median indication may be utilised to assess whether or not a trend is up or down. When the median line crosses the EMA line, the trend is considered to be upward. When this occurs, the centre line will become green, indicating that the market is on the rise. The image below is an illustration of a bullish trend.
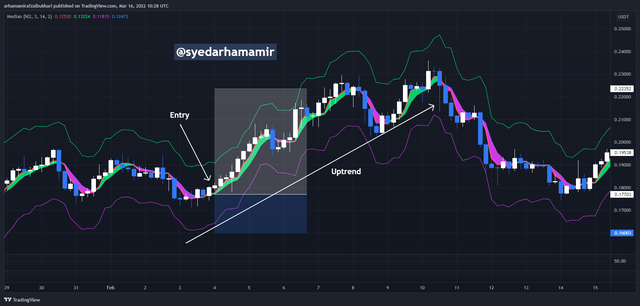
When the media line is observed just above EMA line and the price moves to the upward, the thick line becomes green, as seen in the image above. At this moment, traders might start a buy position with a stop - loss order below the price's previous low. At the resistance level, a take profit order may be placed.
4-Downtrend from Median Indicator (screenshot required)
A decline experiences the inverse of what is mentioned above. The median line should be below EMA line for an assets to be in a decline, and at this time, the thicker middle line will become purple, indicating that the asset is beginning to move in a negative direction.
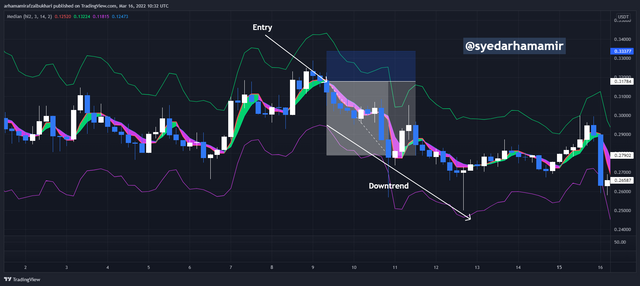
The thick green line, which indicates a bullish trend, becomes purple as quickly as the EMA line crosses the median line, as seen in the image above. And now, with the arrival of the purple line, we can observe that the asset has traded downward. Traders might enter a sell position here, with a stop loss placed just above the previous resistance level and a take profit order set to the next support level.
5-Identifying fake Signals with Median indicator(screenshot required)
Indicators are effective, but when used in combination, they are much more so. This will aid in the detection of misleading signals that might occur when just one indicator is employed. The median indicator is a tool for detecting market trends. As a result, several non-trend-based indicators may be used in conjunction with the median indicator to increase efficacy and detect bogus signals in the market. I've included both the median and RSI indicators in the screenshot below to help spot misleading market signals.
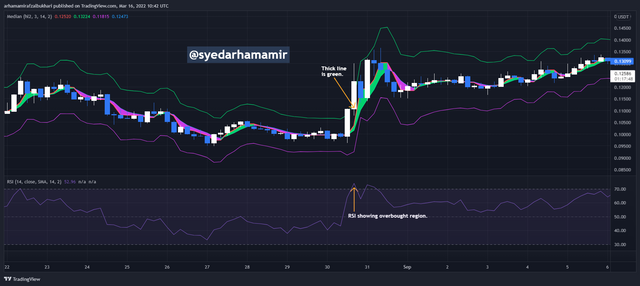
The RSI indicator has reached the overbought area, indicating that a sell order has been placed and that the price is set to become bearish. But what did the median indicator say? Because the thick lines is still green, the median indicator did not alert us to this sell indication. As a result, this is a misleading indication to sell the asset right now. The two indicators must produce the very same information at the same time for an entry to be legitimate. That instance, for a purchase signal, the RSI should be oversold while the median indicator displays a green thick line. In addition, the RSI signal must be in the overbought range for a sell indication, as well as the median line should display a purple line, both of which corroborate a negative trend.
6-Open two demo trades, long and short, with the help of a median indicator or combination that includes a median indicator (screenshot required)
Long Trade
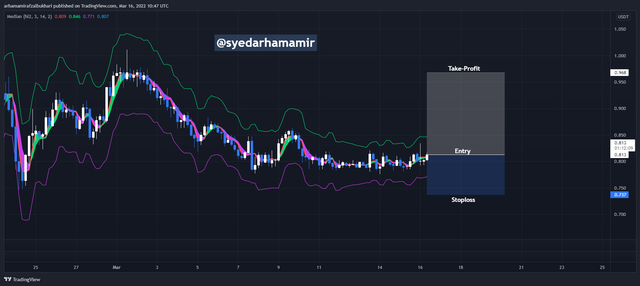
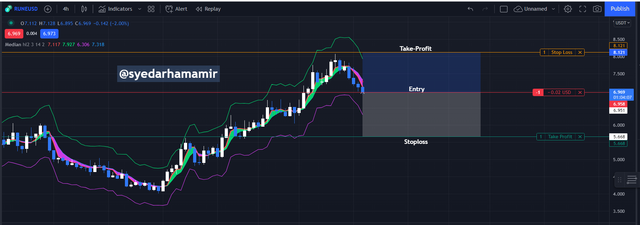
The asset is now on a negative trend, as seen by the price making a sequence of lower highs with lower lows, as shown in the picture. We can also observe that the median indicator's thick line is purple, indicating that the trend is negative.
However, at a certain time, the median line crosses the EMA line, and the heavy purple cloud becomes green, indicating a trend reversal. I then placed a buy order.
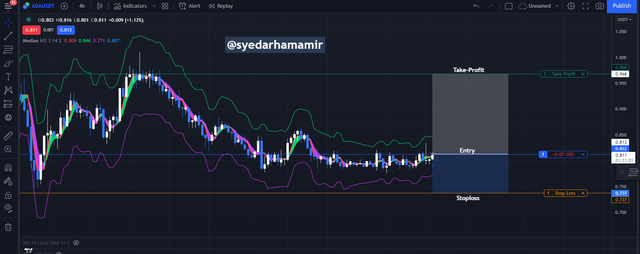
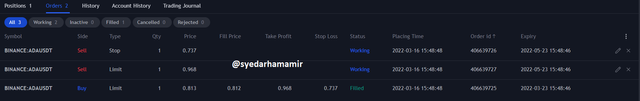
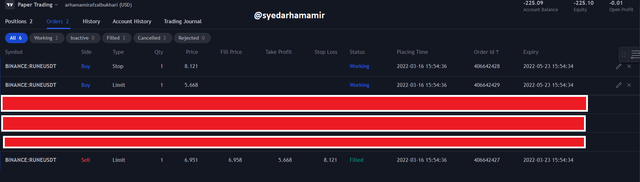
The screenshot below shows the order placed:
Sell Trade
In the image attached below, it can be seen that the thick middle line has turned purple which indicates a bearish trend. Also, we have seen the formation of continuous bearish candlestick which also indicates a bearish trend. After noticing this, I decided to place a sell order.
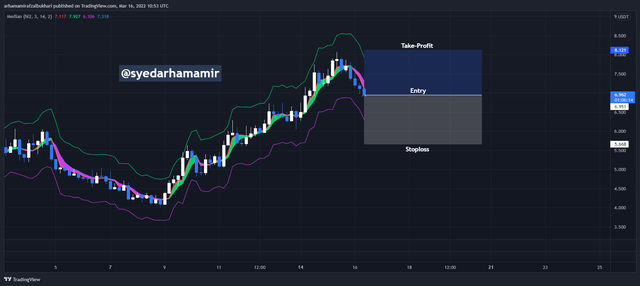
The screenshot below shows the order placed:
To identify an asset's trend, the median indicator is employed. In other words, it's utilised to determine the price trend over time. It's also used to figure out how volatile a certain asset is in the market at a given moment. It is not recommended to utilise the median indication as a stand-alone indicator, despite its strength. The best way to utilise indicators is to mix them.
I've outlined my knowledge of median indicator in this article, as well as the parameters and how it's calculated. Both the bull and bear identification of the median indicator were also discussed using screenshots. Finally, using the median indicator technique, I executed equal buy and sell orders. Finally, I'd like to thank Professor @abdu.navi03 for giving us such an amazing lecture. Thank you!