Steemit Crypto Academy | Season 2: All About Price Forecasting | Homework task for @stream4u
Hello, my name is Suhiel. Today I'm going to try to do my Steemit Crypto Academy Homework hosted by professor @stream4u who talks about All About Forecasting Future Crypto Prices. Actually I have very little knowledge about cryptocurency, but I will try to predict in a slightly different way from other people predict. on this occasion I will discuss the future Bitcoin forecast. whether bullish or bearish.
What Is Price Forecasting?
Price forecasting is a prediction that investors and traders must do in predicting future prices. This method will make you a successful person by determining when the asset you want to buy. Of course, analysis with various aspects will determine the choices you will make in the future. You can predict which assets will increase in a period of a week, a month, a year or even a few years later.
To predict an asset for investment requires effort, fundamental knowledge and analytical skills in predicting future prices. therefore you have to really pay attention to this and make a good analysis to make your decision right for your investment or trading.
Most people do price analysis like the following 3 methods:
Technical Analysis
If you are an investor and trader, you can perform technical analysis to predict the future price of an asset. Lots of data that you can get by doing technical analysis such as by looking at market trends, candle charts, and price movements. Indeed, by analyzing technically the data that you collect may change, but you have done your best to maintain the assets so that you will get benefits in the future.
Fundamental Analysis
I think fundamental analysis is very important. because, as an investor or trader, you can perform fundamental analysis to predict the future price of an asset. with this analysis, you don't need to pay attention to the direction of market trends, you can immediately see or find out the company that owns the asset or you follow the news that supports what company assets you buy. If the fundamentals of the company are good in your opinion, you no longer need to look at current market trends.
Sentimental Analysis
This sentimentality greatly affects the price of a market. You are also advised to follow various media, news to find out the direction of market trends. By following trusted media, you can predict the price well for your assets in the hope of getting a profit in the future.
Why is Price Forecasting needed?
Getting a profit is the goal of an investor or trader when they invest or invest. Forecasting future prices is necessary to achieve that goal. this is a strategy that requires good analysis so that the wishes of investors or traders run well. With this forecast will let you know when you have to buy or sell your assets so that you get a profit.
By using the three analyzes above, you can determine when you have to enter the market, meaning when you can buy or sell your assets. If you can predict the price well, use the three methods of Technical, Fundamental, and Sentimental analysis. I am sure that you will be a successful investor or trader in the future.
What method do you feel the most for Price Prediction / Forecasting
There are many ways to predict a price and it is very important. all interconnect and support each other to achieve our goals as investors. But on this occasion technical analysis is one of the ways I predict future prices. As an example I have followed the development of Bitcoin since it first appeared until now in a way of analysis that may be different from others.
This is my analysis. I don't recommend my friends to follow me. however, I believe in my current way of analysis. Because this has helped me predict the price a while ago.
Take a Crypto Asset Chart and explain how to do Price Forecasting?
Here I will try to give my prediction using the Bitcoin Rainbow Chart. Why did I choose to analyze Bitcoin when there are many other coins on the market? Because I see bitcoin is the king of coins that can move alt coins. If we see bitcoin going down, other cryptocuncy automatically also has a decline, as happened in recent months.
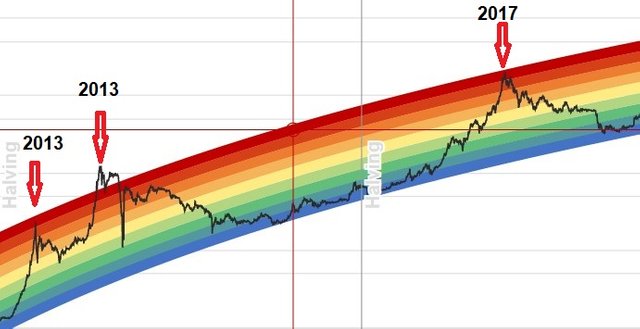
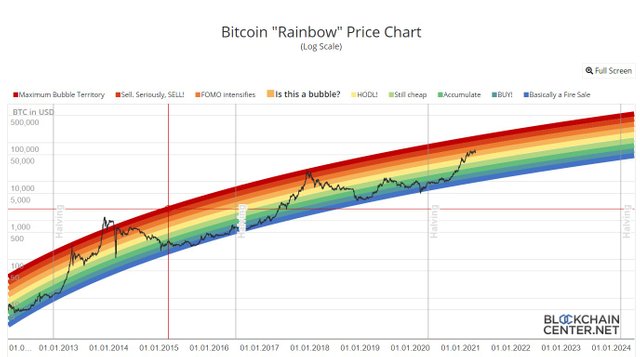
So because of that I am trying to give you how to see the movement of Bitcoin using the Bitcoin “Rainbow” Price chart. This technique works to combine some of the data that has existed since bitcoin first appeared from 2013 to 2021 at this time. So, if you pay attention to every Bitcoin touching the red area in the rainbow, chances are that bitcoin will have a big correction, especially until it comes out of the rainbow line, it can make bitcoin drop straight down. If btc has decreased to the blue line, that's when we buy bitcoin and sell again if it touches the red area in the rainbow.
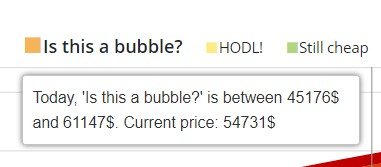
At the moment, Bitcoin is in the “Is this a bubble?” Zone. is between 45176 $ and 61147 $. Current price: 54731 $. Currently we are not in the red zone as we know that bitcoin has not reached the red area where that area is the area where we sell our bitcoin assets. We can see, currently we are in the middle area of this Bitcoin “Rainbow” Price chart.
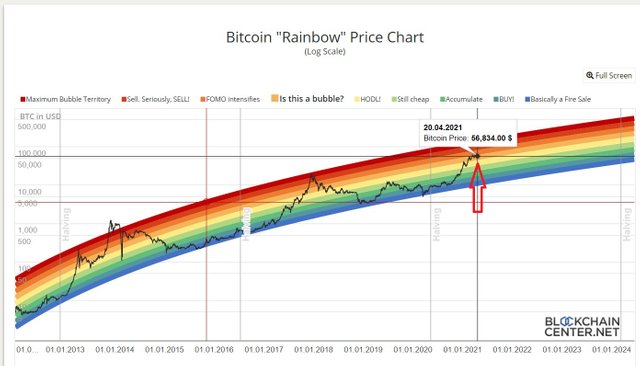
Is this a bubble? When we are in the middle area like this, it actually signifies something. There are 2 potential scenarios if we look at bitcoin at this point. Pay attention to these charts, first if bitcoin continues the upward trend, then all alt coins will also experience an increase. Vice versa, if bitcoin manages to touch the support that I described on the chart, we can be sure that all alt coins will also experience a decline.
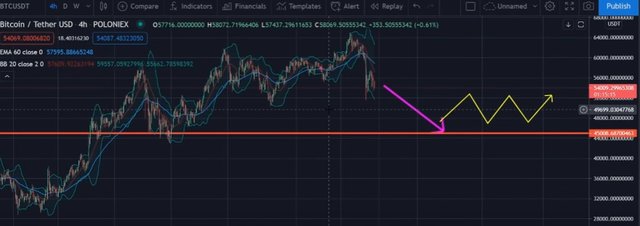
Don't panic, in my opinion, this is a very reasonable correction where what has happened on the previous chart bitcoin has also experienced a correction and then there is an upward price movement again. In my opinion, when bitcoin touches the support line, this is a big discount for those of us who want to increase investment capital..
As we know, if bitcoin has reached the peak or the red zone like the one on the "Rainbow" Price chart, bitcoin will have a very large decline until it touches the blue area again where that area is the buy back area.
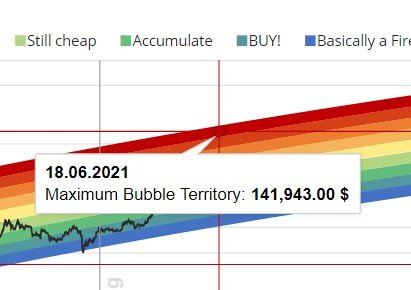
If we measure the red area that will occur in the future, bitcoin will probably be around $ 141.943 or it could even exceed that price. It should be our consideration to sell some of our assets if we feel that we have made enough profit.
For this short to medium term analysis, I see bitcoin will experience a reasonable correction which will then return sideways or bitcoin will increase again until it reaches the highest ATH in this period. And that will also be followed by other alt coins.
Thank you for reading my blog, I hope it is useful for all of you.


Shared on Twitter : https://twitter.com/Suhiel1991/status/1385254681849462793