Trading Steem with the Wyckoff Method.

Describe the three fundamental laws of the Wyckoff Method: the Law of Supply and Demand, the Law of Cause and Effect, and the Law of Effort vs. Result. Explain how each law can help predict the price movements of the Steem token within the cryptocurrency market.
➜ The Law of Supply and Demand.
This law is the basis for market analysis. Price changes from a difference between supply and demand wherein the sellers considered supply and buyers considered demand. When demand goes above supply, the asset prices will increase, when supply goes above demand, the asset prices will decline.
With Steem Token.
Observing buying and selling volumes can help understand Steem token price fluctuations. The price of Steem is likely to go up if there is a lot of buying pressure means demand but not enough sellers means supply. The price of Steem is likely to go down if there is a lot of sellers which means supply but not enough buying pressure means demand. By tracking changes in Steem token trading volume and price movements, we can predict potential price changes based on demand and supply movement.
➜ The Law of Cause and Effect.
This rule asserts that the collection or circulation of an item means the cause will result in further price changes means the effect. Collection occurs when major players acquire an asset, whereas distribution occurs when they sell.
With Steem Token.
In the Steem market, a long period of accumulation that possible wherein the investors buy Steem token with high quantity. This indicates that a big upward price increase is likely possible in Steem token. Similarly, if Steem token is down over time, a decline may be expected when these major investors begin to sell their holdings.
During the period when the volatility is low but buying volumes are increased. This may signal that growth is taking place, which could lead to a Steem token price increase. Likewise when sell volumes increase may, this indicate the start of a distribution timing, signal a likely Steem token price decline.
➜ The Law of Effort vs. Result.
This law analyzes the connection between effort means volume and result means price movement. If the asset price is moving rapidly with little volume, it may suggest weakness in the move. Similarly, heavy volume without a major price movement could point to an incoming trend reversal.
With Steem Token.
Understanding price movements with respect to trade volume is important. If Steem price goes up with small volume, it can suggest that the uptrend is weak and will reverse soon. If Steem price goes up with massive volumes, it shows strong demand from investors and suggests the uptrend. On the other hand, if you notice a lot of volume but no price movement, it could mean that the market is getting ready for a breakout in its opposite direction.
Explain how the Wyckoff Method uses the principle of cause and effect to anticipate price actions. Provide an example of how 'cause' can be quantified (such as accumulation/distribution) and how 'effect' can be expected, using Steem’s historical price data to illustrate your point.
The principle between cause and effect is to predict future price movements through examining collection or distribution times which mean the cause and predicting future price action which mean the effect. In this the cause occurred when the market buys or sells an asset over time, then effect occurred when buy or sells an asset is complete, the price either rises if buy more then sell or falls if sell is more than buy. The bigger the cause means the longer the buy or sell, the bigger expected effect with regard to the asset price change.
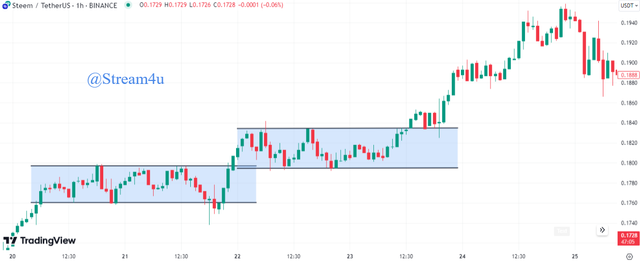
In the above Steem/USDT historical price chart, we can see Steem token was trading between 0.1759 to 0.1797 from 20th August 6.30 to 21st August 22.30. If a Steem buy more in this duration, this will quantified and create a cause for Steem/USDT future price action.
Later some time, the Steem/USDT has breakout the 0.1797 and reaches to 0.1834, this breakout is actually an effect that occurred due to previous cause. The more Steem buys, the Steem price moves stronger after breakout happens.
We can see the above action occurred again when Steem/USDT moved between 0.1797 to 0.1834, and then breakout occurred at 0.1834 and Steem token price reaches to around 0.1950.
Explain how the Law of Effort vs. Result can be observed in the trading volume and price movements of the Steem token. Use a real chart example where this law was evident in the Steem market, and discuss what insights a trader can derive from this analysis.
The Law of Effort vs. Result can be observed in the Steem token market by examining how volume fluctuations are associated with price fluctuations.
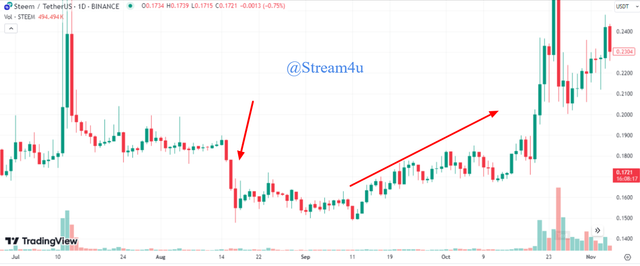
The above image Steem/USDT price chart, considering volume and price action as a result, we can see Steem price was trading at around 0.1870 and dropped sharply from this level. But there was no selling volume or the volume was unchanged at this level, still the price fell. This indicates that the price action is not supported with the volume hence it is possible for a trend reversal soon. Accordingly, we can see further the price started moving up with respect to the volume.
What insights a trader can derive from this analysis?
● Monitoring the Law of Effort vs. Result helps traders to gain important understandings into the strength or weakness of Steem's price movements.
● If the price moves considerably without much volume, it may indicate a weak trend, pointing traders to future reversals.
● If volume grows heavily without any price movement, it may suggest that the market is taking in the pressure and will either break out or reverse soon.
● Observing divergences between effort which is volume and result which is price helps traders to determine whether the present trend is stable or collapsing.
Somewhat such kind of analysis helps traders to avoid false breakouts or crashes and better timing their trades entry and exits in the Steem market.
Discuss the key phases of the Wyckoff Method: accumulation, markup, distribution, and markdown. Provide historical price actions of the Steem token as examples of each phase and explain how a trader can identify the current phase of the market.
Accumulation Phase.
This phase happens when big players silently begin buying an asset at low prices, taking the available supply without effecting a major rise in prices.
- With Steem token example.
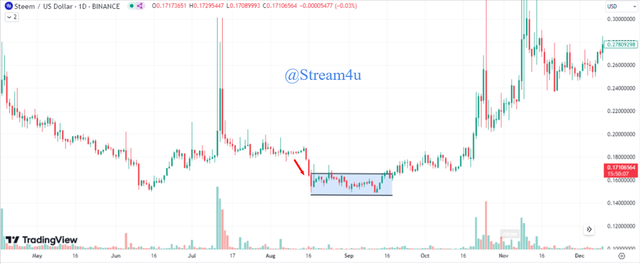
In the above Steem/USDT price chart, we can see the price sharply fall but there was no similar volume. Later the price starts moving up slowly which indicates the buying is happening. This duration or the pattern is an accumulation phase.
The trader can identify the accumulation phase of the current Steem/USDT market by looking for a reverse trend after a downtrend with rising volume but no further fall in a price.
Markup Phase.
The markup phase comes after accumulation. Once the large players have collected their holdings, demand begins to greater than supply, causing prices to rise. This phase can be identified by an upward trend with higher highs and lows.
- With Steem token example.
Continuing above the Steem/USDT price chart, we can see that the markup phase comes after accumulation as Steem/USDT price is rising slowly by following higher highs and lows which indicates the large players may increase their holdings which creates a demand greater than supply.
The trader can identify the markup phase of the current Steem/USDT market by understanding an upward trend with greater highs and lower lows, along with increased volume.
Distribution Phase.
The distribution phase is the opposite of accumulation. Big players that accumulated during the earlier phase are now slowly selling their stakes, bringing the asset to market at greater prices. This phase is frequently characterized by sideways movement following a strong upward trend.
- With Steem token example.
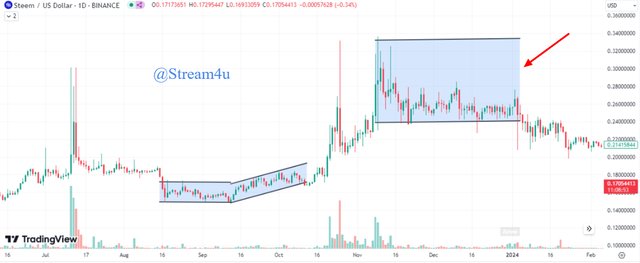
Continuing above the Steem/USDT price chart, now we can see how the Steem/USDT price fluctuates in range after picking the high point that is after breaking out the previous highs and lower lows resistance. This zone can be a Distribution Phase wherein the big players who were having their holdings are now started selling showly.
The trader can identify such a distribution phase by observing a sideways movement means asset price moving within a price range, touching support and resistance at highs after a strong upside movement.
Markdown Phase.
The markdown phase starts after the distribution phase, when selling is more than buying, forcing prices to fall. This phase is shown by a down side trend in the market.
- With Steem token example.
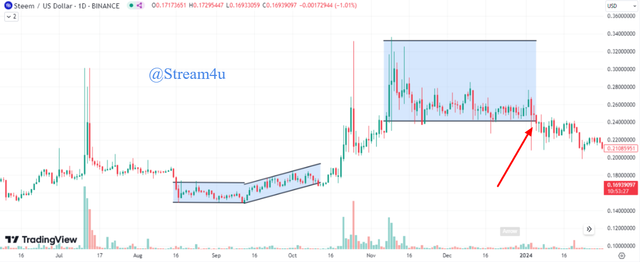
Continuing above Steem/USDT price chart, we can see that the price has given the breakout to the support level that formed at the pick point of Steem/USDT price, this indicate that distribution Phase is completed and now its start of markdown phase wherein the selling giving all pressure than the buying due to which the Steem/USDT price gets breakout at support level and price fall further, the trend changed to down side.
The trader can identify the markdown phase by Identify breakout below the support level, a downward trend formed by lower highs and lower lows, which is sometimes supported by increased sell volume. Also, traders can use at least 2 to 3 combined technical indicators that can confirm the trend reversal at the price pick point.
Outline the step-by-step process for applying the Wyckoff Method in trading the Steem token. Discuss how to identify the accumulation phase, signs of supply/demand tests, and the transition to a markup phase. Use a real example of the Steem token to illustrate entry and exit points based on the Wyckoff Method.
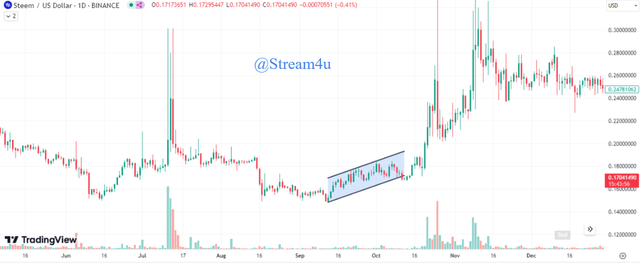
To explain this point, I will use the above chart in combination with what the possible entry and exit points could be. Below is the same.
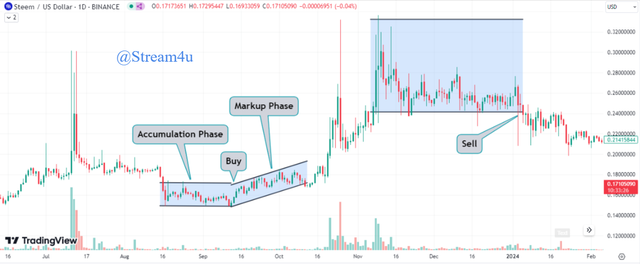
Step-by-Step process for applying the Wyckoff Method.
1️⃣ From left, we can see the price sharply fall without having much volume in Steem/USDT. The accumulation phase can be identified after a sharp fall and moving within a specific price range with increase small volume.
2️⃣ Here the price chart creates a support and resistance level wherein it is tested the supply/demand with slowly increasing buying volume.
3️⃣ After the accumulation phase ends, the Steem/USDT price has given breakout at the resistance and started moving with higher low formation with increasing volume.
4️⃣ After breakout occurs at the accumulation phase at the resistance level, the markup phase starts. Here, we can place buy trade orders by keeping stopp loss at the previous support level.
5️⃣ Now, it will hold till the price reaches high and then fall. When price falls, we will monitor if price fluctuates within a price range again like between support and resistance at the pick point. This zone is known as the Distribution phase.
6️⃣ When price breaks out to the Distribution phase at the support level, it starts the markdown phase. Once breakout occurs we will place sell trade order and sell our holding to book the profit.
Disclaimer: The information provided in this blog is for educational and informational purposes only. It should not be construed as investment advice or a recommendation to buy or sell any securities mentioned. Investing in the stock and crypto market involves risks, including the potential loss of principal. Readers are encouraged to conduct their own research and consult with a qualified financial advisor before making any investment decisions. The author of this blog is not liable for any losses or damages arising from the use of the information provided herein.
Author,
@steam4u
If you like this blog, you can join me in the comment section of this blog.
On Twitter X - Trading Steem with the Wyckoff Method..
Upvoted. Thank You for sending some of your rewards to @null. It will make Steem stronger.
That's it.
👍🏽
So this was hard. And you need 5 days to complete. Well, at least now I know you didn''t back down from this challenge. And it's good.
Yes buddy, Office work, then my morning trading time in Indian market. I can able to manage time to be active on here so trying to complete in parts.
Learning about Steem Token trading using the Wyckoff Method is an interesting experience. This post highlights Three basic Laws the Law of Supply and Demand the Law of Cause and Effect and The Law of Effort and Result.
This post presents a practical analysis of these three rules and how they can be applied to Steem token trading.
!upvote 20
💯⚜2️⃣0️⃣2️⃣4️⃣ Participate in the "Seven Network" Community2️⃣0️⃣2️⃣4️⃣ ⚜💯.
This post was manually selected to be voted on by "Seven Network Project". (Manual Curation of Steem Seven).
the post has been upvoted successfully! Remaining bandwidth: 35%
Your post has been rewarded by the Seven Team.
Support partner witnesses
We are the hope!
Hi @stream4u you have explained wyckoff method greatly.
Accumulation zone predicts that the market is absorbing the investments and becoming ready for the next boom. And the after the accumulation zone suddenly markup phase starts.
And similarly distribution phase is the preparation of a downtrend. In the distribution phase the big investors and institutions starts distributing their assets to retailers and after this phase markdown starts.
Traders can use this method to predict the phases of the market as well as current phase of market.
Thank you for sharing your thoughts.
You are welcome.
The Wyckoff Method is the trading technique which was created by Richard D. Wyckoff at the beginning oftwentieth century and based on the usage of cycles and the price movement. It focuses on trends on supply and demand in the marketplace so that the trader can determine trends within the market and its fluctuations. For instance, when it comes to price variations traders can study volumes in order to determine when to enter or exit. You have depicted the screenshots in a very beautiful way which is very well understood. Best wishes to you my friend.