Steemit Crypto Academy Contest / SLC S21W5 : Advanced Strategies Using On-Chain Data and Sentiment Indicators

Hello noble steemit friends, I continue to pray and always be grateful for the blessings of the Almighty who has given health, opportunity for a long life to continue working here and I also pray for my brother who has held this event and I am happy to be able to participate in the exciting challenge organized by the SteemitCryptoAcademy community I pray in good health, amen ya rabbal alamin🙏.
Maybe that's all I can say about my beginnings here and the first time I tried to learn because I was still a beginner and to share experiences and hard work in writing articles in this great crypto academy.😊
Question 1: Understanding On-Chain Data Metrics
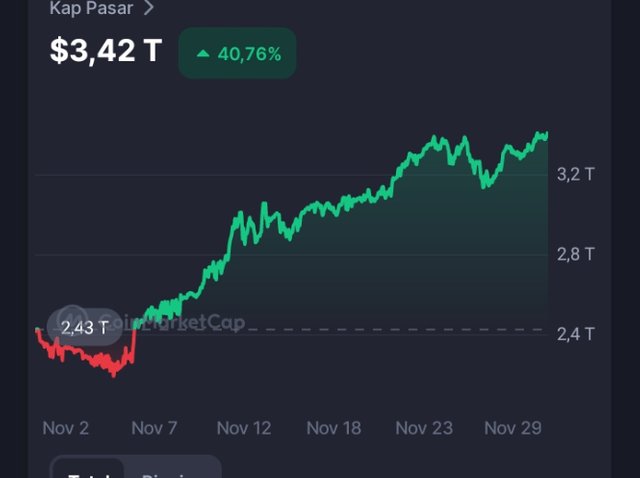
Integrating on-chain data with sentiment indicators is a sophisticated approach to understanding markets, especially in the crypto sector. On-chain data provides insights into activity on the blockchain, while sentiment indicators show the emotions and views of the market. By combining the two, traders and analysts can make better decisions based on market trends and behavior.
What Is On-Chain Data?
On-chain data includes information derived from the blockchain, such as:
- Active addresses: The number of addresses involved in transactions in a given period.
- Transaction volume: The total value of transactions processed on the network.
- Number of tokens on exchanges: Indicates liquidity and potential selling pressure.
- Hash rate: Indicates network strength (for PoW-based blockchains).
- Number of whales: Large addresses that hold a significant proportion of the total token supply.
Integrating with Sentiment Indicators
Here are some ways on-chain data can be combined with sentiment indicators for market analysis:
- Using On-Chain Activity to Confirm Sentiment
- When the Crypto Fear & Greed Index shows extreme fear, but on-chain data shows increased active address activity and transactions, this could indicate silent accumulation by investors.
- Conversely, high bullish sentiment, followed by large withdrawals of tokens from exchanges to personal wallets, could indicate long-term investor confidence.
- Analyzing Whale Behavior and Sentiment
- Whale Movement: If whales start sending tokens to exchanges when sentiment is showing greed, this could be a sign of impending selling pressure.
- Bearish sentiment followed by whales withdrawing tokens from exchanges could indicate accumulation, providing an opportunity to buy.
- Correlation of Trading Volume and Sentiment
- High trading volume with bullish sentiment usually indicates strong market confidence. - If high volume occurs during bearish sentiment, this could indicate significant selling pressure.
- Exchange Flow and Sentiment Indicators*
- Net Exchange Inflow (more tokens entering exchanges than leaving) indicates potential selling pressure.
- If this occurs when sentiment indicators such as the Fear & Greed Index are in the fear zone, the bearish trend is likely to continue.
- On-Chain Staking Data and Sentiment
- An increase in staking of tokens on a blockchain when sentiment shows extreme fear can be a sign of investor confidence in the long-term potential of the project.
- Conversely, a decrease in staking when sentiment is bullish could indicate profit-taking.
Case Study Example
Let's say you are analyzing Bitcoin:
- Crypto Fear & Greed Index: Shows a reading of "20" (fear).
- On-Chain Data:
- BTC withdrawals from exchanges are increasing.
- Active addresses are increasing.
- Transaction volume remains stable.
Interpretation:
While sentiment is fearful, on-chain data shows investor accumulation (withdrawal from exchanges). This could be a sign of a short-term bullish reversal.
Advantages of This Approach
- Deeper Insight: Combining market emotions and actual activity data provides more complete insights.
- Signal Confirmation: On-chain data can strengthen or weaken the confidence in signals given by sentiment indicators.
- Better Opportunities: Early detection of potential trend reversals or continuations.
With this integration, you can make smarter decisions in trading and investing in the crypto market.
Question 2: Using Sentiment Indicators to Analyze Market Trends
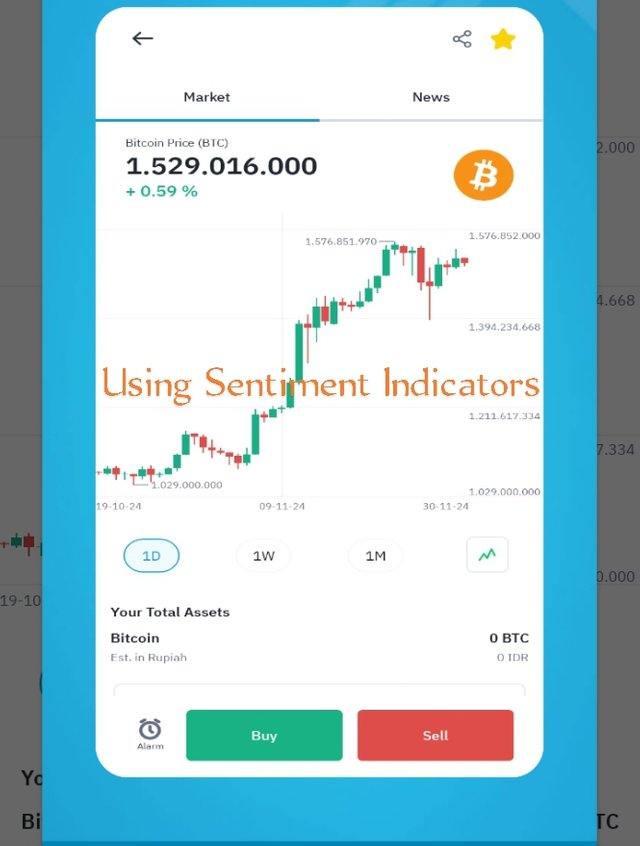
Market sentiment indicators are essential tools for analyzing the collective behavior of market participants, helping to predict price trends and understand market dynamics. In the context of crypto, they leverage quantitative and qualitative data, including on-chain activity, social media, and trading activity. Here’s how to use sentiment indicators to analyze market trends:
1. Types of Sentiment Indicators
a. On-Chain Sentiment Indicators
- Net Unrealized Profit/Loss (NUPL):
- Measures the level of profit or loss that has not been realized by holders.
- Interpretation:
0 (positive): Holders are generally in profit, can indicate optimism.
- <0 (negative): Holders are in loss, potential bearish sentiment.
- Market Value to Realized Value (MVRV):
- Comparison between market capitalization (market cap) and realized value (realized cap).
- Interpretation:
- MVRV > 1: Asset may be overvalued (potential correction).
- MVRV < 1: Asset undervalued (potential bullish).
b. Social Media and Community Activity
- Volume Mentions:
- The number of mentions of a particular asset on platforms such as Twitter, Reddit, or Telegram.
- Interpretation: Spikes in talk are often associated with extreme euphoria or fear.
- Sentiment Analysis Tools:
- Tools such as Santiment analyze the positive or negative tone in social media conversations.
- Interpretation:
- Extreme positive sentiment: Potential overbought.
- Extreme negative sentiment: Potential oversold.
c. Investor Behavior
- Funding Rate:
- Used in the derivatives market to understand the direction of the majority of traders (long or short).
- Interpretation:
- High positive funding rate: Traders are mostly long (potential bearish reversal).
- High negative funding rate: Traders are mostly short (potential bullish reversal).
- Exchange Flows:
- Inflow/outflow to the exchange (inflow/outflow).
- Interpretation:
- High inflow: Selling pressure increases.
- High outflow: Holders tend to hold assets (potential bullish).
d. Fear and Greed Index
- Scale 0-100:
- Low numbers (0-24): Extreme Fear (potential buying opportunity).
- High numbers (75-100): Extreme Greed (potential correction).
2. How to Use Sentiment Indicators
a. Identifying Market Trends
- Use sentiment indicators to see if the market is in bullish, bearish, or sideways conditions.
- Example:
- If the Fear and Greed Index shows "Extreme Fear," this could be an accumulation signal.
- If the MVRV is very high, this could indicate a potential correction.
b. Combination with Other Analysis
- Technical Analysis (TA):
- Combine sentiment indicators with chart patterns for confirmation.
- Example: If sentiment shows optimism but chart patterns show strong resistance, a possible breakout needs further verification.
- Fundamental Analysis (FA):
- Use sentiment in conjunction with project data such as technology developments, partnerships, or product launches.
c. Measuring Market Timing
- When sentiment is extreme (positive or negative), use it to decide when to enter/exit.
- Example:
- Extreme fear often creates buying opportunities.
- Extreme greed often precedes price declines.
3. Tools to Track Sentiment Indicators
- Glassnode: On-chain data such as MVRV, NUPL.
- CryptoQuant: Exchange flow, funding rate.
- Santiment: Social media sentiment analysis.
: Integrating On-Chain Data with Sentiment Indicators
Integrating on-chain data with sentiment indicators is a powerful strategy to understand the crypto market holistically. This approach helps combine quantitative analysis (from blockchain data) with qualitative analysis (market emotions and behavior). Here’s how to do it:
1. Why Integrating On-Chain Data and Sentiment Indicators Matters?
- In-depth Perspective: On-chain data provides insights into user activity and network health, while sentiment indicators show market psychology.
- Trend Prediction: This combination allows you to identify more accurate buy/sell opportunities.
- Risk Management: Using both helps avoid making decisions based on only one dimension (e.g., sentiment without fundamental data).
2. On-Chain Data Relevant to Sentiment
Here are the on-chain data metrics that are often associated with market sentiment:
a. Transaction Volume
- Analysis: High transaction volume during bullish sentiment indicates strong conviction from market participants.
- Integration: If high volume coincides with positive sentiment on social media, the bullish trend is more valid.
b. Number of Active Addresses
- Analysis: An increase in active addresses often indicates new participation in the network.
- Integration: Combine with the Fear and Greed Index to see if new participation is driven by fear (capitulation) or greed (euphoria).
c. Exchange Flow (Inflow/Outflow)
- Analysis:
- High inflow: Holders may be preparing to sell.
- High outflow: Holders tend to hold assets.
- Integration: If high inflow occurs when market sentiment is showing fear, selling pressure may increase.
d. Market Value to Realized Value (MVRV)
- Analysis: This ratio indicates whether an asset is overvalued or undervalued.
- Integration: If MVRV is low but sentiment is extremely negative, there may be a buying opportunity.
e. Whale Activity
- Analysis: Whale activity (large wallets) often influences the market.
- Integration: If whales accumulate during fear sentiment, this can be a bullish signal.
3. Sentiment Indicators for Integration
a. Fear and Greed Index
- Integration:
- Combine with exchange inflow/outflow. Example: High Fear + low inflow = accumulation opportunity.
- If Greed is high + transaction volume spikes, be aware of potential corrections.
b. Social Media Sentiment
- Integration: Analyze the spike in positive sentiment with on-chain data:
- High positive sentiment + NUPL indicates holders are optimistic but wary of overbought risks.
- Extreme negative sentiment + low network activity can indicate an oversold market.
c. Funding Rate
- Integration: Combine with hash rate or network activity:
- High positive funding rate + decreasing hash rate indicates potential selling pressure.
- High negative funding rate + whale buying activity can be a bullish signal.
4. Case Study: Using Integration for Analysis
Situation:
- Fear and Greed Index is at 15 (Extreme Fear).
- MVRV shows a value of <1 (undervalued).
- Whales increase accumulation, and exchange outflow increases.
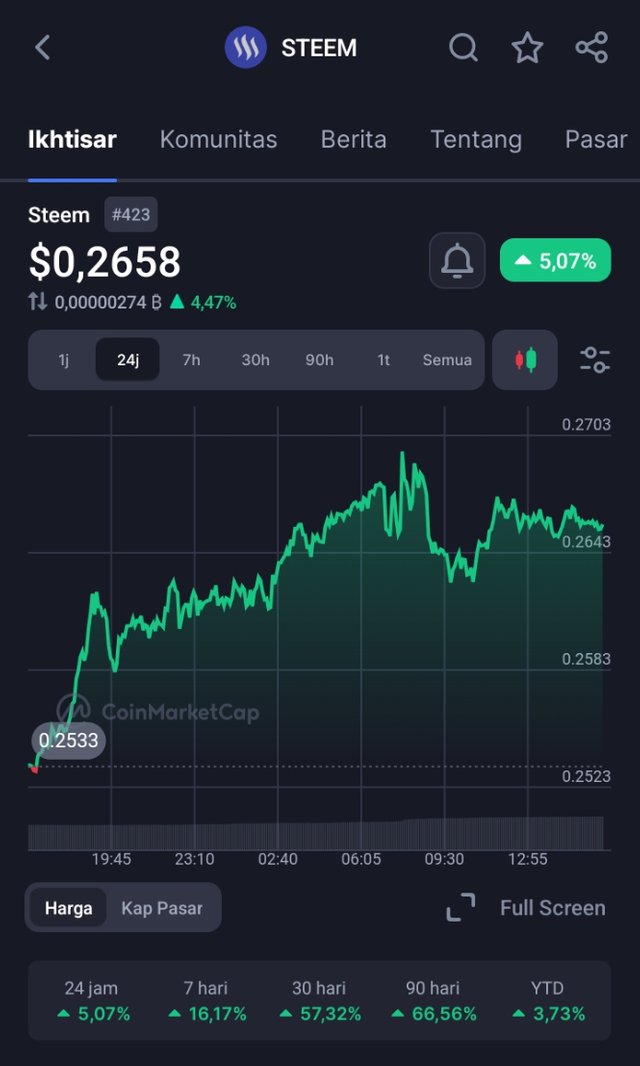
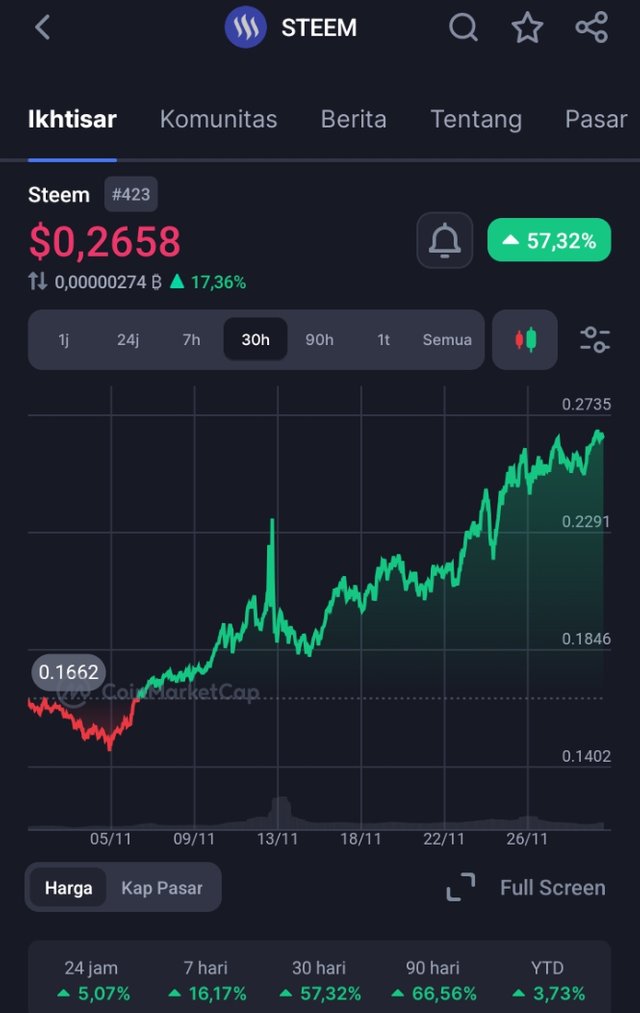
Example: To illustrate the combined application of Steem and USDT:
we can imagine an ecosystem where users can easily use both tokens for transactions, rewards, and trading. Here are some examples of its applications:
 |  |
|---|
- Content Ecosystem Rewards
- Steem: Used on social media platforms like Steemit to reward content creators. When someone makes a quality post, the community can upvote it, and the content creator will get a reward in the form of Steem.
- USDT: This token can be used to exchange the Steem rewards received into stablecoins so that the reward value remains stable even though the price of Steem fluctuates.
- Trading on the DeFi Platform
- Steem: Used as one of the tokens that can be traded on decentralized exchanges (DEX).
- USDT: Serves as the main trading pair because of its stability against the USD. With this, users can directly exchange their Steem to USDT without having to worry about price volatility when they want to withdraw funds.
- Funding Blockchain Projects
- Steem: Used to support community-based projects, such as crowdfunding for creative ideas on the blockchain platform.
- USDT: As a donation tool for users who want to donate without being exposed to the volatility risk of Steem.
- Global Value Transfer
- Steem: Used as a means of payment within the Steem ecosystem network to purchase digital services or products.
- USDT: Used as a more stable means of value transfer for payments between platforms or in cross-border transactions.
- Staking and Passive Income
- Steem: Can be staked to increase voting power in the Steem community, which also gives greater influence in decision-making.
- USDT: Can be invested in DeFi platforms to earn passive income from interest or yield farming.
Question 4: Integrating On-Chain Data with Sentiment Indicators
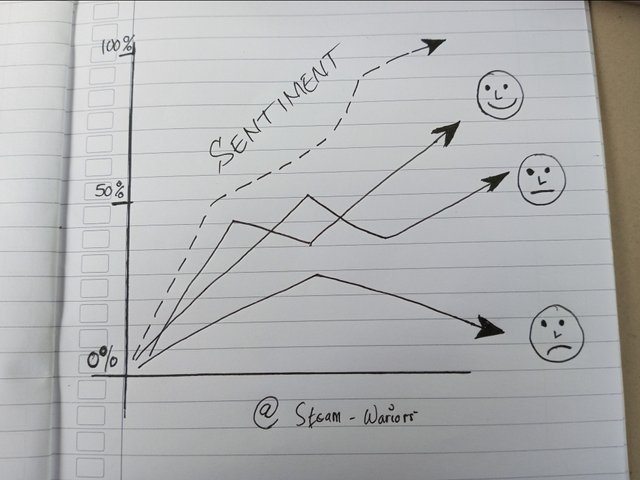
Sentiment-based trading strategies are approaches that use analysis of emotions and market psychology to make trading decisions. In the crypto market, this strategy is increasingly relevant due to high volatility and large online community engagement. Here are the steps to develop a sentiment-based trading strategy:
1. Basic Understanding of Sentiment-Based Trading Strategies
This strategy relies on two main things:
- Sentiment Indicators: Data that reflects market emotions (fear, greed, optimism, pessimism).
- Supporting Data: A combination of on-chain, technical, and fundamental data to validate sentiment.
2. Steps to Develop a Strategy
a. Identifying Sentiment Sources
- Social Media: Twitter, Reddit, Telegram, and Discord to monitor community conversations and trends.
- Fear and Greed Index: Provides an overview of market psychology.
- Media Sentiment Analysis: Tools like LunarCrush and Santiment to analyze the tone of conversation (positive/negative).
- Funding Rate: Measure sentiment in the derivatives market (long vs short).
b. Collect Real-Time Data
- Use APIs from platforms like Glassnode, Santiment, or LunarCrush to access real-time sentiment and on-chain data.
- Monitor metrics like:
- Transaction volume.
- Active addresses.
- Funds in/outflow from exchanges.
c. Set Leading Indicators
Some leading indicators that can be used in the strategy:
- Extreme Fear (Fear and Greed Index < 20):
- Potential signal to buy (market capitulation).
- Extreme Greed (Fear and Greed Index > 80):
- Potential signal to sell (overbought).
- Positive Sentiment Spike on Social Media:
- Combine with technical data to identify potential breakouts.
- Extreme Positive/Negative Funding Rate:
- High funding rate: Market signals are too optimistic (sell).
- Low funding rate: Market signals are too pessimistic (buy).
d. Create Trading Rules
- Entry Rules:
- Example: Buy if Fear and Greed Index < 25, inflow to the exchange is low, and whale activity is increasing.
- Exit Rules:
- Example: Sell if social media sentiment is very positive, outflow from the exchange is decreasing, and price hits technical resistance.
- Risk Management:
- Limit losses with stop-loss.
- Use position sizing to manage exposure.
e. Strategy Testing (Backtesting and Paper Trading)
- Backtesting: Use historical data to test the effectiveness of a strategy.
- Paper Trading: Simulate risk-free trading using a demo account.
3. Sentiment-Based Strategy Example
Capitulation Strategy
- Scenario:
- Fear and Greed Index shows "Extreme Fear."
- Whales start accumulating assets.
- Inflow to the exchange is low.
- Action:
- Enter long positions gradually.
- Set profit targets at technical resistance levels.
Euphoria Strategy
- Scenario:
- Fear and Greed Index shows "Extreme Greed."
- Social media sentiment is very positive.
- Price is already far above realized value (MVRV > 2).
- Action:
- Enter short positions or exit long positions.
- Monitor for possible sharp corrections.
4. Tools to Support Strategy
- Glassnode: On-chain metrics such as inflow/outflow and MVRV.
- Santiment: Social media sentiment data and network activity.
- CryptoQuant: Funding rate and fund flow analysis.
- LunarCrush: Real-time social media sentiment.
- TradingView: To combine technical analysis with sentiment data.
5. Risks and Limitations
- Fast Sentiment Changes: Sentiment can change quickly due to unexpected news or events.
- Inaccurate Data: Sentiment analysis from social media can be biased or manipulated.
- Overtrading: Relying too much on sentiment can lead to suboptimal trading decisions.
Question 5: Developing a Sentiment-Based Trading Strategy
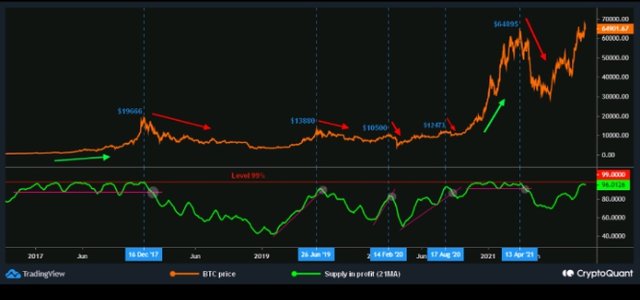
Sentiment analysis is a powerful tool for understanding market psychology, but it does have some limitations that need to be recognized. By understanding these limitations, you can adopt best practices to maximize the effectiveness of sentiment analysis in decision making.

1. Limitations of Sentiment Analysis
a. High Volatility of Crypto Markets
- Crypto markets are highly volatile, so sentiment can change rapidly due to major news or events, such as:
- New regulations.
- Listing or delisting of assets on exchanges.
- Security attacks on blockchains.
b. Biased or Unrepresentative Data
- Sentiment Manipulation:
- Certain actors can manipulate sentiment through “pump and dump” or social media campaigns.
- Community Bias:
- Data from social media often reflects only the opinions of a select group of people, not the entire market.
c. Reliance on Tools and Data
- Sentiment analysis tools rely on algorithms that don’t always accurately capture context or irony, especially in social media conversations.
- On-chain data doesn’t always capture the motives behind a particular activity, such as large inflows that may come from institutional or individual transactions.
d. Doesn’t Always Give a Clear Signal
Extreme sentiment (either fear or greed) isn’t always followed by corresponding price movements.
A combination of other factors such as market liquidity, trading volume, or technical data is often more telling.
e. Focus on the Short Term
- Sentiment analysis is often more relevant for short-term price movements. For long-term strategies, project fundamentals and technology adoption are more important.
2. Best Practices in Sentiment Analysis
a. Combine with Other Analysis
Technical Analysis: Use chart patterns, technical indicators (RSI, MACD), and support/resistance to validate sentiment analysis results.
Fundamental Analysis: Examine project news, roadmaps, and partnerships to assess long-term prospects.
b. Use Multiple Data Sources
- Don’t rely on just one platform or sentiment tool.
- Combine data from:
- Social media (Twitter, Reddit).
- On-chain data (MVRV, NUPL).
- Funding rates from derivatives markets.
c. Monitor Global News
- Big news stories often have a significant impact on sentiment.
- Examples:
- Positive sentiment due to regulations that support crypto asset adoption.
- Negative sentiment due to bans or restrictions on trading.
d. Identify Extreme Sentiment
- Extreme sentiment often represents price turning points:
- Extreme Fear: Buying opportunities (market capitulation).
- Extreme Greed: Selling opportunities (market correction).
- Use tools like the Fear and Greed Index to monitor these conditions.
e. Risk Management
- Don’t make decisions based on sentiment alone:
- Always use stop-loss to protect capital.
- Set realistic profit targets.
f. Backtesting Your Strategy
- Simulate sentiment-based strategies using historical data to gauge their effectiveness.
- Use a demo account or paper trading to test strategies before committing real money.
g. Regularly Update Your Data and Tools
- Make sure your sentiment analysis tools are always up-to-date to capture the latest market dynamics.
- Monitor new trends such as social metrics on blockchain-based platforms (e.g. NFT or DeFi).
h. Avoid Overtrading
- Don’t trade too often based on small sentiment changes.
- Focus on sentiment that is truly significant or supported by on-chain and technical data.
3. Recommended Tools
- LunarCrush: Real-time social media sentiment.
- Santiment: Social sentiment analysis and on-chain data.
- CryptoQuant: On-chain data such as exchange inflow/outflow.
- Alternative.me: Fear and Greed Index.
- Glassnode: On-chain metrics such as MVRV and whale activity.
4. Conclusion
Sentiment analysis is an important tool for understanding market dynamics, but it has limitations such as data bias, market volatility, and difficulty in capturing context. By combining sentiment analysis with on-chain data, technical analysis, and fundamentals, you can improve the accuracy of your predictions. Use best practices such as data diversification, strategy testing, and risk management to optimize your trading results.
 Click Here