[Crypto Trading by Identifying Support and Resistance]-Steemit Crypto Academy | S6W3 | Homework Post for @shemul21
Hello steemians, such a pleasure being a member of this academy. This week's lesson by prof @shemul21 focused on identifying support and resistance and identifying trade signals using them. I will be doing the homework task from the lesson.


1. What is the Support & Resistance zone?
When doing technical analysis, you'll notice that price tends to bounce off on certain areas or zones, and these zones are called historic zones. These historic zones can act as a support or a resistance. A clear illustration of the support and resistance zones is the floor and the ceiling. The floor acts as support, not allowing price to go below it, and the ceiling a resistance not allowing price to go above.
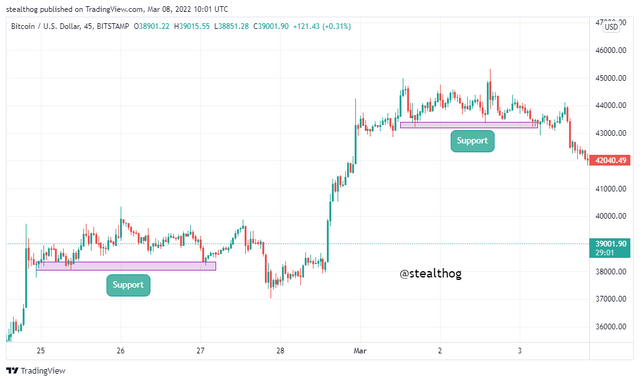
Support zones are areas, zones, or levels in the market that price bounces off when in a downtrend. A strong support zone sees price testing that level several times and gets bounced off. An example of a support zone is given below.
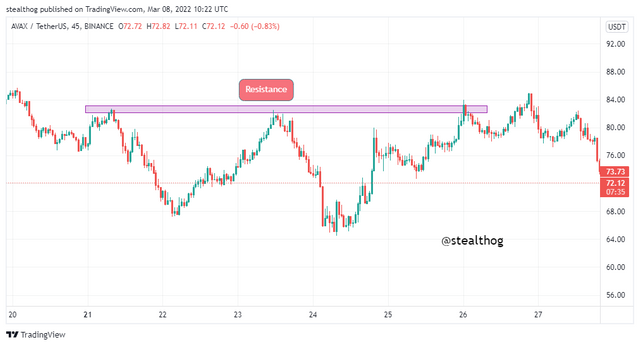
Like the support zones, the resistance zones are areas or levels in the market that price bounces off when in an uptrend. A historical level of resistance zone has seen price being rejected previously from continuing in an uptrend. An example of a resistance zone is given below.
2. Explain different types of Support & resistance with proper demonstration.
There are different types of support and resistance, and they are listed below.
Horizontal support and resistance
Slopping support and resistance
Dynamic Support and resistance
Horizontal Support and Resistance
Horizontal support and resistance are the most commonly known to traders and are used mainly by beginners. It involves drawing a horizontal line or zone to meet with price showing the area where the price gets bounced off either as a support or a resistance. The horizontal support can experience a breakout and act as a resistance and vice versa for horizontal resistance.
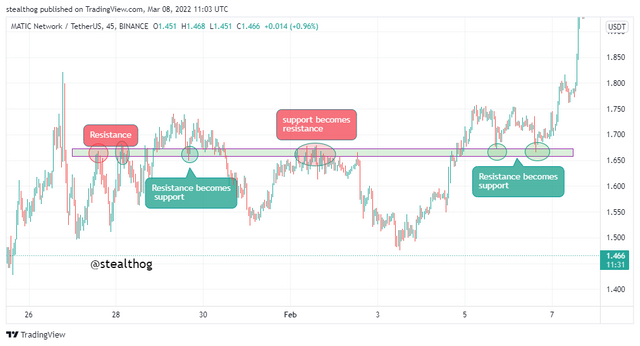
From the MATICUSDT chart above, we see a horizontal zone that turned out to act as both support and resistance at different points in the chart. From the left, the horizontal area served as resistance and bounced of price twice, but there was a breakout on the third test of the zone by price. After the breakout, the price retested the level and got rejected, as the horizontal resistance zone now acts as support.
Slopping Support and Resistance
The slopping support and resistance are based on the trendline acting as support or resistance to price. The slopping support and resistance use trends (uptrend and downtrend). During an uptrend, the market keeps making higher highs and respecting the previous low not to break it. Slopping support can be drawn, as shown below.
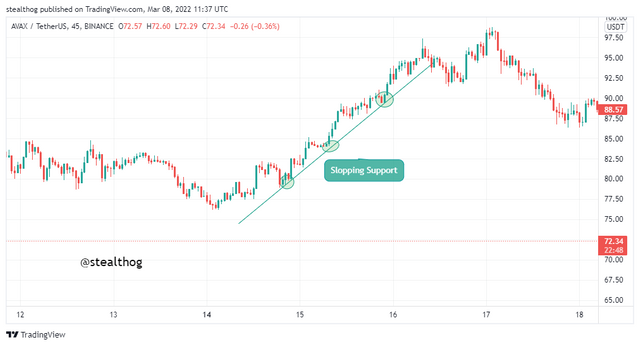
From the chart above, the trendline acts as slopping support for the price as the price tests the slopping support zone severally and gets rejected. The trendline is an uptrend support level or zone.
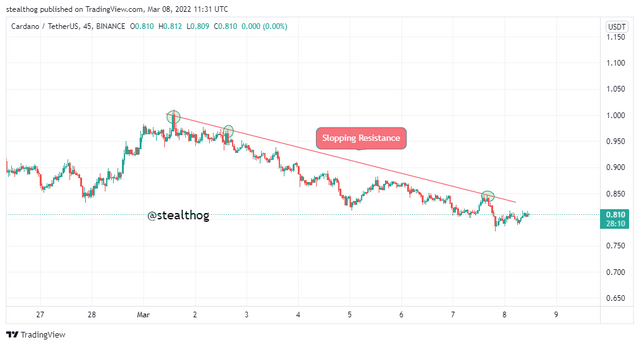
From the chart above, the trendline acted as a slopping resistance for the price as the price tested the slopping resistance zone severally and got rejected. The trendline is a downtrend resistance level or zone.
Dynamic Support and Resistance
Dynamic support and resistance are a type of support and resistance similar to slopping support and resistance. Like the slopping support and resistance that uses a trendline to identify support or resistance zone, the dynamic support and resistance zone can be identified using indicators like the moving averages or the Bollinger bands.
Dynamic support and resistance can be identified using the moving averages (200, 50, 20). When price touches the 20 moving average, the trend is in a healthy run or a trend continuation. When price touches the 50 moving average, the trend might experience a bit of range or a break and continue. Lastly, when price gets to the 200 moving average, it is an indication that there might be a trend change or reversal.
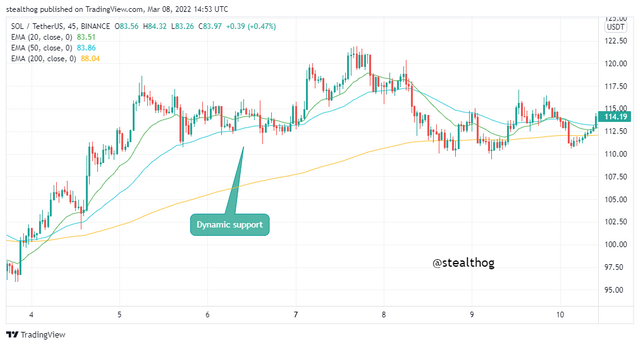
The moving averages act as dynamic support for price from the chart above.
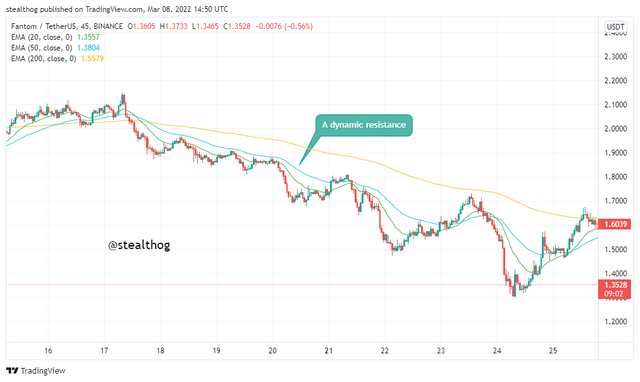
The moving averages act as dynamic resistance for price from the chart above.
3. Identify The False & Successful Breakouts. (demonstrate with screenshots)
The support and resistance zones experience breakouts when prices significantly move past either of the levels and continue on the trend or make a reversal. There are two types of breakouts, namely;
False breakout and,
Successful breakout
False Breakout
False breakouts occur on the support or resistance zones and fail as priced rallies back into the zone with little or no consequence to the breakout. False breakout may result from traders going against the breakout signal preventing it from leaving the zone.

The chart above shows a resistance zone that has been tested twice. On the third zone test by price, a false breakout occurred when price rallied above the resistance level but was immediately reversed back to the zone. Price tested the zone for the fourth time and was bounced off.
Successful Breakout
Successful breakouts occur when price rallies past a historic zone (support or resistance) to continue or make a trend reversal. There are two kinds of successful breakouts, namely;
- Continuation Breakout
As the name implies, the continuation breakouts continue the market trend. This usually occurs when the market is in a trend (uptrend or downtrend), and price gets to a historical level and keeps bouncing off (primarily creating a range or a consolidation). If the psychology of traders in the market continues on the trade, then a breakout happens, and the trend moves in the same direction, then a continuation breakout has occurred.
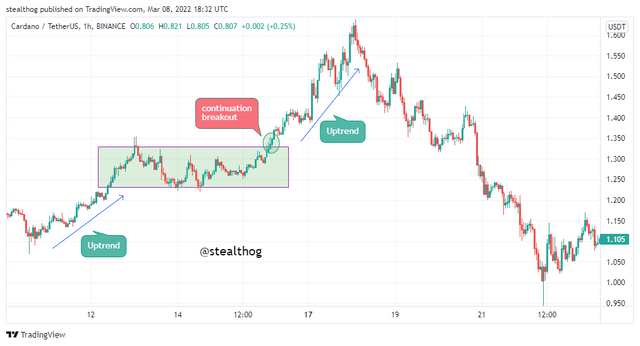
From the chart above, price was in an uptrend movement. Then it experiences a consolidation. Price broke out from the horizontal zone and continued in its uptrend direction.
- Reversal Breakout
Reversal breakouts change the direction of the preceding or overall trend. For instance, the market is in an uptrend and gets to a historical level (support or resistance), and price consolidates. A reversal breakout changes the preceding trend from an uptrend to a downtrend.
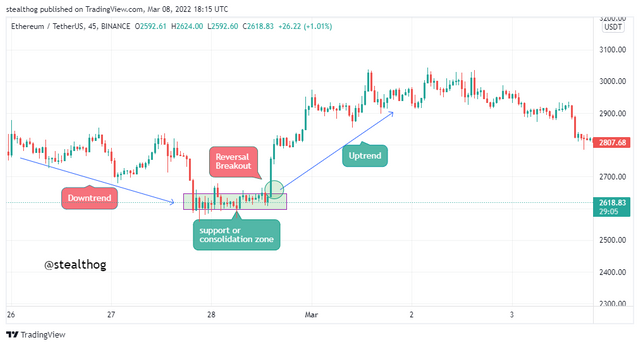
From the chart above, price was in a downtrend movement. Then it experiences a consolidation. Price broke out from the horizontal zone and continued in a reversed uptrend direction.
Use Volume and RSI Indicator Combined with Breakouts & Identify the Entry Point. (demonstrate with screenshots).
Identifying entry points in the market using the breakout strategy is effective, but it can also be combined with other technical indicators to form a confluence of trade signals. The breakout strategy combined with the RSI indicator and the volume indicator helps traders identify and confirm entry points in the market.
When combining the breakout method with the other indicators, the first thing to do is zoom out the chart to identify historic solid zones in the market. Then the horizontal zone is drawn. A trade signal is given when the RSI confirms the market condition and the high breakout volume, ensuring it's not a false breakout.
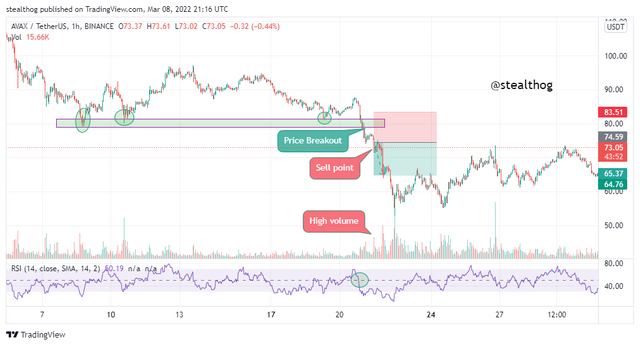
A horizontal support zone was identified and drawn on the chart above chart. Rice tested the area multiple times and finally broke the zone downwards to continue the bearish trend. A selling point was identified when the price did not retest the zone after some candles, and the RSI indicator moved past the 50 level to the oversold level. The breakout volume was high, as shown on the chart.
5. Take a Real Trade(crypto pair) on Your Account After a Successful Breakout. (transaction screenshot required)
To perform this task, I will be using my Binance account to make a real trade with signals received from breakouts.
AVAXUSDT (BUY TRADE)
In executing this trade using the breakout strategy, I will be using the slopping support or resistance. The slopping support and resistance use the trendline to identify historic zones in the market.
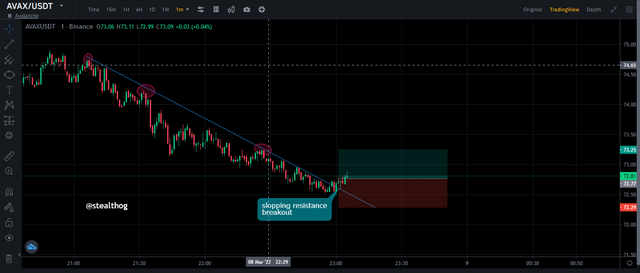
On the AVAXUSDT chart, a slopping resistance zone was identified and drawn. Price was moving in a downtrend, recording lower lows and lower highs. After testing the sloping resistance several times, the resistance zone broke out as price rallied above the sloppy resistance trendline. Price market structure was also broken as price recorded a higher high from the previous high, indicating a trend reversal. Buy order was entered when the breakout was successful, and a trend reversal had occurred.
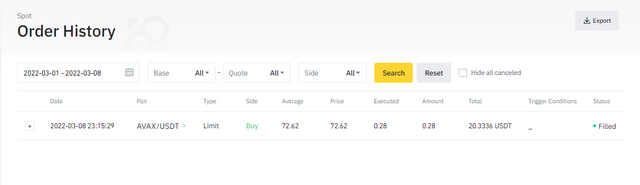
Buy order was entered as seen from the image above with a risk to reward ratio of 1:1.
Explain the Limitations of Support & Resistance (false breakout)
There is always a limitation, as with all trading strategies, as nothing is perfect. Though the support and resistance trading strategy is very effective and efficient, it has a drawback when using the breakout strategy. The false breakout is a substantial limitation on the support and resistance level. As earlier stated, a false breakout is a wrong signal given by price action, whereby price seems to have rallied past a historic zone only to reverse and continue its movement on the zone. Traders might have entered a trade on the initial breakout, leading to a loss of trading funds.
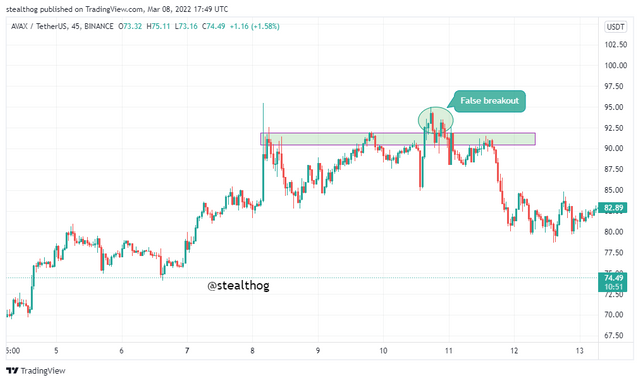
The resistance zone experienced a false breakout from the chart above when the price rallied above the zone, only to be reversed back to the zone. This may be due to an increase in selling pressure making void the breakout.
Conclusion
Support and resistance are levels on the market where price bounces off and experiences a reversal. These are historical levels and, as such vital to traders. There are three types of support and resistance. Breakouts occur when prices rally past the zones and continue on the preceding trend or move in the opposite direction creating trend reversals. Breakouts can be paired with other technical indicators to give trade signals.