[Basics to trade cryptocurrencies correctly | Part 2] - Crypto Academy / S6W3 - Homework post for professor @nane15.
Hello Steemians, I hope you all are doing well. Prof @nane15 lesson this week was part 2 of the topic 'Basics to trade cryptocurrencies correctly". It was an insightful and educative read, and I will be doing the homework task from the lesson.

1. Explain your understanding of charts, candlesticks and time intervals. (Use your own words and post screenshots).
Charts
Charts or price chart is the graphical representation of price against time. A price chart shows the relationship between price and time using tools like candlesticks (used in candlesticks charts), symbols, drawing tools etc. With a price on the Y-axis (vertical side of the chart) and time on the X-axis (horizontal side of the chart). The value of an asset is determined by the actions of buyers and sellers (supply and demand). Charts give a real-time representation of the asset value (price) using tools like candlesticks, lines, or bars to continuously connect the price at different time intervals.
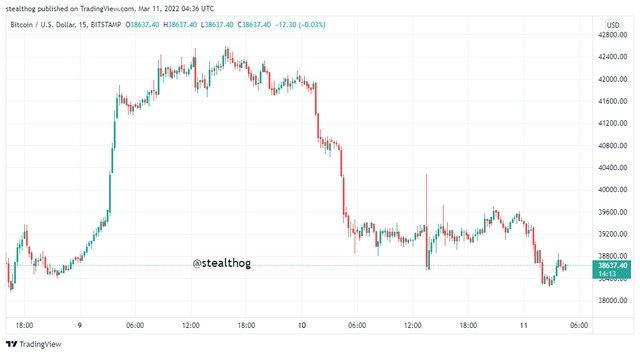
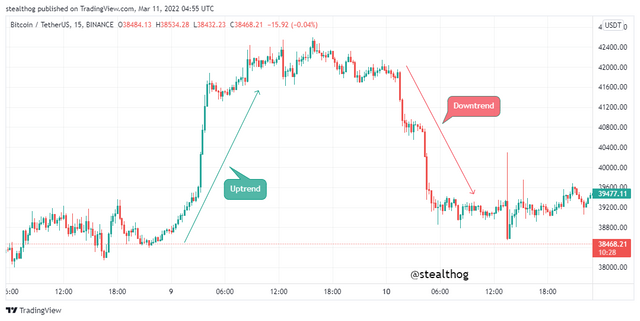
A candlestick chart is given above, where we can see how candles are connected in sequence to show the graphical representation of price at different time intervals. From looking at the chart, we can tell that BTCUSD increased price value, hence the uptrend. Encountered a period of consolidation where price was not moving in any clear trend, and then a period where price dropped in value. With charts, we can tell what is happening in the market and the current market trend by looking at the flow of the candles, lines or bars.
Candlesticks
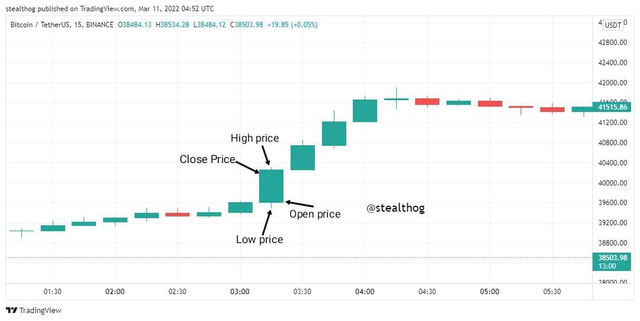
Japanese candlesticks, generally called candlesticks, represent a price movement over a given time frame. A candlestick chart uses candles that consists of the body, wick, high price, low price, closing price, and opening price. The various parts of the candlestick give information on how the market moved in a given time.
A bullish candle, usually represented with white or green, will have the opening price at the bottom and the closing price at the top. The closing price at the top shows that the candle closed at a price higher than its open price. An example is given below.
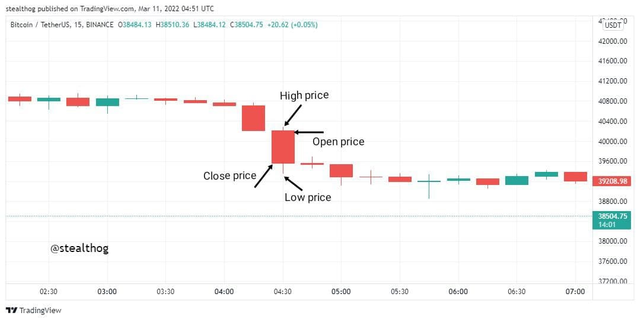
A bearish candle, usually represented by the colours back or red, has the closing price at the bottom and the opening price at the top. The closing price at the bottom indicates that the price closed at a price lower than the opening price. An example is given below.
In a bullish or an uptrend, the bullish candles are formed in sequence because the price keeps closing above the open price and vice versa for a bearish or a downtrend where we see bearish candles formation in sequence as price keeps closing below the open price.
Using the candlestick chart helps in trading as it gives vital information about the market trend, traders' psychology (by studying the wicks), and signals for a possible trend reversal. Candlestick charts are the most popular and commonly used charts in the technical analysis trading world.
Time Intervals
Charts represent time against price, with time on the x-axis and price on the y axis. Time intervals account for the unit of time used in expressing the charts. Time intervals can be in minutes, hours, days, weeks or months, depending on the trader's choice.
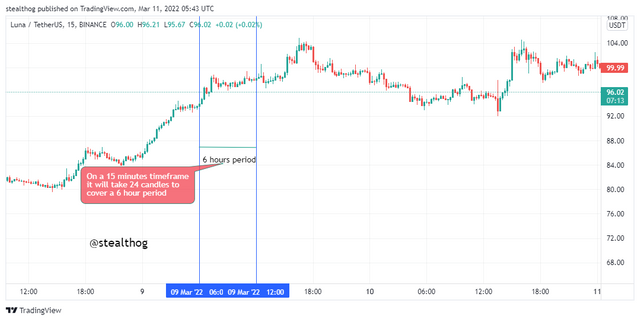
The chart above shows a time interval of 6-hours on a 15 minutes candlestick time frame, which means that it will take 24 candlesticks to represent price movement for a one 6-hour time interval. Time intervals let traders view a chart and see its trend on the time interval of choice.
2. Explains how to identify support and resistance levels. (Provide examples with at least 2 different charts).
Support and Resistance
Support and resistance are price zones or level that has historically proven to be a swing point in the market. These zones prevent price from continuing on its trend hence acting as a ceiling in the case of resistance and a floor in the case of support. Traders identify these critical zones in the market and enter trade orders to buy or sell.
Identifying A Resistance Level
Resistance levels are levels on the market where price tends to be rejected from continuing an uptrend. This can be due to increased selling pressure on that zone as traders believe that price demand is high and need to sell off or that the asset is being overbought and, as such, needs to get rid of it.
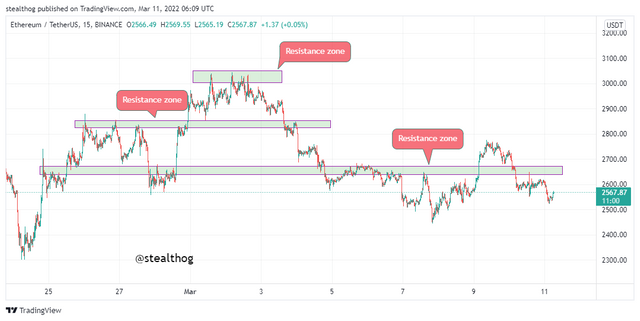
The chart above-identified various resistance zones on areas where uptrend prices were rejected from moving past it. It is good to note that a strong resistance level will most likely act as a support level if broken.
Identifying a Support Zone
Support levels or zones are levels on the market where price tends to be rejected from continuing a downtrend movement. This can be due to an increased buying pressure on that zone as traders believe that the asset supply is high and need to buy in or that the asset is being oversold and, as such, needs to get in at that level.
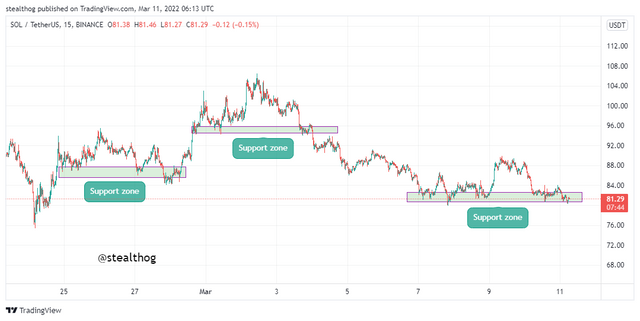
The chart above-identified various support zones in areas where price in a downtrend got rejected from moving past it. It is good to note that a strong support level will most likely act as a resistance level if broken.
3. Identify and point out Fibonacci retracements, round numbers, high volume, and accumulation and distribution zones. (Each on a different chart).
Fibonacci Retracement
A Fibonacci retracement is a tool that uses the Fibonacci numbers to calculate levels on the market called Fibonacci levels. This level shows support areas in an uptrend retracement and resistance areas in a downtrend retracement. The Fibonacci retracement levels are 23.6%, 38.2%, 50%, 61.8%, 78.6%. identified on the Fibonacci tool by horizontal lines. The Fibonacci retracement works by connecting the high point and the low point in a trend, drawn from low to high in an uptrend and from high to low in a downtrend.
Price action market structure in a trend sees higher highs and higher lows for a bullish trend and lower highs and lower lows for a bearish trend. The Fibonacci retracement is used to measure the retracement or counter-trend in an overall trend.
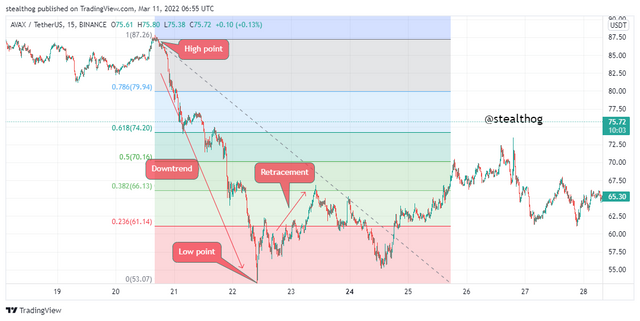
In a bearish trend like the chart above, the Fibonacci retracement is drawn from the high point of the trend to the low point (top to bottom). The Fibonacci retracement is drawn to measure the retracement (next lower high of the trend) price action movement, which is often a resistance level in the market.
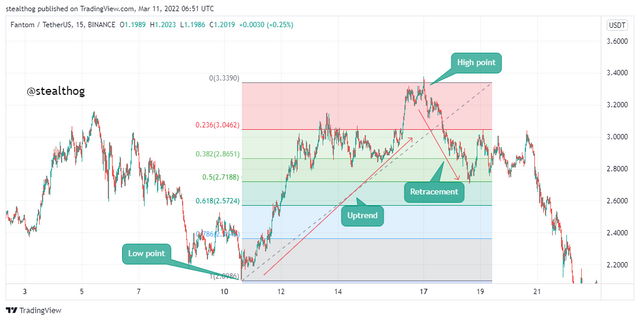
In a bullish trend like the chart above, the Fibonacci retracement is drawn from the low point of the trend to the high point (bottom to top). The Fibonacci retracement is drawn to measure the trend's retracement price action movement, which is often a support level in the market.
Round Numbers
It's human nature to round up numbers, making it easier to remember and calculate. This phenomenon is not missing in the trading world as it is believed that there is an increase in trading activities in areas of round numbers in the market. Round numbers refer to 1000, 2000, 3000, 4000, etc. Traders and investors look at such numbers when trading to enter trades as there is high liquidity and potential swing points in the market.
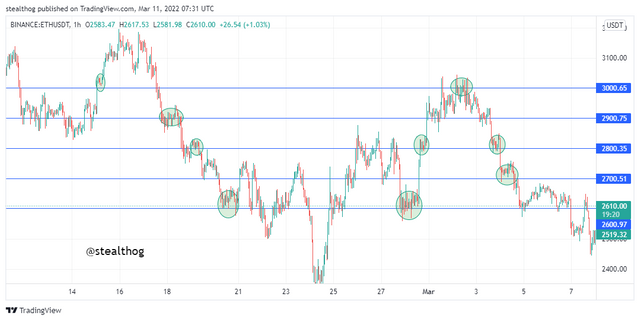
The ETHUSDT chart above shows trading activities on areas of round numbers (2600, 2700, 2800, 2900, 3000). In these areas, we can see that there is an increase in the trading activities as buyers and sellers are placing trade orders, which mainly results in a consolidation of price before price continues on its trend or a trend reversal occurs.
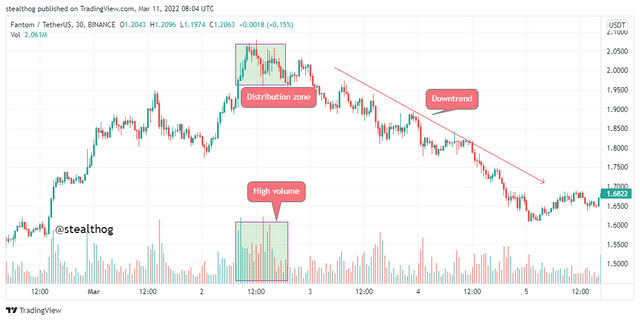
High Volume, Accumulation, and Distribution
Volume is a chart indicator that shows the level of cash inflow to the market and cash outflow from the market. Accumulation and distribution are points in the market where there is an increase in the influx of cash and an increase in cash outflow. High volume paired with accumulation and distribution zones helps traders identify cash flow in and out of an asset.
Accumulation zones refer to low points in the market where there is an increase in the inflow of cash as market whales, and investors have put in considerable amounts to drive the demand for an asset and, as such, create an uptrend.
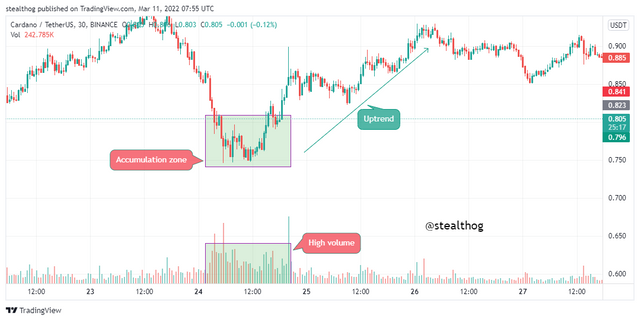
Distribution zones refer to high points in the market where there is an increase in the outflow of cash as market whales and investors have withdrawn massive amounts to drive the supply of an asset and, as such, create a downtrend.
4. Explains how to identify a bounce and a break correctly. (Screenshots are required.)
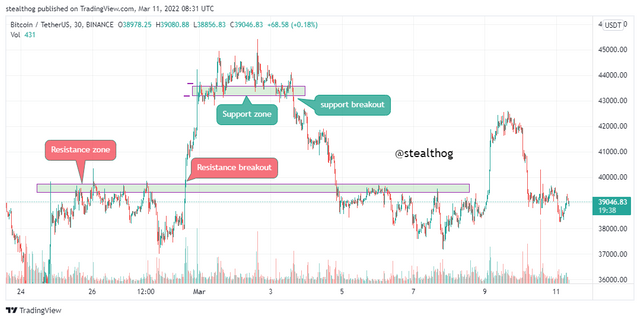
Breakouts in Support and Resistance
Support and resistance are critical zones in the market where price gets rejected from continuing its trend movement and reversed. A resistance zone denies an uptrend, and a support zone rejects a downtrend.
In some cases, price action rallies and cross past these zones due to an increased trading pressure in the trend direction. When a successful breakout occurs, there is an increase in the buying pressure for a resistance zone and a support zone. There is an increase in the selling pressure. There are two types of successful breakout. The continuation breakout continues the overall market trend or the reversal breakout that goes in the opposite direction of the preceding trend.
Bounce of Support and Resistance
As earlier stated, that price gets rejected when it gets to the support and resistance zone. This is due to opposing trend pressure on the support or resistance zone that creates a trend reversal. The rejection on these zones is called price bounce as they are bounced off from continuing on their initial trend.
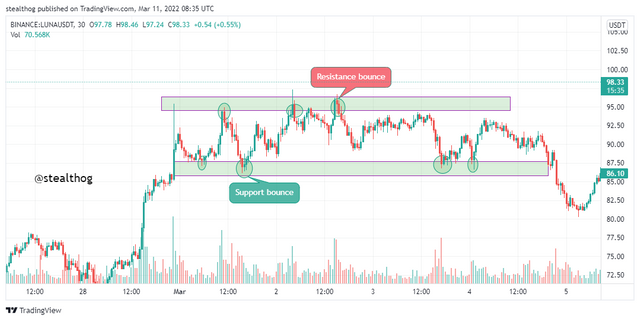
We see price bouncing off the support and resistance zone from the chart above, creating a sort of channel. The image above indicates an increased selling pressure on the resistance zone and an increased buying pressure on the support zone. Scalp traders might trade the bounce. It is a signal for a trend reversal.
5. Explain that it is a false break. (Screenshots are required.)
False Breakout
Breakouts are when price rallies past a support or resistance zone and continues on its trend. A false breakout occurs when price move past the support or resistance zone but fails to continue on the trend and gets pulled back to the area. A false breakout might result from a liquidity grab or increased zone pressure that drives price back to the zone, so it keeps trailing it. To avoid breakout, it is advisable to wait for the close of the second candle after the breakout or for the more conservative traders to wait to see if there will be a retest of the zone.
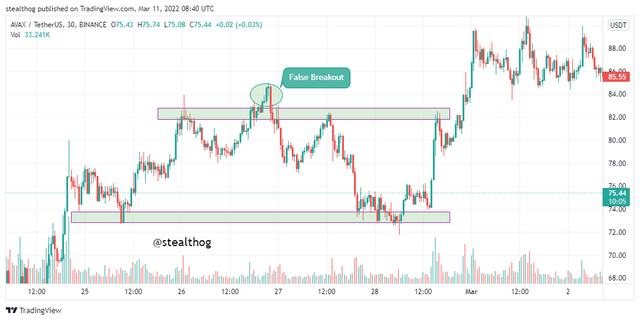
An example of a false breakout is given in the chart above when price got rejected by a resistance zone and on its second test of the zone moved past it. The breakout failed as selling pressure pulled price back, and it continued to trail below the resistance zone.
6. Explain your understanding of trend trading following the laws of supply and demand. Also, explain how to place entry and exit orders following the laws of supply and demand. (Use at least one of the methods explained.)(Screenshots are required.)
Laws of Supply and Demand Effects On Trend
The law of supply and demand states that an increase in demand births an increase in value (price), and an increase in supply brings about an eventual decrease in value (price). This law plays a vital role in price action has it is proven that an inflow of cash or an increase in buying volume brings about an uptrend, and an increase in the outflow of money or an increase in selling volume brings about a price decrease.
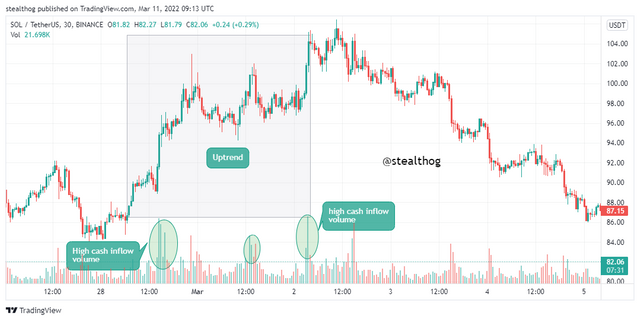
The chart above shows price move in an uptrend as the volume indicator indicates a high inflow of cash. Also, the chart below shows price move in a downtrend due to an increased outflow of cash as indicated by the volume indicator.
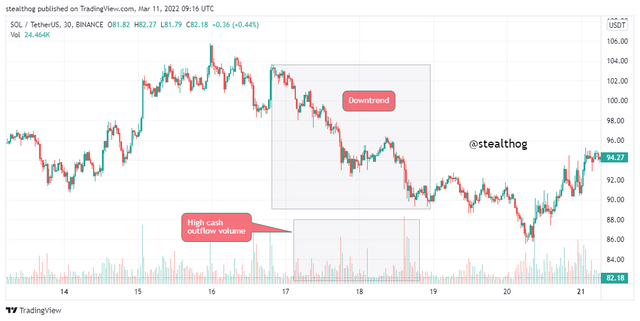
An inflow of cash demands pressure because sellers start selling at a high rate as more buy orders are available. Likewise, an increase in the outflow of cash increases supplies because there is an increase in sell orders and not enough demand for it, which makes the asset's price or value drop.
Trade Point using Laws of Supply and Demand
Laws of supply and demand mean that price increases with increased demand and goes down with an increased supply. There is always price retracement or pullback within a trend (bullish or bearish). The pullback paired with high volume candles can identify trade points.
When using the law of supply and demand pullback strategy to trade, a price must be in a clear trend (bullish or bearish) to identify pullbacks and high volume candles to trade.
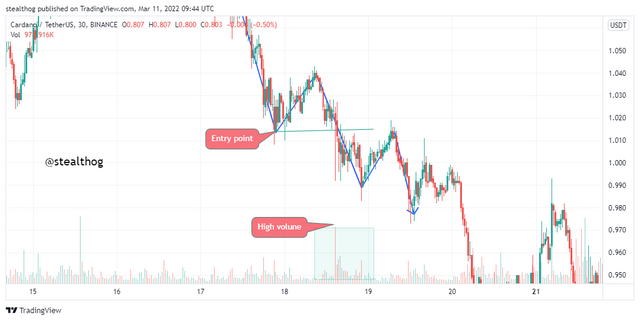
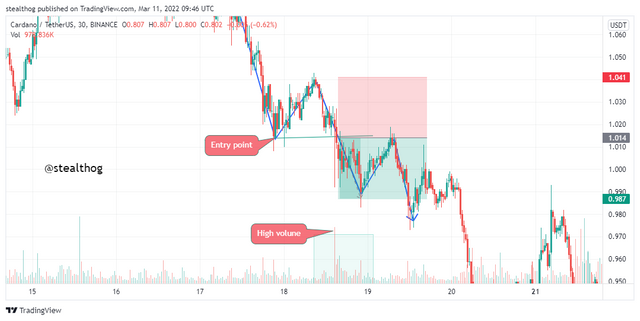
The chart above shows ADAUSDT on a bearish trend with pullbacks. The law of supply and demand pullback strategy was used when price closed below the previous low with a high volume bearish candle, implying an increase in supply. An increase in supply indicates selling pressure, so a sell order was entered with a stop loss station at the previous high. As seen in the chart below, a risk to reward ratio of 1:1 was used.
7. Open a real trading operation where you use at least one of the methods explained in the class. (Screenshots of the verified account are required).
In executing this task, I will be using my verified binance exchange account and using the tradingview chart platform on the binance platform for analysis. The screenshot of my verified binance account is given below.
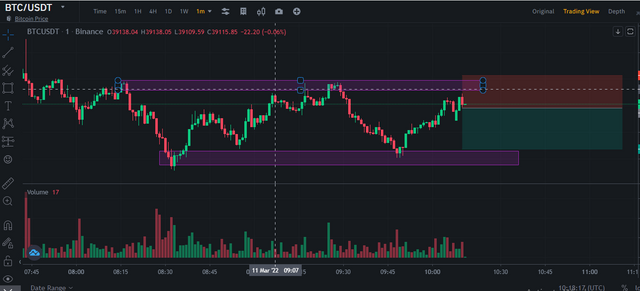
BTCUSDT 1 minute Sell Order.
The BTCUSDT chart price was in a resistance zone and got rejected severally. A sell signal was given when price approached the resistance zone and again denied indicating a trend reversal.
I waited for the close of the first bearish candle then entered a sell order. Stop-loss was placed above the resistance zone and take-profit at the previous low.
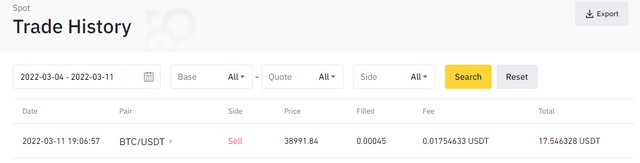
A real trade was entered on my binance exchange account.
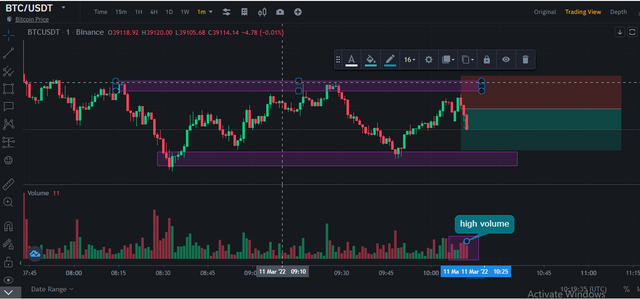
Price follows the bearish trend, as shown below.
Conclusion
There are basics every cryptocurrency trader must adhere to. They include understanding charts, candlesticks, time frames and intervals, and critical zones or levels in the market (support and resistance). Trading signals from support and resistance bounce or breakout, the law of support and resistance pullback strategy are a few of the many ways to trade, but they are basics needed for trading.