Crypto Academy Week 16 - Homework Post for [@stream4u]


Introduction
During my time in crypto academy , ive learnt a great deal about various indicators. As such it is of major importance to know that for a successful trade you need to have a comprehensive analysis in other to reduce your risks. Ive come across the RSI, MACD, bollinger bands and many more
Today our topic would be focused on another aspect of technical indicators called pivot points. Thanks to @stream4u ive spent a great deal studying this and would love to put my studies to work.

Pivot points
Pivot points are technical indicators used to determine the current trends within a market on different time frames. They are more or else like calculations. It shows different price levels with various support and resistance . Calculations are made to figure the highs, lows and closing prices
Al these assist traders to figure out where to expect support or resistance levels and when price moves through the levels the trader knows the trend is moving in their direction. Pivots are presumed to be able to use any time frame but its majorly used in day trade.
This indicator has an advantage over the popular indicators like RSI and MACD because it can calculate risks with proper evaluation . There are 5 major types of pivot point namely:
Traditional pivot point
- Classic pivot point
- Camarilla pivot point
- Woody’s pivot point
- Fibonacci’s pivot point
- Denmark pivot point
Currently traditional pivot point seems to be the most used.

Pivot point levels
The pivot point indicator consists of different levels.
Main Pivot Point level (PP):
The main Pivot level predicts every market trend for the current time period.
When prices are above this point it means there is a bullish but if it goes below then it means there is a bearish.
Resistance levels:
This level is a price level thats usually above the Main Pivot Point level.
It majorly acts as resistance to produce a reversal of an uptrend or a breakout. Although there are other resistance levels such as:
- Resistance 1: Its the 1st resistance level and is located above the PP level.
- Resistance 2: Its the 2nd resistance level and it comes after R1.
- Resistance 3: Its the 3rd resistance level and is located after R2.
- Resistance 4: Its the 4th resistance level and comes after R3
- Resistance 5: Its the 5th resistance level and comes after R4.
Support levels:
These levels are price levels thats are found under the Main Pivot Point Level. They support prices of the traded asset therefore whenever these prices reaches this points, it leads to a bullish reversal or a breakout to continue the bear run. Various support levels include:
- Support 1: The first support level right below the PP level.
- Support 2: 2nd support level and comes after S1
- Support 3 : 3rd support level and comes after S2
- Support 4: 4th support level and comes after S3
- Support 5: 5th support level and comes after S4

pivotpoint level calculations
When calculating pivot point levels , Youll need to to use any of the formerly listed types of pivot points but ill be using Traditional Pivot points which like i said, is the most commonly used.
- Main Pivot Point Level (PP):
To get the PP you'll have to calculate the average of the highs, lows and closing price of the previous days, it uses a formula to help you calculate
PP = (High + Low + Close)/3
Within this level you'll also see the support and resistance levels to enable know figure out your entry or breakout point.
Resistance 1 and Support 1
R1 = (2 x PP) – Low
S1 = (2 x PP) – High
Resistance 2 and Support 2
R2 = PP + (High – Low)
S2 = PP – (High – Low)
Resistance 3 and Support3
R3 = High + 2(PP – Low)
S3 = Low – 2(High – PP)
The woodies pivot point is also good and has similar support and resistance levels with the traditional pivot point

How to apply PIVOT POINT on a chart
Using the trading view platform ill be illustrating how to apply pivot point indicators on a chart
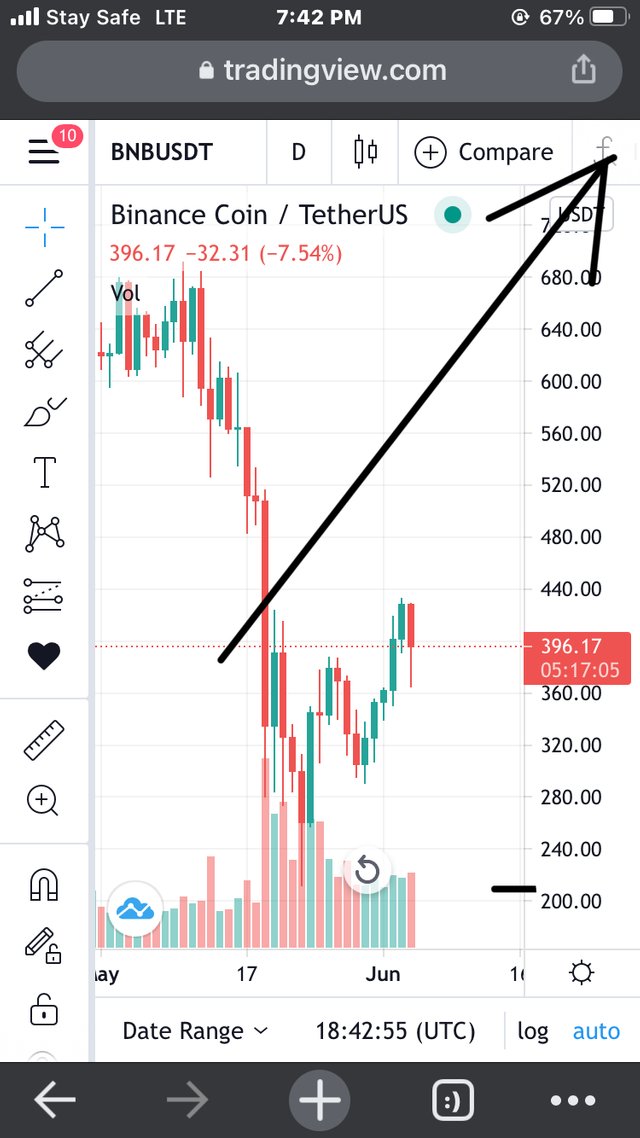
step1 load your chart and click on fx to choose indicator
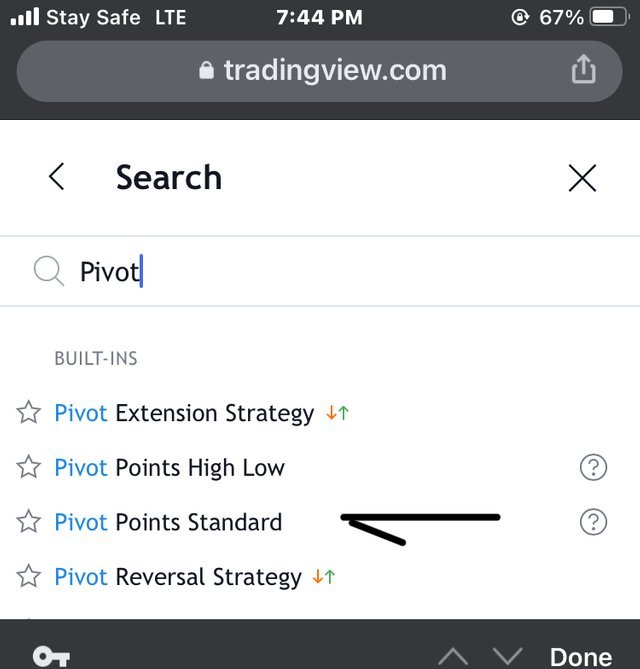
step2 select pivot point standard
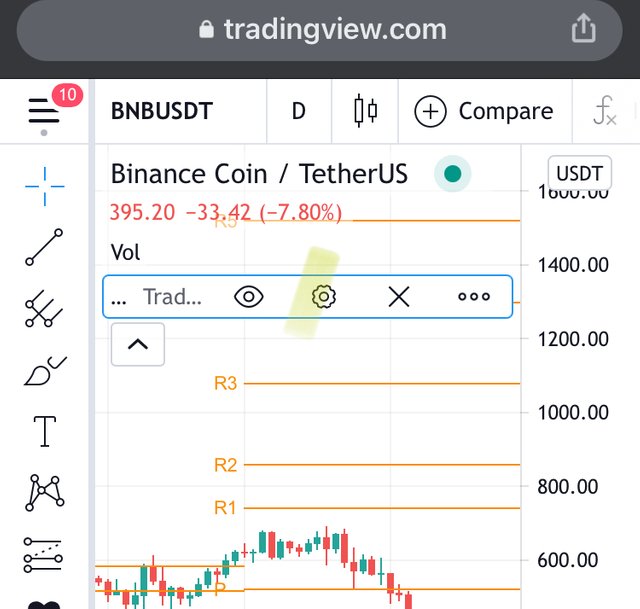
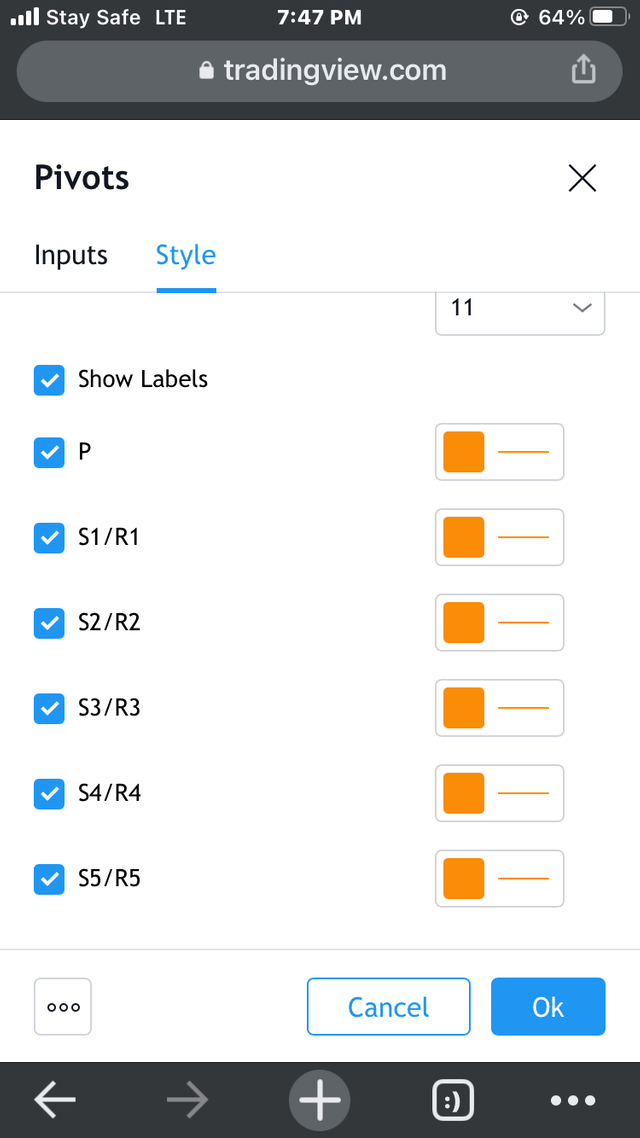
step3 due to the small time frame the 4th and 5th levels wont be necessary so we have to deselect it. You go to the configuration icon.
step4 you can choose to select different colors for your pivot points to avoid confusing from the synced colors
settings
colors

TRADING WITH PIVOT POINTS
Pivot points have proven over time to be a great source of technical analysis for traders. So far ao good it has lived up to its rep and ill be illustrating using the BNB/USDT pair.
- Trend indicator: an example of a very effective trend is the main pivot point(PP) when the price is above the PP , then it would mean an uptrend. Vice versa, if the price is below the PP , then it leads to a downtrend.
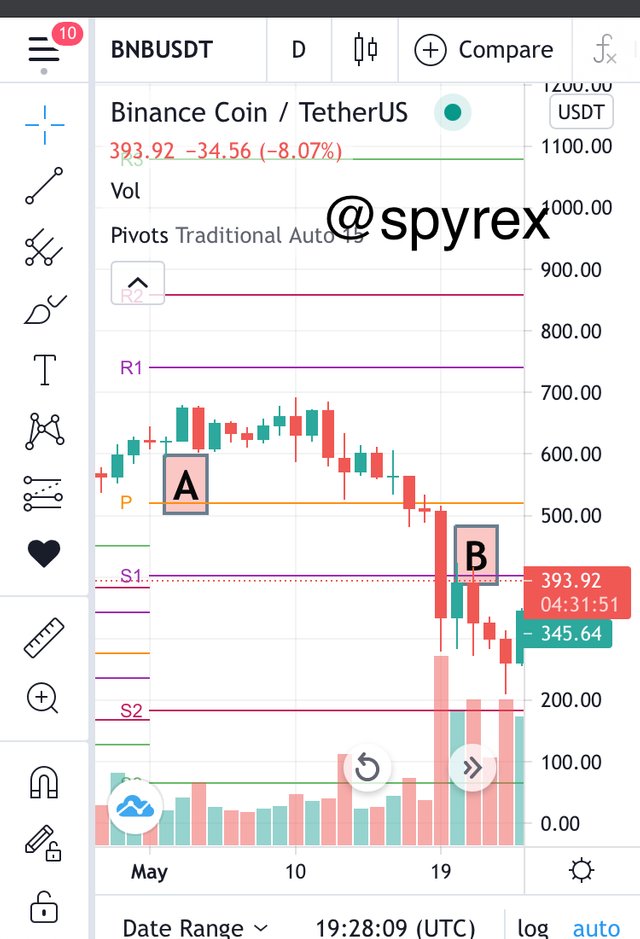
In the image above point A shows an uptrend because the charts are above the pp line, where as point B shows a downtrend as prices go below the PP
- Resistance and Support: resistance and support levels can be seen at regular intervals within the Pivot point indicator. When asset prices hit these levels, they either signal bounce backs or they breakout. A bounce back from a resistance level would mean the trader should sell meanwhile when a breakout occurs it would mean they should a buy same thing goes for the support levels.
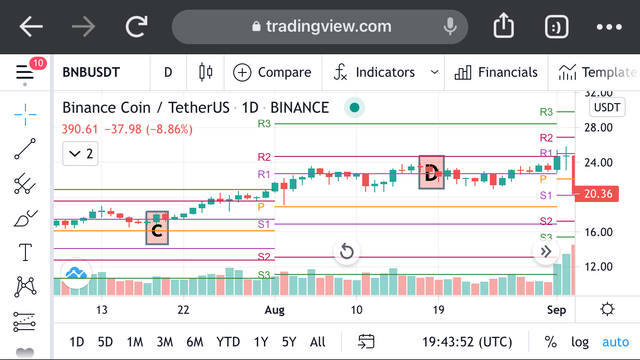
in the image above point C shows support level at S1 whereas in point D it shows a resistance at R1

Reverse trading with Pivot points
Reverse trading is simply when price movements of assets bounces back instead of breaking out
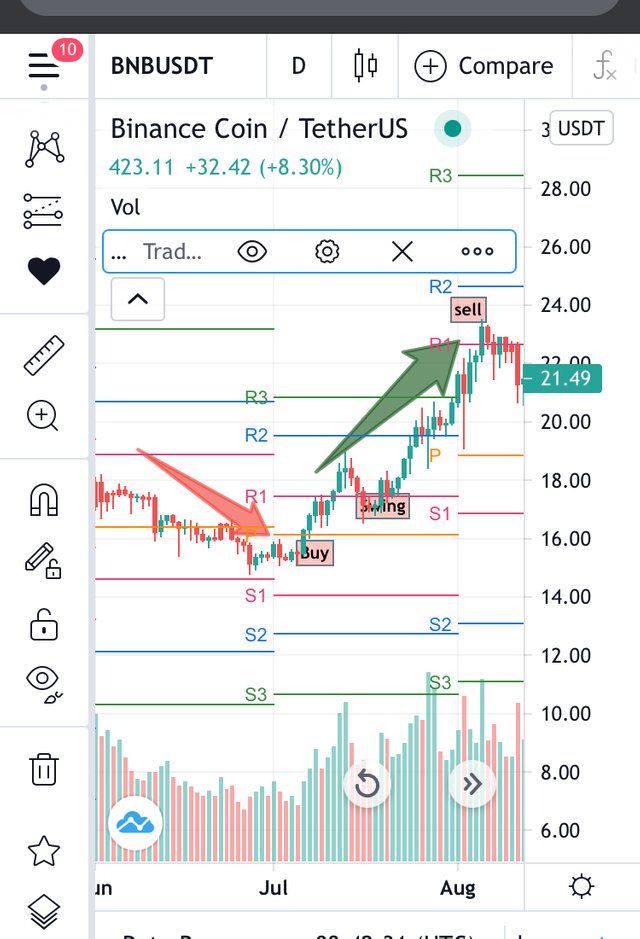
Using the BNB/USDT with a 15minutes time frame. At the beginning of the week on 27th you notice the downtrend. It goes with the flow till it passes the PP level. We wait for a signal and see if it goes above the PP. once it does at a reasonable extent, traders would place a buy order. Although its risky as we hold the trade. It meets a resistance as there is a little fall which is followed by a swing in price. When the swing occurs the prices begin to reverse followed by a continuous uptrend. Itll be risky to continuously hold the trade hence one it reaches R1 trades to pull out of the trade with profits and wait for further confirmation before trading again.
If you noticed earlier the bullish trend began after the prices touched the R1 and we sold at R1. although not pictured on the above picture due to space, the trade flunctuated till it hit below the PP and hand another swing.

Mistakes to avoid when trading with PIVOT
In all lessons i have learnt on indicators the most important one is that its not infalliable. They are meant to reduce your risks and doesn’t mean it is risk proof. Here is what i mean, when using pivot points there are some key mistakes that you shouldn’t make to attract losses. Here are some of them
over relying on pivot points: indicators are good but not always 100 percent accurate, professional traders never stixk with one tool but study and use other to ensure an efficient trade. When traders use only the pivot trade their views are only limited to the lawd id support and resistance but with the combination of other indicators such as RSI, MACD etc it gives a more efficient analysis and reasonable to avoid losses.
identifying pivot lines: most new traders using pivot points can get confusing by the lines which by default all look the dame , this can cause confusing and lead to reading wrong signals. To avoid this its more advisable to go to the configuration settings and give it different colors to make its identification easier.
avoiding stop loss: many traders face thi issue as alot of them deem stop loss unnecessary when using pivot points. Its very advisable to use one because you may ignore and bounce back which may eventually lead to a break out causing the trader a huge loss.
** ignorance of supply and demand:** supply and demand is basically what moves every market and likewise the crypto market. Increase in demand would lead to up trends and increase in supply downtrends. Volume indicators are used to measure the supply and demands as a high volume denotes strong moments on either the low or highs many traders may just ignore these laws and try to trade based on their guts which can be very bad for then.
No planning: most traders would just jump into a trade without planning out a clear strategy this can be out of impulse of controlled by their emotions but it can lead to big mistakes. A trader has to be mentally prepared and map out plans before trading, this way he or she can be confident about their decision s when trading.

advantages of pivot points
The pivot point comes with alot of benefits which is why most traders enjoy using it, below are some of the advantages of pivot points
- Determining when to enter and exit trades:
The pivot point helps traders to know when and how to enter and exit a market. With the resistance meaning sell signals and support meaning buy signals. It is a lot easier to anticipate although carefulness is advices as you could be at the risk of making losses.
- Easy to use: pivot points are one of the most easy tools to use with its main oitlook on resistance and support laws. Most times level calculations are not even needed you just put up the tool and you trade. Its easy to use.
uses small time frames: The pivot point tool uses small time frames for example the daily time frame because of this traders can take advantage of small timeframes and profit from them.
helps calculate risks: unlike other indicators, pivot point assit traders in determining the weight of risks when trading. It captured critical price movements to help traders trade effectively it calculates this by looling at the relationship between the highs the lows and closing prices.

Explaning pivot points using charts
Ill be using the BNB/USDT to carry out this task
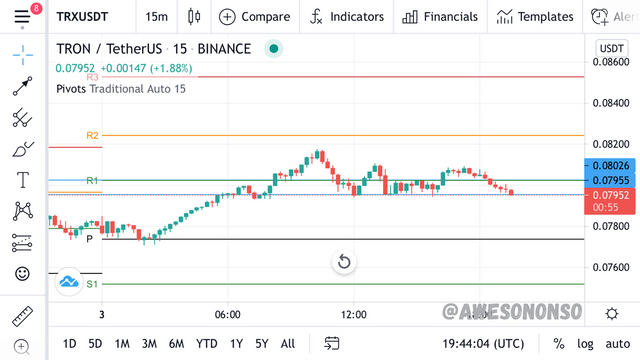
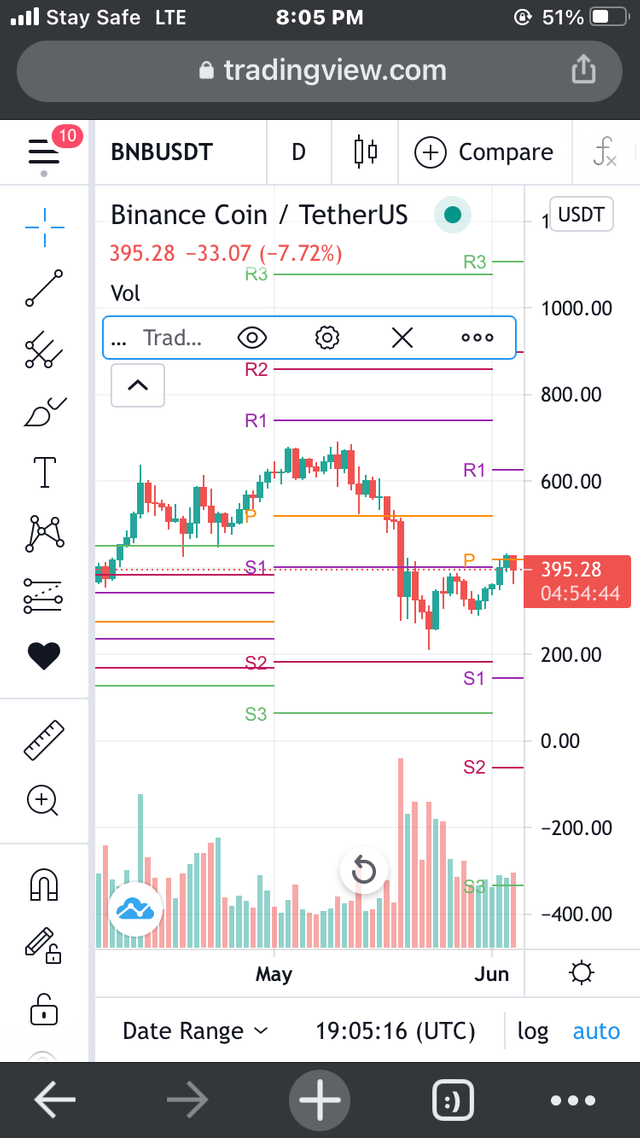
The picture was taken today being the 5th of june at 1:05 pm WST. The market started with a bullish trend above the PP level eventually reaching the R1. It would be best to place a sell T that point as the market shortly bounced back at 425 USDT
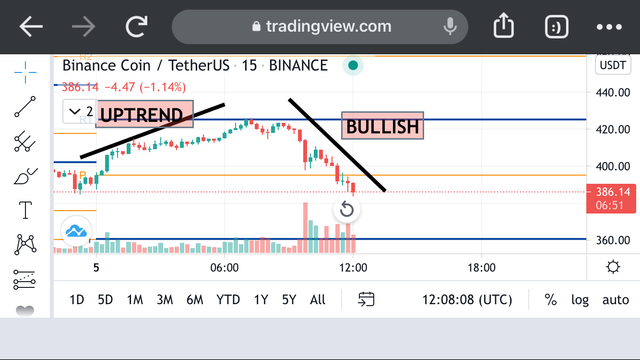
The downtrend seems to go on for a while but there seems ti be a possible change of an uptrend, itll be advisable not to make a move but observe the market and probably include the use of other indicators before placed a buy position.

weekly price forcast for crypto coin BTC
BTC in is full form is known as the bitcoin. One of the first leading crypto currencies founded in the year 2008. I was invented by a person or group known as “satoshi nakamoto” and grew from as low or lesser than a dollar to reaching its all high as $63,729.
WHY BTC
BTC was the first crypto i ever bought, i didnt real buy it because i full understood it or understood how it worked. I bought it based on popularity. Since then i have grown a reasonable amount on knowledge on not just BTC but the cryptoverse at large. BTC jas shown really impressive movements from the last time i saw it and it had grown from less that a dollar to up to $64,000 dollars which is really impressive. I joined BTC when it was still at around 10000 or less and since then i would love to say it has shown really great improvements.
| BTC stats and Prices | ||||||||||
|---|---|---|---|---|---|---|---|---|---|---|
| Price | $38,068.07 | |||||||||
| Market cap | $712,394,366,704 | |||||||||
| Trading volume | $70,636,652,365 | Market cap rank | #1 | |||||||
| Circulating supply | 19millionBTC | |||||||||
| Total circulating supply | 21million BTC | |||||||||
| All time high | $64,804 | |||||||||
| All time low | $67.81 |
Forecast (BTC/USDT)
Today ill be using the BTC/USDT charts, to make my forecast.
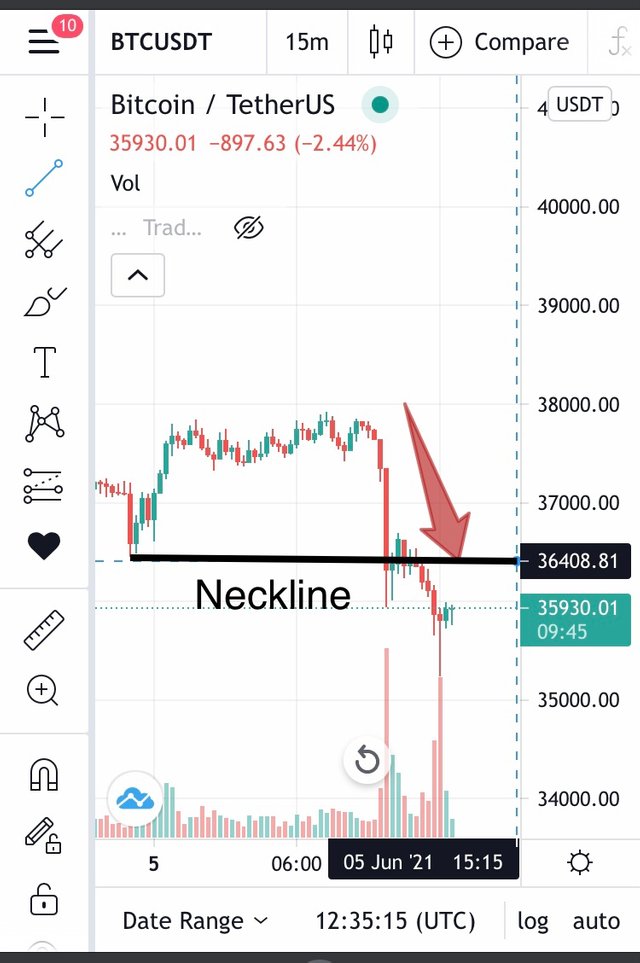
Using a 15minutes time frame, from the chart you can see the movement of prices up tot the point where it begins to experience a dip in prices. A previous swing can be marked down to show a neck line, with expectancy the prices are meant to go past $36408 before tommorrow.
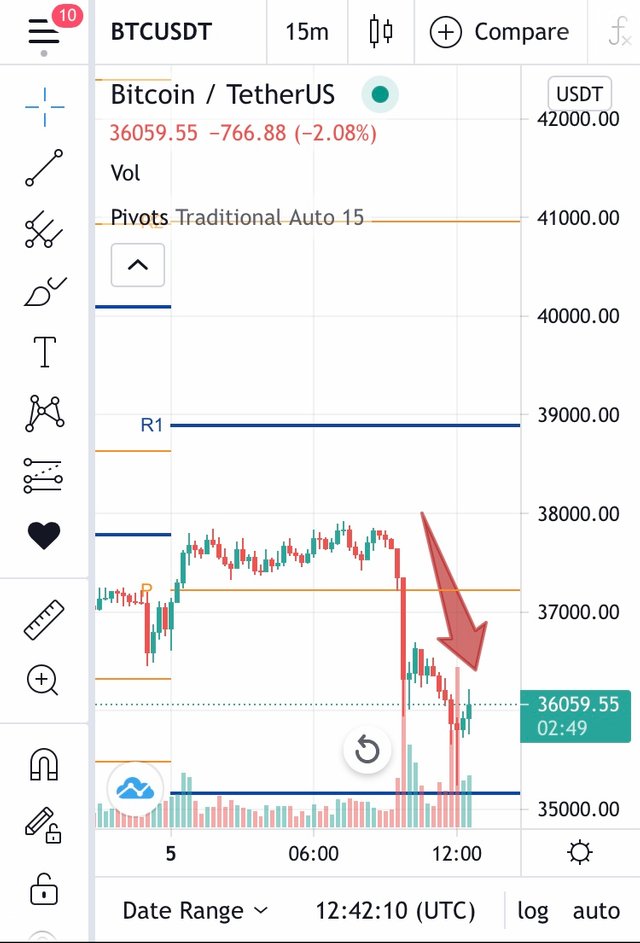
Using pivot points, the prices moved below the pp level causing the downtrend, there . It seems to be forming a swing, further more ill explore other indicators to ensure my trade.
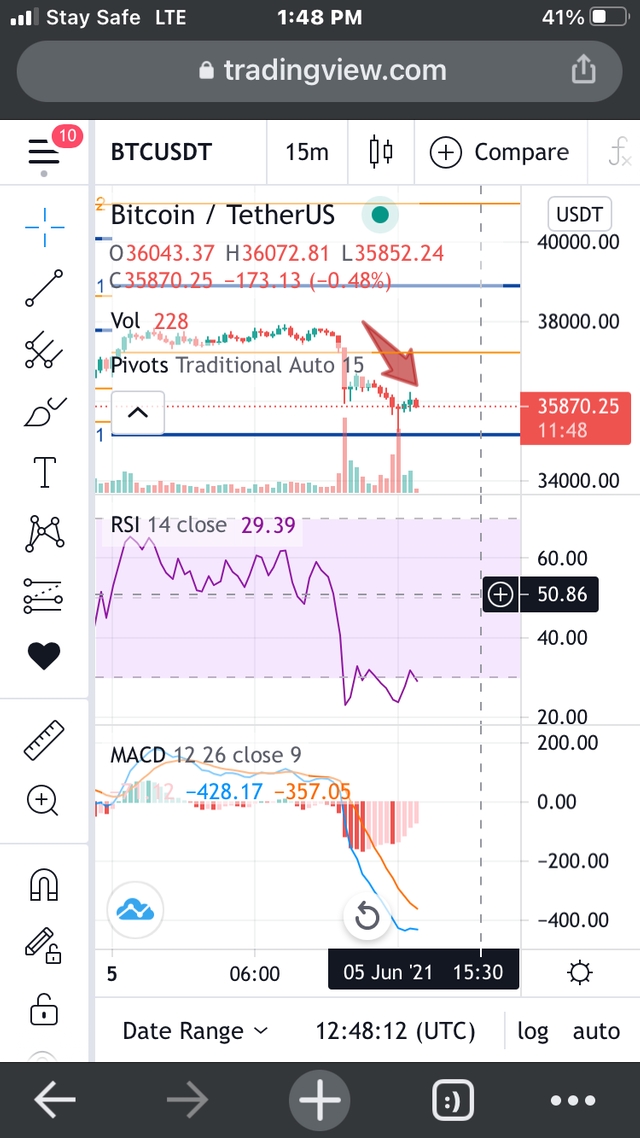
The prices seemed to have given a wrong signal. From the RSI you can notice the prices fall below 30 meaning its been oversold, it looked as though it came up back to to normal but shortly after it dips in some more, although eventually the market would have to correct it self sooner meaning it'll rise again The MACD histogram shows possible signs of an uptrend . Previously the macd line have crossed above the signal line leading to the downtrend possible rival is there, ill place my stop loss at 36,408 and a sell position.

In conclusion
Using pivot points may be easy to use but applying it correctly is where the problem is, with time and dedication it would become easy for you to spot out resistance and support levels. Traders are advised to use other indicators when to ensure a better trade. In the aspect of BTC i believe bitcoin will regain its former price and beat its all time high. The battle between crypto and fiat currencies have affected the whole crypto market it general most especially BTC although btc seems to be regaining itself after its recent dips. While the coin may be having such issue traders can take advantage of it , knowing when to place sell positions and buy positions can help u gain lots of profits. This assignment has even really educational and i hope yo see more next time thanks.
CC
@stream4u
Hi @spyrex
Thank you for joining The Steemit Crypto Academy Courses and participated in the Homework Task.
Your Homework Task verification has been done by @Stream4u, hope you have enjoyed and learned something new.
Thank You.
@stream4u
Crypto Professors : Steemit Crypto Academy
#affable