Crypto Academy / Season 3 / Week 7 - Homework Post for [yousafharoonkhan] …

Introduction
As investors, traders or aspirants you would need to be more knowledgeable of the market space in other to make wise investment decisions and skimming through google or reading text books may prove to be more task full and sometimes not enough. What if there was a site filled with information on all these assets and also provides a way to practice and implement them. Well luckily such platforms exist and hence “trading view”. It provides technical tools and information for making comprehensive trading analysis but what exactly is this trading view?

What is TradingView site?
Trading view can be defined as a social networking service where investors, traders or experts can come together to share ideas,predict trades and price assets with the help of important features on the site/app. On this platform you can perfect trading analysis using tools and indicators, check out current value of a market and connect to brokers for trading.
It exposes you to different trading ideas and strategies. It boosts your knowledge on market, methods , techniques and your skills in charting and trading. Since trading is risky , learning and training yourself on this platform increases your expertise and reduces your chances of placing poor trades.
HOW TO REGISTER AN ACCOUNT ON TRADING VIEW
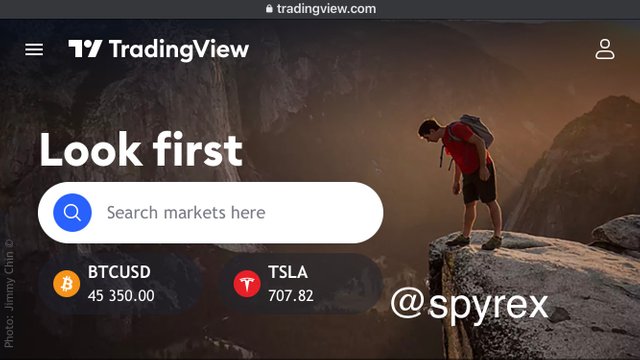
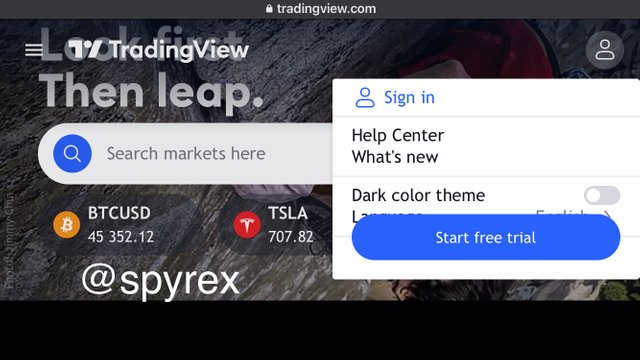
Firstly you go onto your browser and log onto trading view on the right on side you can see a profile icon, click on it to sign in

Once youve done that, you’re met with a couple of options. So go to start free trial which is at the base of the options . Click on it so youll be able to create an account
The link now directs you to a page with various options on plans to choose from and limits for each subscription.
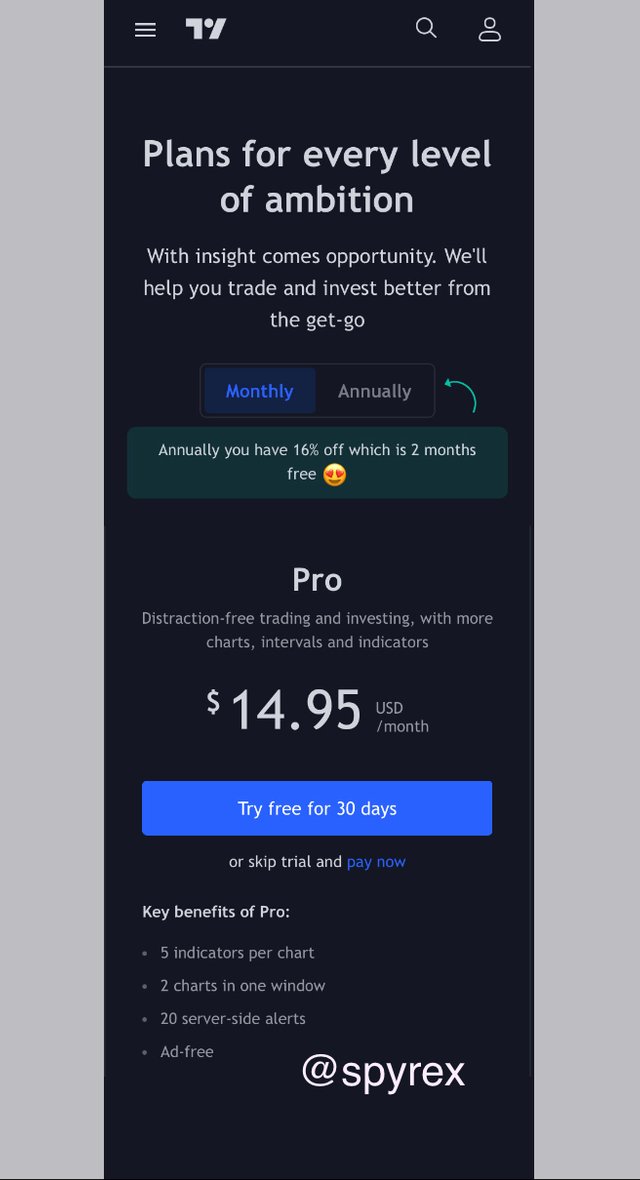
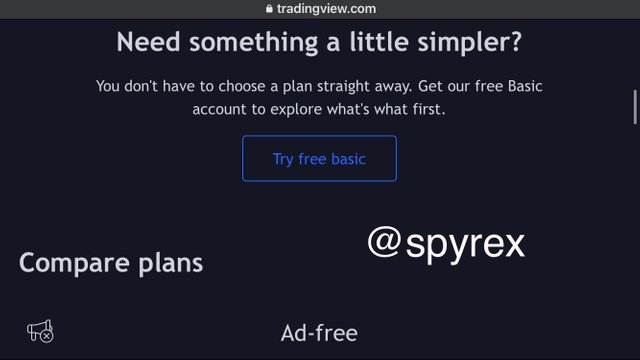
As a beginner not fully aware of what im getting into i wont go for the advanced options. You can scroll down below and youll find the “try free basic” option. Click on it
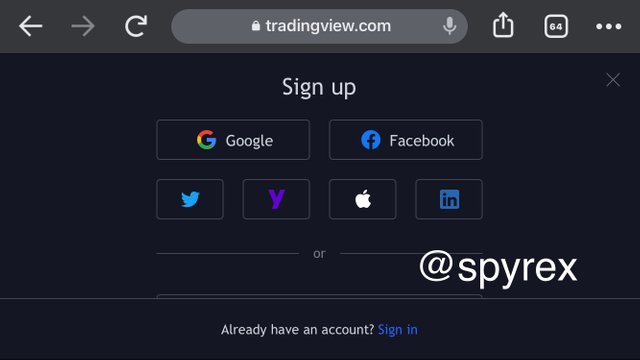
Next it takes me to the signup page where i can final open my account. You can use your gmail, social media accounts , apple login( for iphones etc)
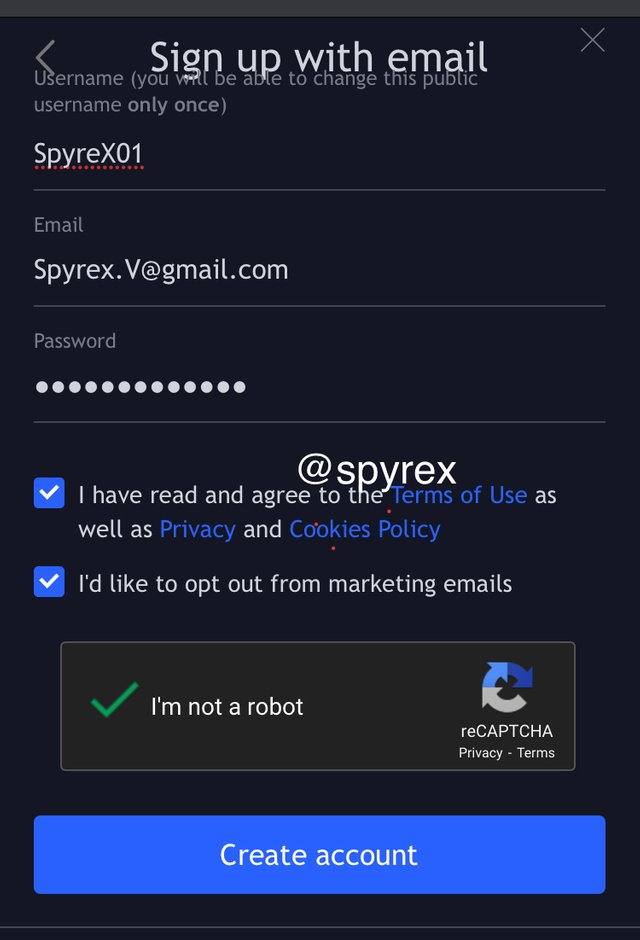
I used my gmail and now i have to fill in the required details and fill in my captcha to ensure I’m not a bot. When you’re done, you click on create account.
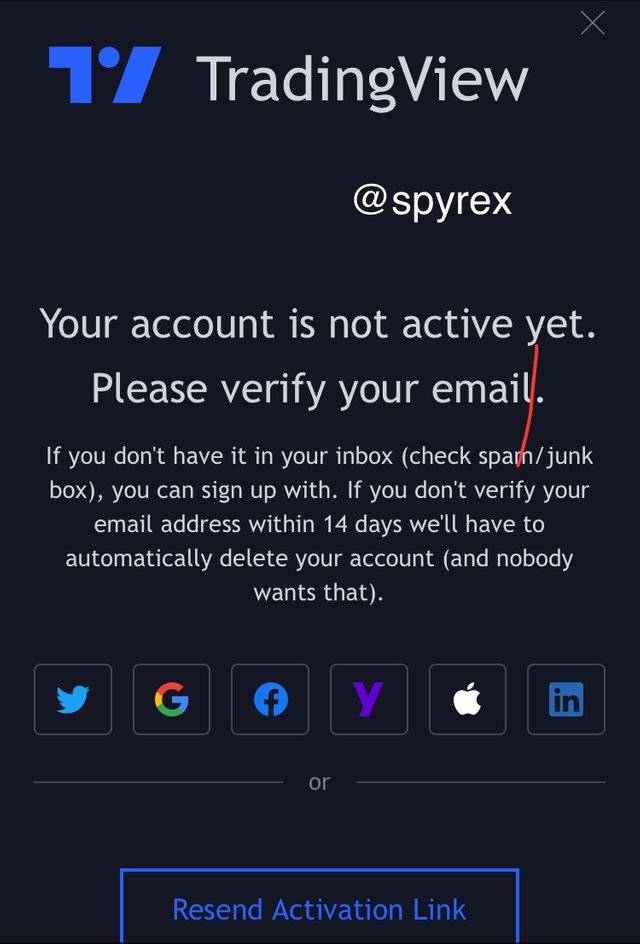
After that it sends a link to your gmail account which was used for registration. The page directs you to go confirm your gmail account
Next the link directs you to a new page for the final registration process, insert any profile picture of your choice and user name then click on create
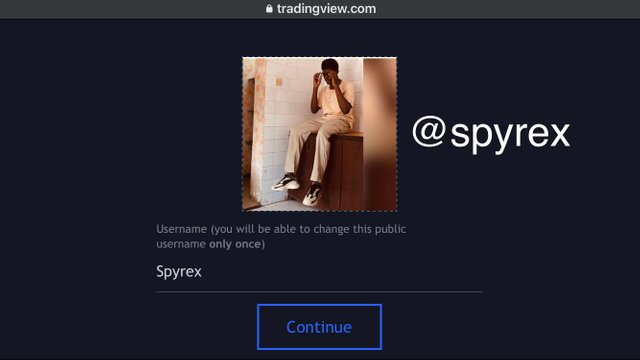
Now your account has been created , yoy can go explore the features and learn how to trade.
DIFFERENT REGISTRATION PLANS ON TRADING VIEW
If you noticed in the illustrations while showing how to create a trading view account, we came across various registration plans which consists of 4, pro, pro+, premium and free basic plan.
Pro plan: this plan isn’t exactly free. To make use of it , you’ll require a monthly subscription of $14.95 . It comes without those annoying popup ads hence its distraction free and has more charts, intervals and indicators
Benefits of using pro planIt can make use of 5 indicators per chart
Accepts 2 charts in one window
Has 20 server-side alerts
Its Ad-free
Has volume profile indicators
Custom time intervals
It can multiple enhanced watchlist
PRO+ plan - like the pro plan, this plan isnt free either. You’ll require a monthly subscription of about $29.95 to make use of it. The price is worth it though as it come with certain benefits such as
Allows 10 indicators per charts
Accepts 4charts in one layout
Provides intraday exotic charts
Has a 100 server-side alerts
Has indicators upon indicators
A chart data export
Creates charts based on custom formulas etc
Premium plan- this is the most expensive of the other plans with a monthly sub of about $59.95. It provides the highest precision and maximum data to capture all possible opportunities. The package comes with its benefits as well
Allows 25 indicators percharts
Allows 8 charts in one layout
Allows 5devices at the same time
Provides alerts that does not expire
Publishes invite only indicators
Provides 400 server-slide alerts etc.
Free basic plan - this plan is mostly for newcomers into the app. If you are not aware on how to use the app very well it’s advisable to not subscribe for the other packages but do this instead. You don’t have to choose a plan straight away you can just get the free basic plan so you can explore what trading view is all about and how to use it before advancing
features of tradingview
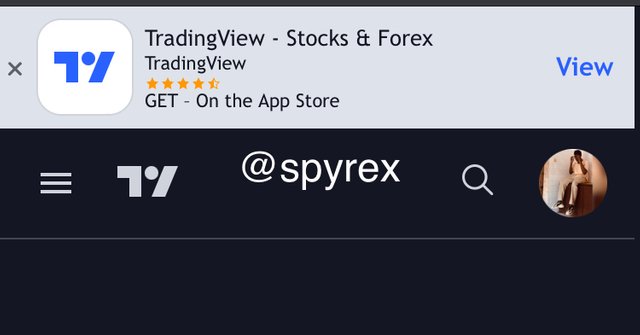
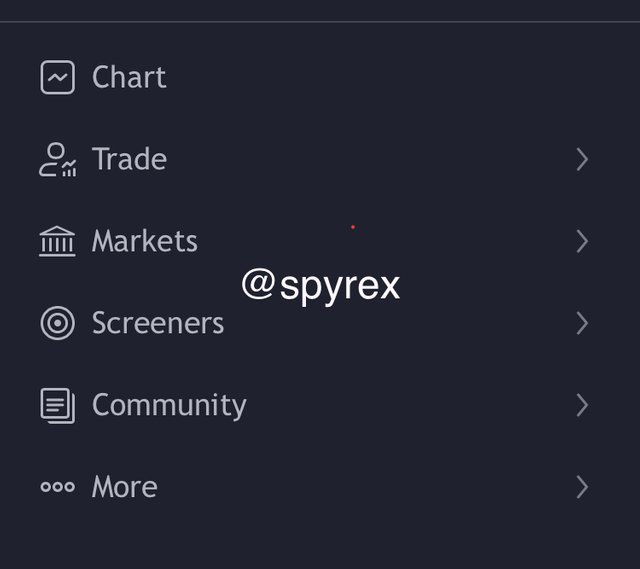
When you’ve created your trading view account whats next, well its time for you to explore what its about. There are various features on the platform which makes things easier for explorers and traders alike . They are situated on the homepage as you log in. Ill focus on the main 5 today, the charts, the trade, the markets, screeners and community.
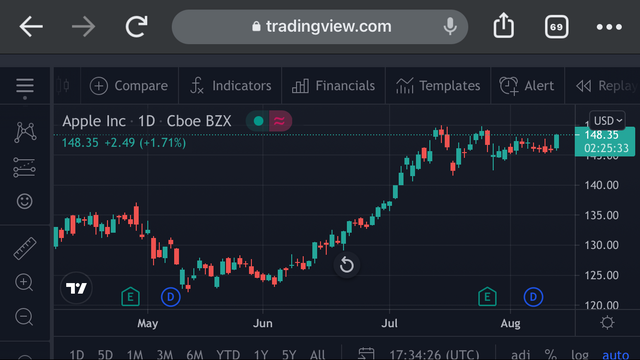
- Charts
This is one of the popular features on the trading view platform. Its where you carry out your technical analysis and predictions with the use of trading tools and indicators. Its one of the most important features on trading view. Asides that you can modify and edit your charts or tools alike to suite your needs.
- Trade
When you click on this option you are faced with two sub options top broker and broker awards.
The top brokers provide traders with information on the best suitable options for making their trades. It provides genuine reviews from actual clients,relevant offers and terms from brokers for trading right from this platform .
Broker awards is a small competitive community where different brokers show off their brokering abilities on an international stage. There are annual winners which is displayed within this space. Outside users are provided with information and comments from various expert traders and brokers within this space on how various markets function.
- Market
This option ranges from cryptocurrency’s,currencies, stocks, indicies futures, bonds, sparks. It provides information on all the financial markets in the world, displays daily trends, status and live updates on them. Traders come here to get information to enable them perfect their analysis or decide which security to invest in.
- Screeners
The sub options within this feature ranges from stock, forex and crypto screeners. With this screeners you can make use of indicators and get best results inna short time.
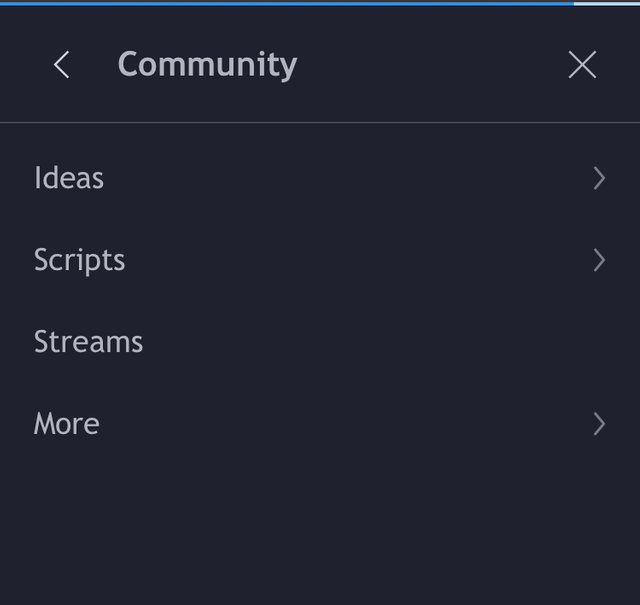
- Community
This feature comes with sub options such as ideas, scripts,streams and more. This feature enables circulation of shared information within trading view. You can see published analysis, trends, futures etc
MY FAVORITE FEATURE
My favorite feature would be the chart feature,
Why?
I like it because its best for practicing and perfecting different techniques. Other features are nice sure but with the knowledge gathered from them you can come practice it here and learn how to use your indicators and read charts. For example crypto academy here on steemit teaches us everyday on how to make analysis and predict markets where else to practice it other than on a chart and not any chart but my best reference “trading view”. It has helped me alot in the past so its my most recommended
How to set up a chart in TradingView and using two tools to edit it
To set up a chart on trading view firstly you open the site then click on the left menu and choose the chart options

MODIFYING MY CHART
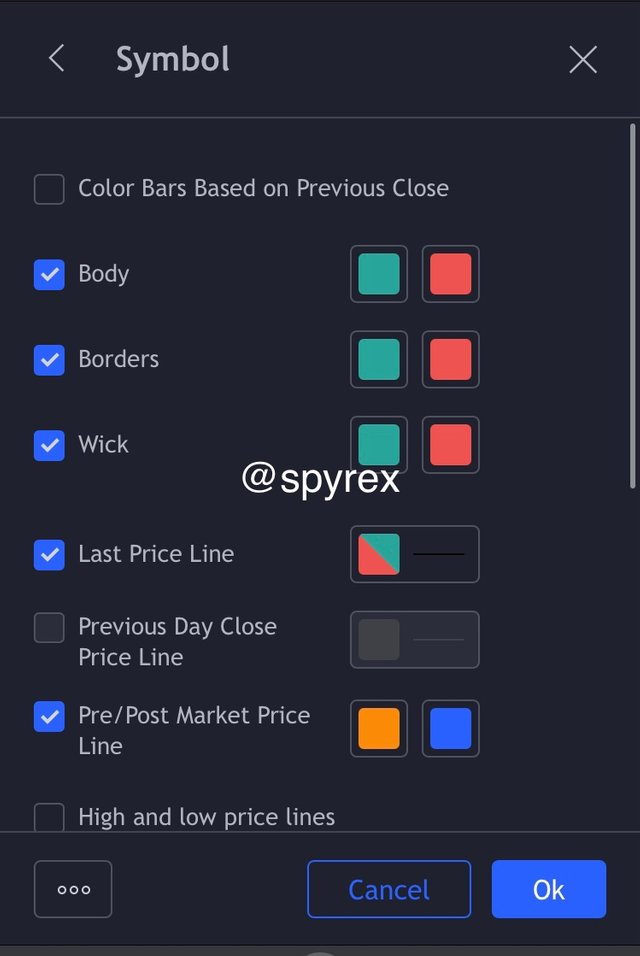
to do this firstly i click on the gear option on the right hand side of the screen. A number of options pop up containing our fillers for various symbols. You can edit or modify any of your choice. Ill use the black and white filler
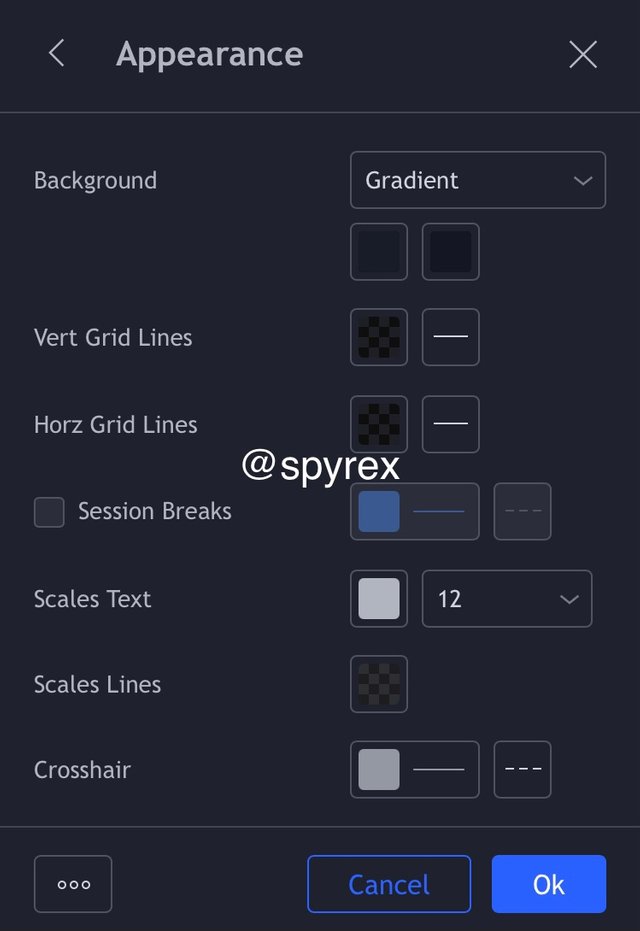
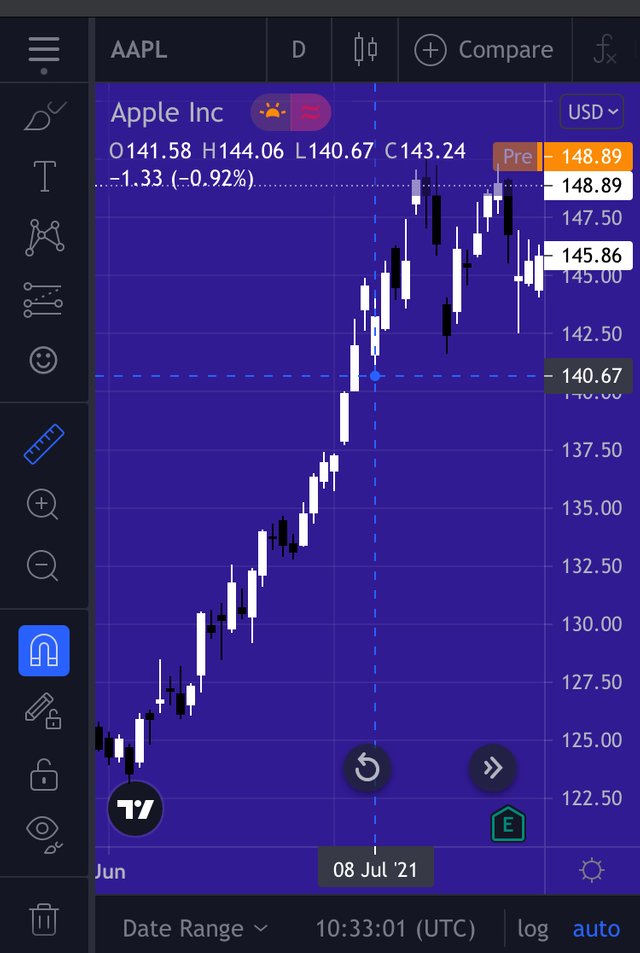
To change the background color ill navigate to the appearance option and pick out the filler of my choice for the background color . Ill use the blue filler
USING TOOLS TO EDIT CHARTS
There are bunch of tools that can be used but one of the most widely used is the ruler 📏.
You use it to measure a particular peice point and its volume to measure the exact amount.
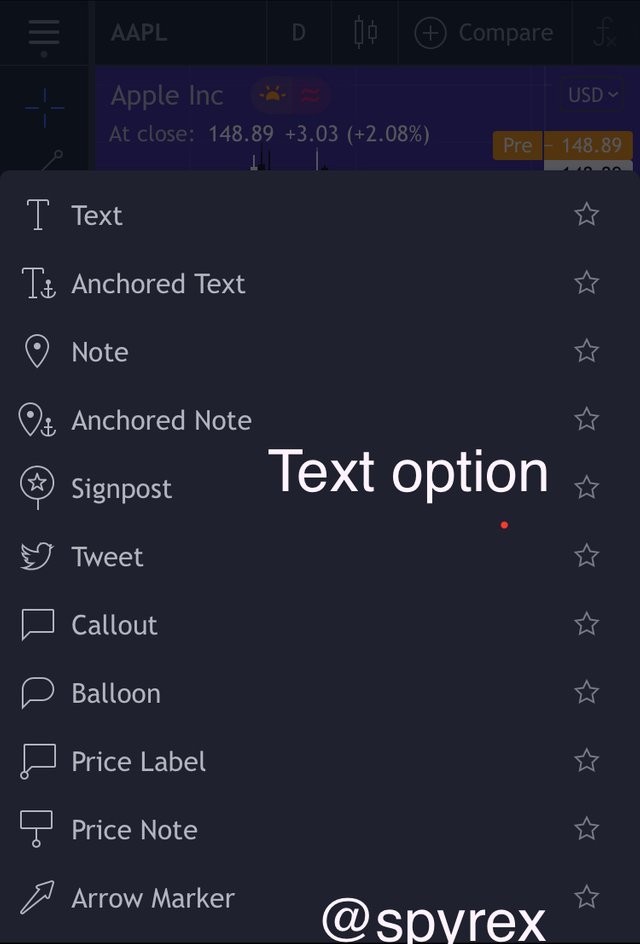
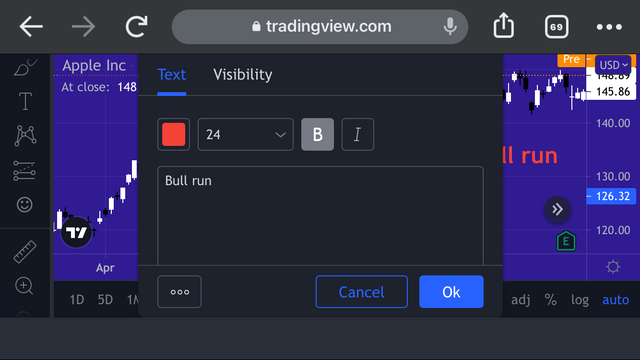
The text option is used to adding write ups on the chart. To note a reminder or markup point.
how to add an indicator in a chart
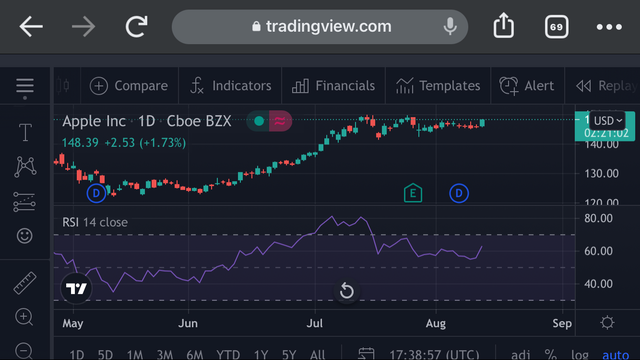
In making trading analysis, you have to predict market movements in other to make safe trades. With the help of technical tools these analysis have been made easier. There are various indicators which traders use, multiple indicators make a safer trade but today ill be showing how to insert indicators on trading view and ill be using the RSI
Firstly you open your charts and go to the fx indicators option where you’ll meet a search option.
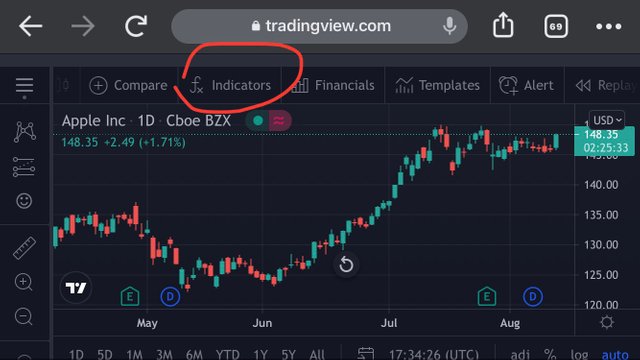
You input the the name of the indicator your wish to use on the search bar and once it shows up you click it
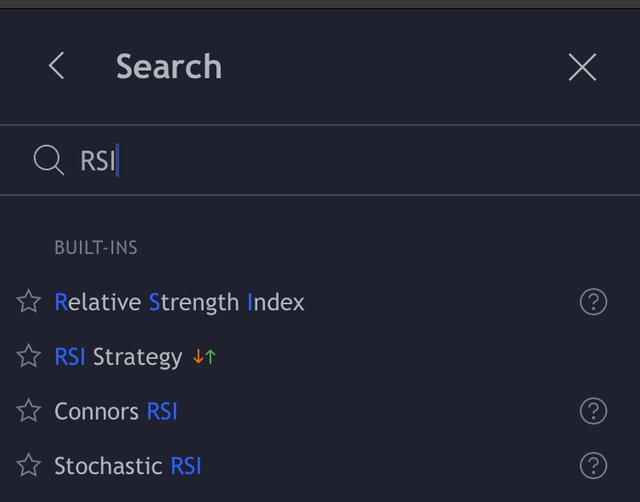
Once you’re done with that. The indicator is automatically added to the base of the chart and you can make use of it.
My favorite indicator
In as much as there are so many indicators and i find it hard to pick one but my favorite pick would be based on simplicity. Analysis trades isn’t easy at all the one indicator that simplfies it for me based on bull and bear trend is the RSI.
The relative strength index basically is a momentum indicator that measures movements in overbought and oversold price changes and it was developed by J. Welles wilder Jr who was an American technical analyst.
The oscillator is measured with a line graph moving from 1-100, when the moving charts move above 70 then its been over bought and when it goes below 30 its been over sold. General knowledge is that the market would try to correct it self when that happens so when its been over bought it’ll definitely fall right back and when its been over sold it’ll rise back up.
Its less complicated compared to others and quite popular if i might say
Is TradingView useful in predicting the market for cryptocurrency?
Yes, trading view has lived up to its reputation and I believe it can be very useful in predicting the crypto market. The platform provides information for all types of markets which is what drives investors to use the app.
Considering it vast opportunities and information shared by different experts on the community , these information can act a guide for newbies and traders alike.
It provides multiple choices of indicators which can as well be used for crypto analysis . You can use the available tools to make a more detailed work and not just that you can as well publish your analysis within the community. Most site don’t produce as much vast options as this.
It has a hundreds or crypto pairs within its data base to understand and make analysis for trades. It even has a feature for information regarding cryptocurrency and other markets so yes, its very useful in predicting markets in the cryptocurrency space.
In conclusion
Trading view is a well detailed community for investors and traders to come together to gather and share knowledge on various financial markets. Its a social community space filled with latest world new on the markets in general.
It has provided easy to use tools and access to multiple indicators and other features as well.
Thanks to our professor @yousafharoonkhan and this assignment i hope we’ve given the readers a reason to explore this platform and delve into the market space.
Respected first thank you very much for taking interest in SteemitCryptoAcademy
Season 3 | intermediate course class week 7
respected need more to explore the each point , that you think to gain the good grade, so your work is good but need more effort to make it , quality of presentation,
that all will help you to bring good grade
thank you very much for taking interest in this class