Trading Strategy with Median Indicator - Steemit Crypto Academy |S6W4| - Homework Post for Professor @abdu.navi03


INTRODUCTION
Good evening Steemians , I will be responding to assignment given by professor @abdu.navi03 on "Median Indicator" . The benefit of Indicator in trading cant be overlook. so lets begin as we look at median indicator.
Understanding Median Indicator
Technical Indicators are so much beneficial to traders in technical analysis because a Good Trader can't make a good trading decision without making use of indicators in the market to trade. We have so many Technical indicator like EMA, MA, RSI etc for making good trading decision in the market. The median indicator is like other indicators that works in respect to market trend but slightly different because the median indicator make use of market volatility by making use of the channel that was created from the ATR from the median line alongside the middle value of range at a given period of time.
The Median indicator identifies the median value between highest highs and lows within a given interval . When we compare the median indicator to EMA at the same time interval, the difference forms a colored cloud which is use to determine the current trend of the market either bullish or bearish therefore it is very useful to traders and investors in making a good buy or sell order. The Median indicator color scheme is shown a manner that represent the direction of the market for instance a green coloration is spotted when the median is greater than EMA , this shows an uptrend which also signifies that traders are in control of the price but when a purple color is spotted and EMA value is greater than median value, this shows a downtrend which also signifies that the sellers are in control of the market.
Parameters and Calculations of Median Indicator
Median indicator makes use of the ATR and multiplier and I will be using the Tradingview for my illustration.
Median length is the total number of data points used when calculating the median and it's usually 3 .
ATR is the period considered when calculating the median ATR and its usually 14 .
ATR Multiplier is the value ATR is multiply by ATR when the the upper and lower bands is formed and its usually 2. T
Upper band is Median length plus 2ATR
Lower band is Median length minus 2ATR
How to add Median Indicator
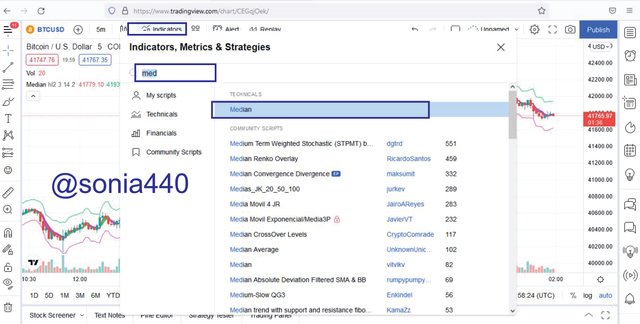
- First, visit Tradingview Website to view the price chart .
- Click on indicator menu
- Type in Median on search to search , Then click on median to add the indicator to the price chart.
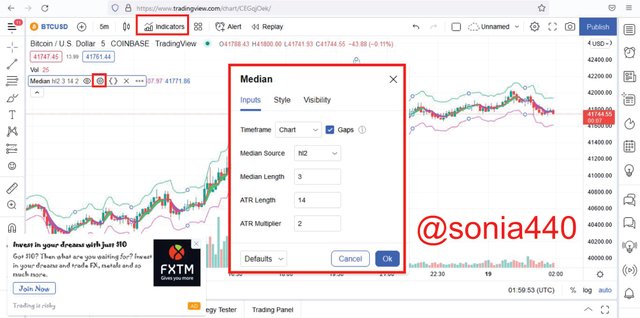
How to configure the Median Indicator
- Click on the settings icon to view and configure the indicator parameters
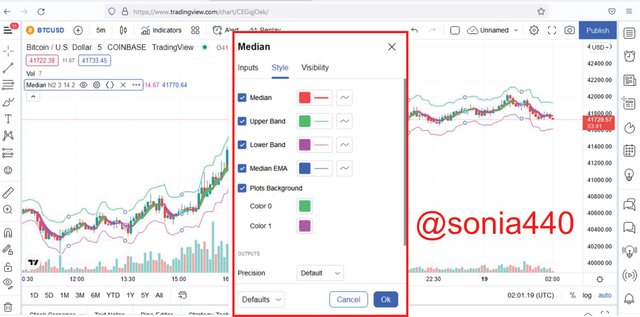
On the inputs tab we have the indicator median source, median length(period), ATR length, and ATR multiplier which can be configured and on the style tab we have the indicator line appearance.
In summary the median indicator makes use of the difference between the median and EMA ,Whenever the EMA value is greater it shows a purple cloud and a bearish signal is seen. Then when median is greater than the EMA , the indicator shows a green cloud which signifies a bullish trend.
Uptrend from Median Indicator
The median indicator is used by traders to spot the market trend either bullish or bearish. the median indicator makes use of the difference between the median and EMA ,Whenever the median is greater than the EMA , the indicator shows a green cloud which signifies a bullish trend. For instance below :
From the above image we spot the formation of a green cloud was seen which is an indication for a bullish trend and a buy signal can be placed.
Downtrend from Median Indicator
The median indicator is used by traders to spot the market trend either bullish or bearish. the median indicator makes use of the difference between the median and EMA , Whenever the EMA value is greater it shows a purple cloud and a bearish signal is seen. For example below:
From the above image we spot the formation of a purple cloud was seen which is an indication for a bearish trend and a sell signal can be placed.
Identifying Fake signals with Median Indicator
Technical Indicators are not always efficient and reliable that is why is always good to combine two or more indictors to get a near accurate result so median indicator can also give fake signals so it's advisable to combine it with other technical indicators so as to filter out false signals. for this part I will be combining the median indicator with the RSI indicator to filter out false signals .
The RSI indicator is a technical indicator that uses overbought or oversold to locate the market conditions. Normal it cross below 30 RSI level it signifies oversold and also bullish reversal should be expected but when it crosses above70 RSI level shows overbought and bearish trend reversal should be expected also . There fore when combining the RSI and the median indicator, the two should be corresponding but when they are both saying different things it signifies a false signal.
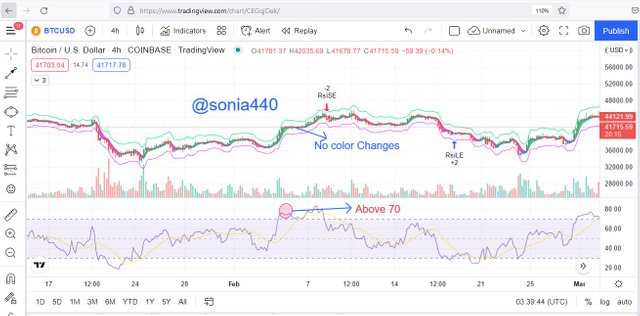
The Image above shows that the RSI is above 70 which signals a bearish reversal but the median indicator is showing green which signifies a bearish reversal. so is advisable for trader to wait so that the two indicators to be on the same page before trade is placed.
Opening a Demo Trade using the Median Indicator
For this part I will be trading ETHUSDT pairs using trading view for my analysis using median and RSI indicator and meta trade 5 for my trading.
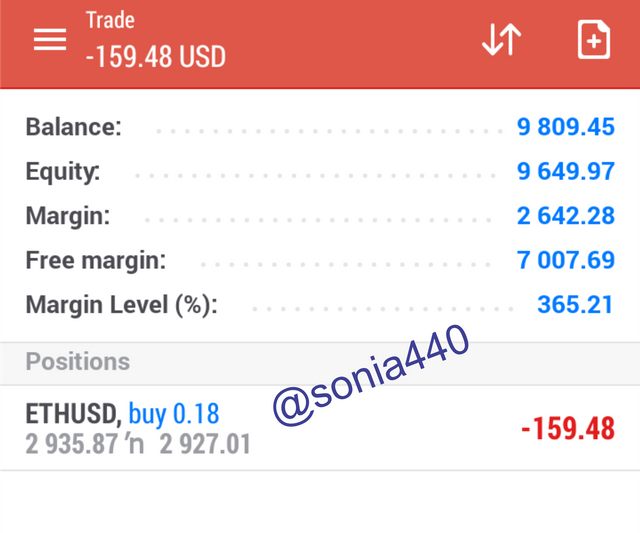
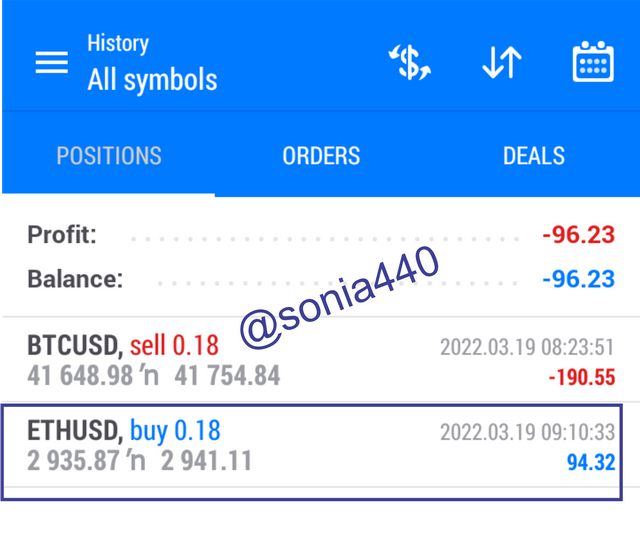
Buy Trade on ETH/USD
From the image below, I discovered that the market was in bearish foe sometime shown by the median indicator with a purple cloud but I spotted bullish candlestick stick which also signals a trend reversal so I used the opportunity to open a buy order. so I open a buy position. I executed the sell position on BTC/USD with 1:1 risk-reward ratio.
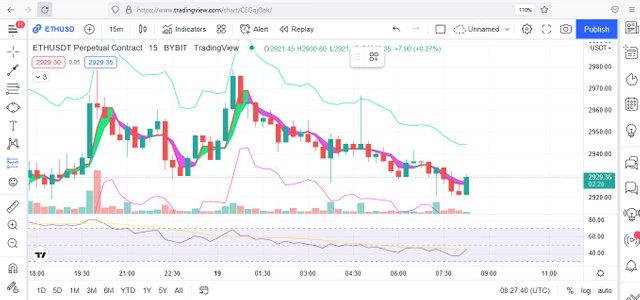
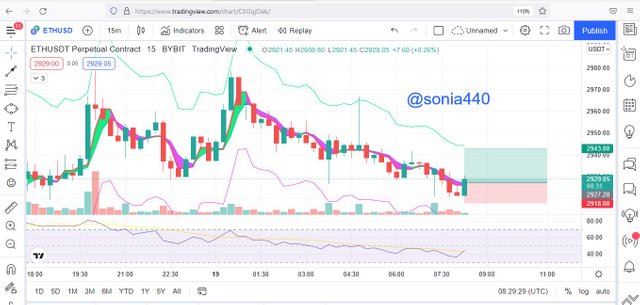
Screenshot from Metatrade5
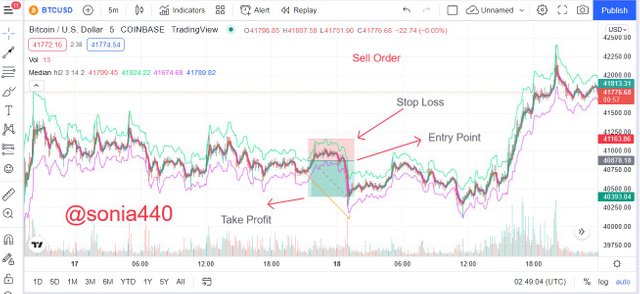
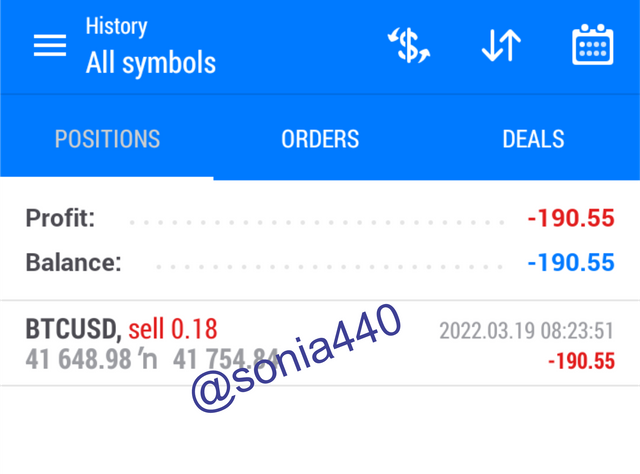
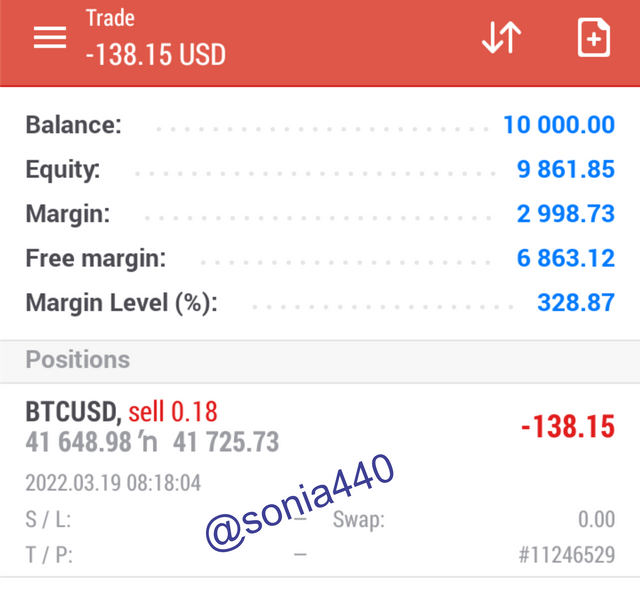
Sell Trade on BTC/USD
From the image below, I discovered that the market was in bearish foe sometime shown by the median indicator with a purple cloud. so I open a sell position. I executed the sell position on BTC/USD with 1:1 risk-reward ratio.
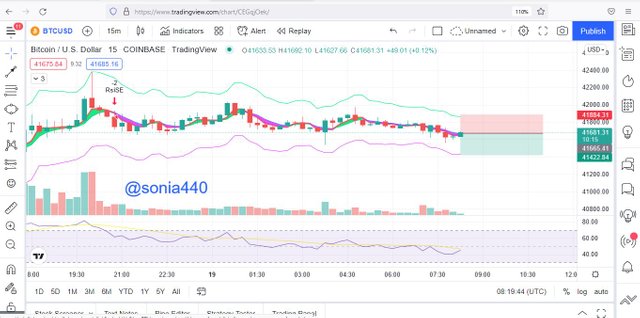
Screenshot from Metatrade5
Conclusion
Technical Indicators are so much beneficial to traders in technical analysis because a Good Trader can't make a good trading decision without making use of indicators in the market to trade. We have so many Technical indicator like EMA, MA, RSI etc for making good trading decision in the market.
Median indicator makes use of the difference between the median and EMA ,Whenever the EMA value is greater it shows a purple cloud and a bearish signal is seen. Then when median is greater than the EMA , the indicator shows a green cloud which signifies a bullish trend. Thanks professor @abdu.navi03 for this great lecture.
