Support and Resistance Breakouts - Steemit Crypto Academy |S6W3| - Homework Post for Professor @pelon53

Hello, greetings to everyone, it's another week in crypto academy, and I feel great to be making my entry for this week's course on support and resistance by @pelon53. Below, I've provided answers to the questions that were posed.
Take a look...

For one to be an effective crypto trader, so many things comes into play, one of it is an in depth understanding of the use of an indicator in chart analyses, another is the mastering of the resistance and support zones and how they can affect the outcome of a trade.
The significance of resistance and support in crypto trading cannot not be overemphasized, this is made evident through its continuous usage as an important tool for the determination of market direction in the financial market.
The support and resistance levels helps the trader to determine as well as forecast where the market is actually heading to and when its appropriate to place an order.
This tool also serves as a confirmatory signal to traders especially when the prices bounces off a resistance or a support to record a higher high or a lower low in any case. Through this, trades can confidently place their trade.
Furthermore, this tool helps the trader to efficiently employ risk management plan through the fixing of stop loss as well as take profit which is usually at the resistance or support level as the case may be.
The breakout of support and resistance in the financial market is always a critical point in the analysis of the chart. Ideally, prices bounces off support or resistance due to the market pressure always experienced in these zones, i.e selling pressure as well as the buying pressure. When prices surges above or below this zones, a breakout tends to occur. In some cases, the breakout usually retests the previous support or resistance, forming new one. In other cases, false breakout could also occur. In either ways, its imperative to employ the services of the indicator to help the trader in making a final decision.
In order to explain the resistance breakout, a chart of xrpusdt was loaded on a 2 hours time frame and using the Bollinger band indicator for analysis.
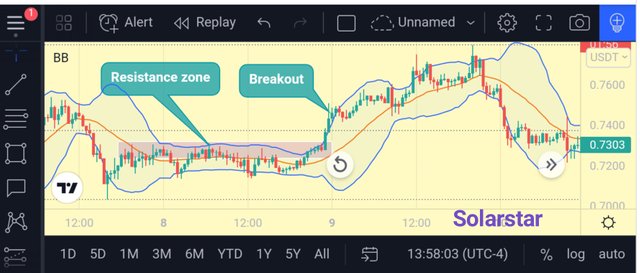
As observed, the Bollinger band indicator was added as a filter for the analysis. The upper band of the Bollinger served as the dynamic resistance and the lower band, as the dynamic support. Just as shown above, the price candles were able to breakout of the resistance zone to form a new higher high. This was also evident in the indicator as the price candles also broke through the upper band of the indicator.
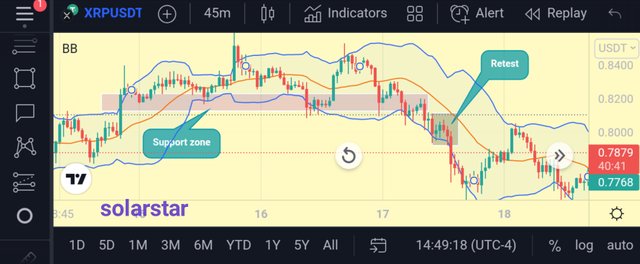
Just as explained for resistance, the support breakout is also similar. The Bollinger band indicator was also ployed on a chart of xrpusdt using a 3 hours time frame.

As observed, the price value was seen to breakout from the support zone, forming a new lower low. This was also evident in the Bollinger band as the price was seen piercing through the lower band of the indicator.
The support level tends to indicate that the buying pressure increases at that particular zone which is capable of driving the prices back in ascending order. However, when the buying pressure is not felt at this zone, the price candle breaks the support and continues in its descending order to signal a breakout, just as was shown above.
In the financial market, a time comes when the price candles returns back to the resistance-support zone after a previous breakout. This phenomenon is known as false breakout. This occurrence is not far fetched in the crypto market, as the technique is usually being employed by whales so as to trick gullible traders into taking wrong positions.
False breakout always comes with heavy losses, especially if the trader didn't employ a good risk management system, hence, its often advisable to watch out for this abnormally before taking a position.
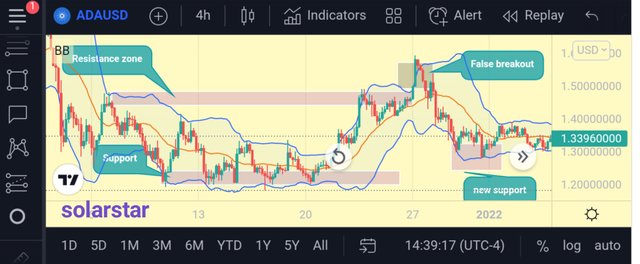
The chart of ADAUSD above clearly shows the emergence of a false breakout. The price was shown to immediately fall back to the resistance zone after a previous breakage.
The best way to avoid the whipping hands of false breakout is to employ patience in the market. Any time breakout occurs, the trader should be able to wait for a retest of the previous support or resistance, when this happens, its then safe to place a trade. The previous support will turn to the new resistance as well as the previous resistance turning to the new support in either cases.
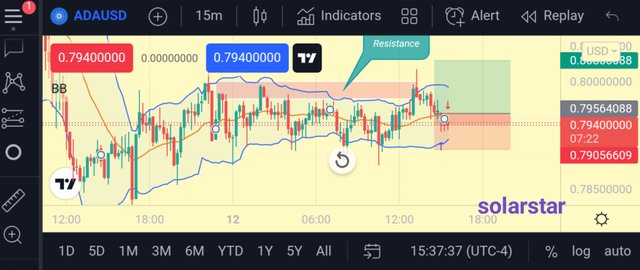
In order to analyse the resistance breakout in a crypto chart, I loaded the adausdt chart on a 15 minutes time frame just as shown below
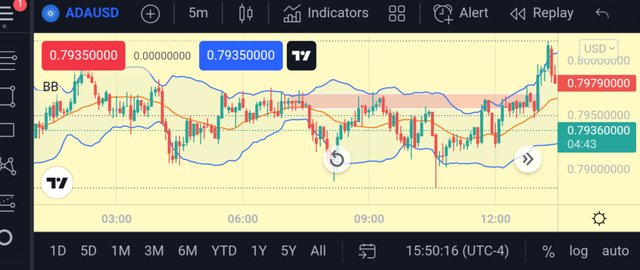
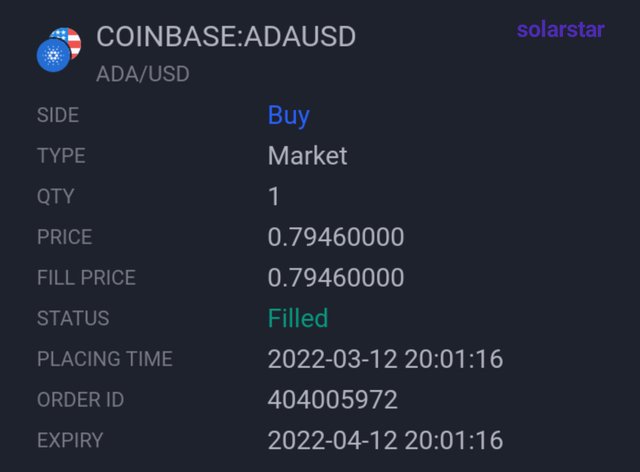
From the chart, its observed that the price candles were constantly bouncing off the resistance zone till the breakout finally occurred. After the breakout, I waited for the retest to happen so as to place my buy order. It did finally came and the buy order was placed. Stop loss and take profit also followed after.
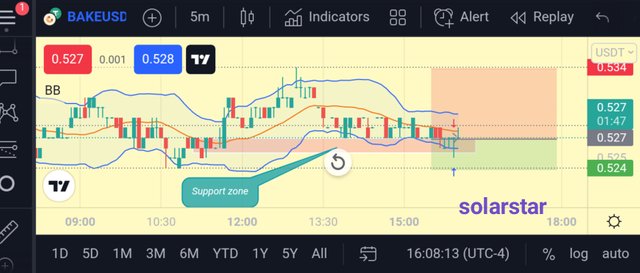
Just as previously stated for the analysis of support breakout, I loaded the BAKEUSD chart on a 5 minutes time frame.

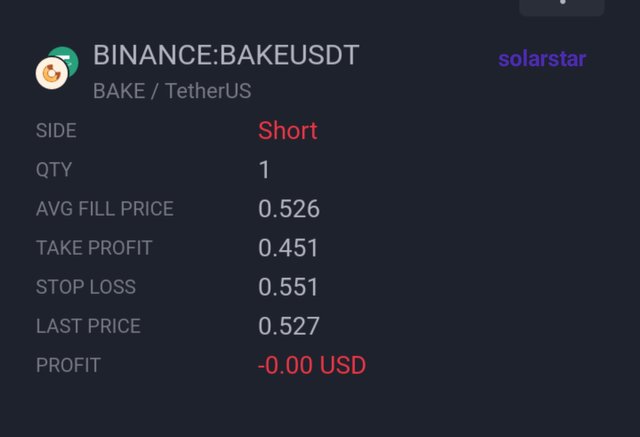
Just as indicated above, after the breakout ensued, I patiently waited for the retest to happen so as to affirm the sell order. This did came, and I immediately placed a sell order just as shown below. The stop loss as well as the take profit were both set also.
conclusion
The use of resistance and support in the determination of market entry and exit points is very essential. This is the basis of crypto trading and all intending traders needs to get acquainted with the dynamics of this tools and how they work.
False breakout do occur sometimes, hence its necessary to always use a reliable indicator so as to spot such scenarios and filter them so as to obtain optimal results in the trade.