Median Indicator - Steemit Crypto Academy |S6W4| - Homework Post for Professor @abdu.navi03
Hi everyone, feels great to participate in this week's crypto Academy. Kudus to professor @abdu.navi03 for an outstanding lecture on the median indicator. Going through this lecture, has afforded me the opportunity of further expanding my wealth of knowledge on technical indicators. It was wonderful learning.
Below, I've provided answers to the questions that were asked at the end of the lecture. Take a look...

Technical indicators are very important tools in the financial market. They form the basis by which all trades are made. They detect the market trends as well as the market forces. They are more like the bedrock of crypto trading. Understanding how a particular indicator works is critical for the success of any financial market trader. An indicator of priority today, is the median indicator.
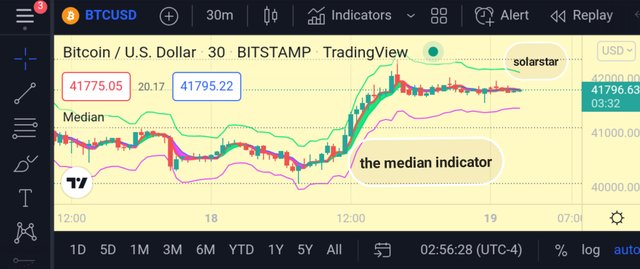
The median indicator is a trend base indicator, it utilizes ATR value to calculate the volatility of the market. This indicator uses a median line which is similar to the EMA to help determine the uptrend and downtrend through the appearance of the purple colour or a green colour. The bullish signal can be confirm when the median indicator line crosses above the EMA with subsequent appearance of a green cloud. While the bearish signal is confirmed when the median line crosses below the EMA of the same length, giving rise to a purple cloud.
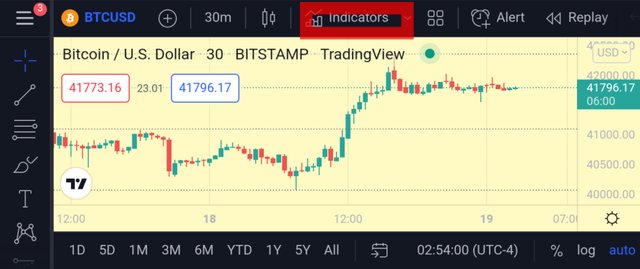
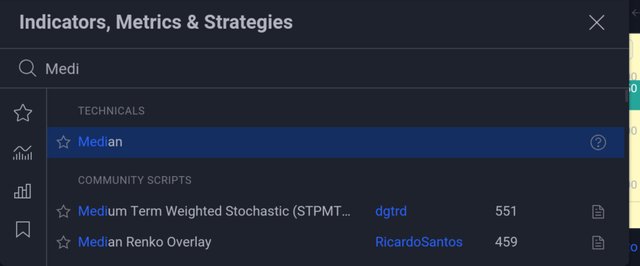
To add the median indicator on a chart, I clicked on the indicator setting and then, I selected the median indicator from the drop down and closed the tab.
The median indicator can as well be configured to meet the trader's taste depending on the trade pattern
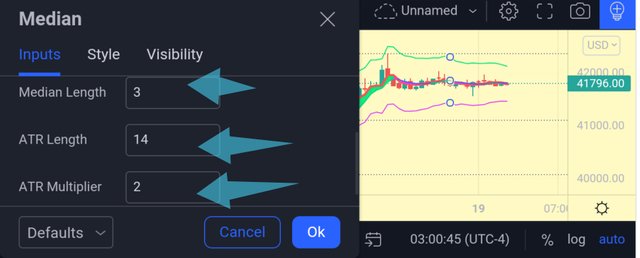
From the above image, it can be observed that the median length was kept at a default of 3, the ATR was maintained at 14, while the ATR multiplier was affixed at 3.
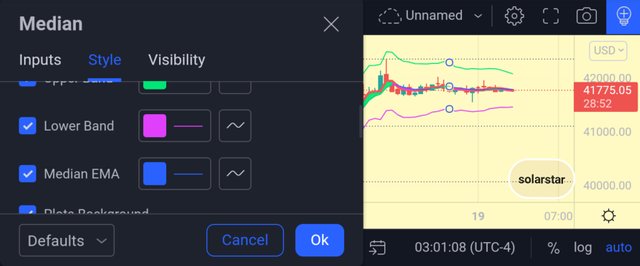
The style was also configured appropriately to meet the trader's taste.
The median indicator uses the ATR and the median length as two of its most important parameter for the determination of market trends. This two tools are used to plot both the upper band as well as the lower band of the indicator.
Upper band = median length + (2ATR)
Lower band = median length - (2ATR)
Median indicator = ATR %change (median value, EMA value)
ATR is always 14 by default, but can be changed by the trader to any value that will favoir the trade pattern.
To determine the uptrend, using this indicator, two indices comes into play. The median indicator cloud must change from pure to green, indicating a market reversal, this condition is suitable for traders to place their buy orders. Also, the median value must be presently higher than the EMA value. With this two things established, a trader can conveniently place a buy order.
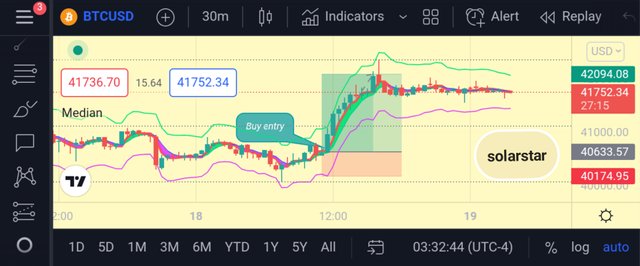
The chart above is the chart of xrpusdt on a 3 hours time frame. from the above chart, it was observed that the median line crossed the EMA forcing the colour to change from purple to green. At this point, a buy signal can be placed at the nearest purple colour below.
4-Downtrend from Median Indicator (screenshot required)
In order to determine downtrend in the financial market, similar method was used as with the first one. Two indices are involved as usual.
For the bearish trend, the median line must cross below the EMA to give a sell signal. Conversely, the median indicator cloud must change from a signal to be conformed.
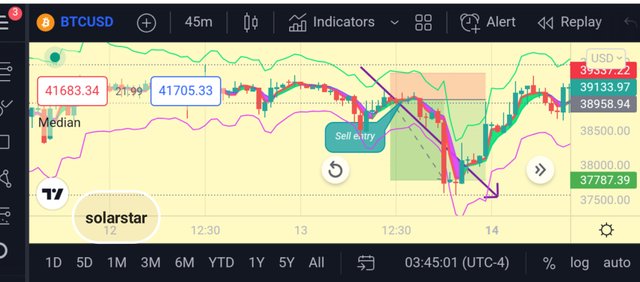
From the above chart, it was observed that the median line fell which was preceded by a puple colouration of the cloud.
When this signs are noticed, a sell order can be placed.
For the trading to be effective, with minimal loss, its always advisable to combine two or more tools for accurate result as no single tool is 100% efficient. So on that note, I'll be combining the RSI together with the median indicator to eliminate fake out in the financial market.
The RSI is a volatility indicator, it signifies when an asset is in an overbought position or when its in the oversold region. This two concept can help the trader predict accurately, market trend reversals.
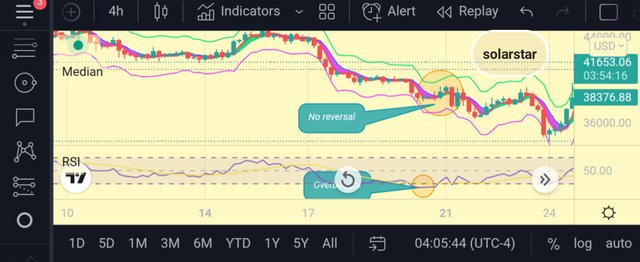
The photo above is a chart of BTCUSD on a 4 hours timeframe as observed above. The RSI was able to filter the fake out by the median indicator. The RSI showed that the price of the asset was in an overbought region, this Ideally should have lead to a price reversal, however, the median indicator was still indicating a strong bullish trend.
In order to open trade using a median indicator, the ADABTC crypto pair was employed on a day time frame, just as shown below.
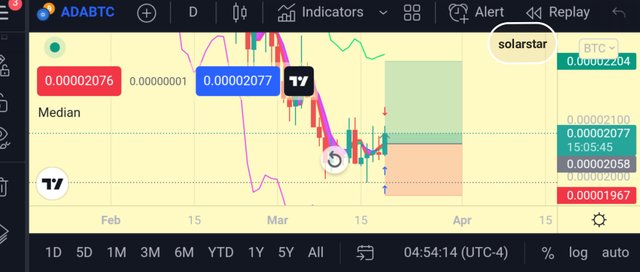
From this photo, a buy order was placed immediate, there a market reversal from the bearish trend to the bullish trend, this was evident through through the appearance of a green cloud o the low point.
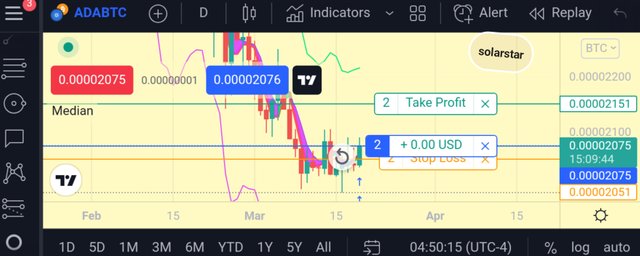
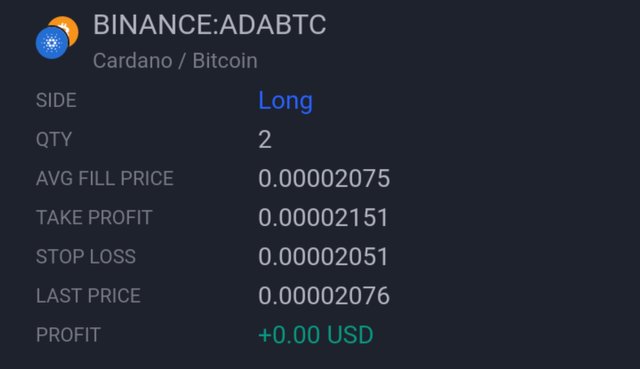
Stop loss and take profit were also set appropriately for an efficient risk management in case of any eventuality in the financial market.
sell order
In order to place a sell order using this indicator, a crypto pair of trxusdt was employed on a 3 min time frame


As observed above, the market was in a bullish trend till there was a reversal. This was evident on the appearance of a purple. At this point, a sell order was placed and the stop loss and take profit also affix.
With the help of this indicator, two orders were successful placed using the market principle.
Conclusion
The median indicator is a very useful and important trading tool in the financial market, adequate measures should be made to research and study this indicator extensively, before using it on a real time trade.
However, its always advisable to use two or more of such tools while carrying out a trade as no single indicator is 100% efficient. Addition, this indicator provides one with alternative in the financial market, as no knowledge is ever lost.