Crypto Trading with Moving Average] - Steemit Crypto Academy | S6W2 | Homework Post for professor @shemul21

Greetings to everyone, I feel great to be back again this week on crypto Acadamy season 6 wk2. The lecture with @shemul21 on moving averages was precise and indepth, I got to learn some new things as regards crypto trading. Below is my assignment post, have a look...

The moving average indicator is one of the most widely used indicator for crypto trading. Technical analysts utilize this magnificent tool to ascertain the market trend which is very vital and as well paramount in the financial market. This inexplicably tools studies the prices of an asset or security over a specified period of time and records it. This is usually represented in a form of a line on the chart. In order to identify the future trend direction, the MA is usually calculated from past data which help technical analyst spot intending support as well as resistance levels on a particular trade.
The MA uses different time frames to spot market trend reversals, the choice of time frame to use is purely at the trader discretion. Technical analyst studies this periods to determine which will be suitable for a particular trade. Its of record, that shorter MAs enhances the efficiency of a shirt term trade, where as, the longer MAs enhances that of long term trade.
In the example below, the 100 moving average indicator was used to study the chart of the crypto pair XRPUSDT on a 4 hour time frame.
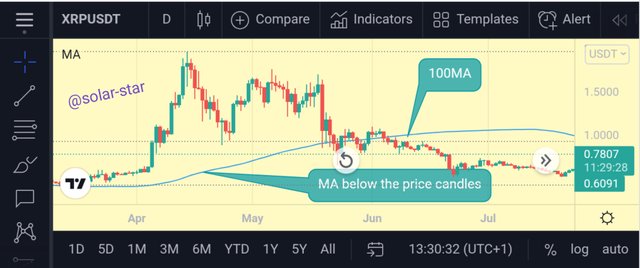
At any point in the chart, when the moving average line rises above the price level, it indicates a bearish trend meaning the selling order outweighs the buy order which ultimately increases the selling pressure. However, when the MA shunts below the price, it signifies a bullish trend and its only a buy order that can be made at this point.
There are basically 3 different types of MA, they include;
• Simple moving average
• Exponential moving average
• Weighted moving average.
Simple moving average: This is the commonest and the easiest of the MA. It uses the data from a specified period of time to calculate future price action of an asset. This price is calculated specifically by taking the mean value of an asset price over a range of time.
Mathematically, its calculated thus;
SMA = (X1 + X2 + X3 ----- + Xn)/n
Where
X = the price of an asset at period n
n = number of time periods
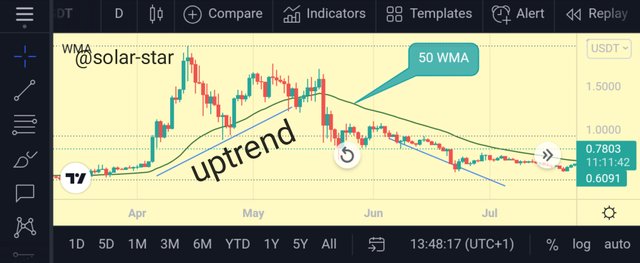
An example is shown below of a crypto pair XRPUSDT using the 50 SMA .

Exponential moving average: The exponential moving is likewise similar to SMA in its operation, however, the only disparity is that the EMA pays greater attention to the market information due to its ability to exert more weight on the price value.
The technical analyst often use in combination with the SMA so as to filter off false signal.
It calculated ad follows
EMA = [price of today×G+(EMA yesterday)×(1-G)]
Where
G = (2/number of EMA+ 1)
An example is shown below of a crypto pair XRPUSDT using the 50 EMA on a 1 hour time frame
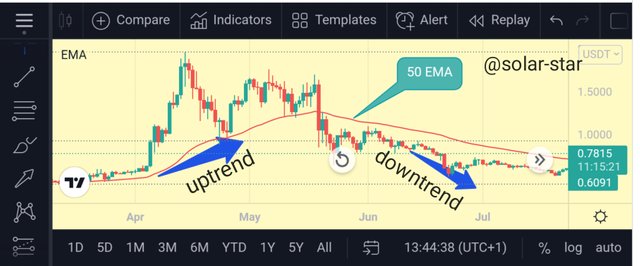
As observed, the EMA responds to market reversals faster than the SMA making it easy to make market decisions appropriately.
Weighted moving Average: This is another type of MA, it works by placing more weight on the present data value just as the name implies and placing relatively lesser weight on the past data.
Through the WMA, the market trend can be easily spotted and future market trend determined which can as well potentiate the trade's confidence in the financial market.
For the calculation as regards WMA, the formula below is usually put to use.
WMA = (price1 × 3) + (price2 × 2) + (price3 × 1) / (3+2+1)
An example is observed above.
| Simple Moving Average | Exponential Moving Average | Weighted Moving Average |
|---|---|---|
| Its calculation is relatively simple and easy to perform | Its calculation is a bit complex and difficult to carry out because it lays more emphasis on the recent data values | Its also very complicated as data from the previous weighted value needs to be filtered. |
| Its basically more preferable for long term price trade due to its ability to capture signals at a higher time frame | Its usually preferable for short term trading as it recognises signals accurately while using the term time frame | its suitable for both short term and long term trade because it places more weight on the present price data and less on past data. |
| Its usually calculated by finding the mean value of an asset over a specified period of time | Its calculated by using the today's data with the sole aim of increasing efficiency | Its calculated by using the recent most weighted data |
| It gives an equal weighted to all data over a specified period of time | it gives a higher weighting to recent price value as compared SMA that gives equal weighting | In contrast to both SMA & EMA, it assigns greater weighting to current price value and less to the past price data. |
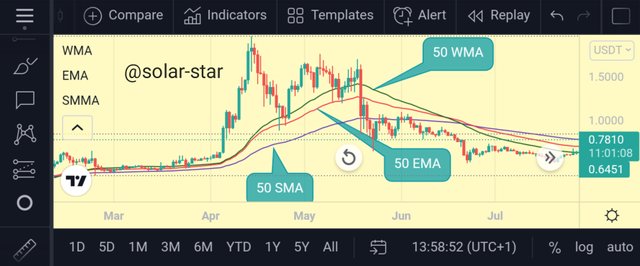
In the chart above, all the three moving averages as discussed earlier are incorporated into a single chart just as observed. These technical tools tend to move at different pace.
In order to analyse the entry and exit points in the trade, I'll be making use of two MAs, that is the 100 SMA & 20 EMA.
Entry point
In order to tentatively analyse and Identify an entry point in the financial market, the crypto pair XRPUSDt was employed on a 4 hour time frame using both the 20 EMA and 100 SMA as the two effective tools in the analysis.
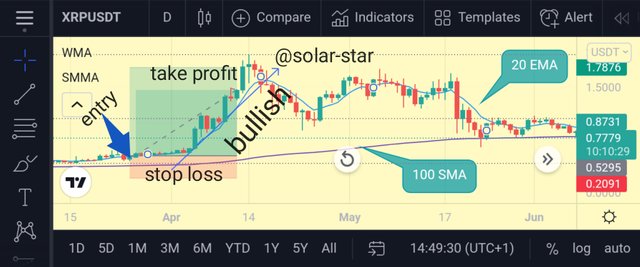
As shown above, for a buy entry to be confirmed, the market must presently be in a bullish condition, meaning that the MAs must break below the market price or the price must surge above the MAs. The take profit as well as the stop loss are set.
Its advisable not to be in a haste while confirming positions as there is also room for retest so as to increase the effectively of the trade.
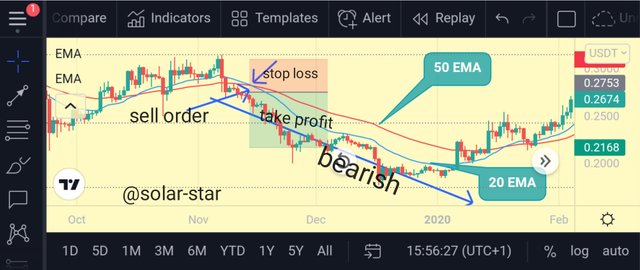
Exit signal
In order to analyse and identify the exit point in the market, the crypto pair xrpusdt was employed as always making use of the 100 SMA and 20 EMA just as shown below.
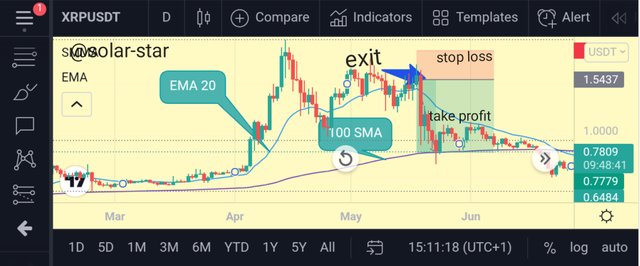
Before an exit is confirmed in a bearish market, the MA must break above the market price or the market price recedes below the two MAs just as indicated above.
Cross over is simply a technique used by most technical analyst in order to increase the efficiency of their trade. Its simply the combination of two same tool at different time periods. In this case, the 50 EMA and 20 EMA were employed. As observed below, the 20 EMA moves faster and detects market signals quicker than the 50 EMA due to its ability in calculating the mean data at a relatively shorter time frame.
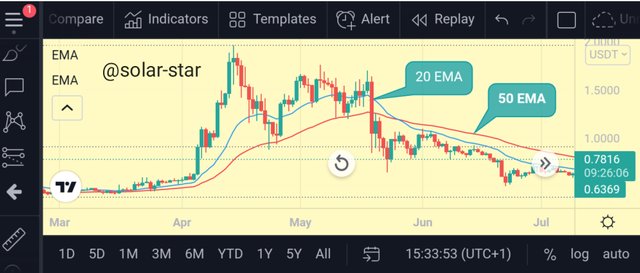
Most technical analyst uses this double tool to increase the effectiveness of their trade .
Market entry
To critically analyse the market entry point, the 20 EMA and 50 SMA were both employed on the chart below. Before confirming using this technique, two things must have occur concurrently, these are;
• The 20 EMA must rise above the 50 EMA indicating a market reversal.
• The price candles must be above the two MAs.
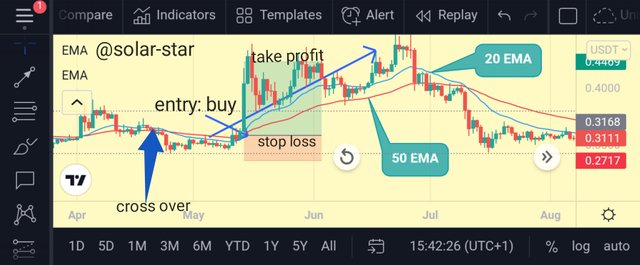
From the image above, when the 20 EMA crossed the 50 SMA upwards, a bullish trend was formed which is a good position to place a buy entry.
Market exit
Just as the market entry, to make a sell order, two scenarios must be seen concurrently
• The 20 EMA must cross the 50 EMA downwards to indicate a bullish reversal.
• The market price should fall below the two EMAs signaling a bearish trend
Just as observed, when the 20 EMA crossed the 50 SMA downward, a bearish trend was confirmed. This provided the trader with the perfect opportunity to place a sell order.
The moving average indicator, just like other technical indicator, is not 100% efficient. Hence, it has some notable draw back as they will be discussed below
• The moving average is a lagging indicator. this means that the signals are seen a little behind time as compared to other indicators like the RSI. This delayed effect can influence the trade greatly as it can be catastrophic or can as well result in a loss especially when dealing with short term trade.
• The moving average works mainly by employing past data of different time frames to calculate future trend. hence, any mistake in the selection of time frame can go a long way in affecting the outcome of the signal observed.
• The moving average pays little attention to the market fluctuation. Hence, some great points can be missed when this indicator is solely employed.
• In order to make accurate market decision and increase the effectiveness of the decision, the moving average is not solely relied upon as important market might be overlooked while using this tool.
conclusion
The knowledge of moving average is of utmost importance in the financial market, especially as it has to do with the compilation of data over a specified period of time. This mean data helps to detect future market trend. Its one of the most simple and easiest tool to employ when dealing with either the short term or long term trade. Its easy to use and its also available on most trading platforms at little or no cost.
However, just like most trading tools, its often advisable to combine it with another trading tool so as to enhance its efficiency as no single indicator is 100% effective.