Crypto Trading Using Trix Indicator - Steemit Crypto Academy |S6W3| - Homework Post for Professor @kouba01

Hello everyone, my pleasure to have a taste of this week's crypto assignment, kudos to professor @kouba01 for such an outstanding lecture on the trix indicator, it was indeed a privilege to be under your tutelage.
On today's discuss, I'll be answering the questions that were raised below
Take a look....

All technical indicators are unique in their own way, this makes every one of it special and different in one way or the other. An indicator of essence which I'll be looking at today is the Trix indicator.
The Trix indicator is simply a triple exponential average that is mostly used by technical analyst to filter out noise from the market. It was developed by Jack hutson in 1980s.
This indicator can either be used as a oscillator or as a momentum indicator or even both, depending on the context at which it's employed. As a momentum indicator, it helps detect the overbought region as well as the oversold region, making it possible for traders to spot the buy signal as well as the sell signals. This indicator is similar to the EMA in its operation. It uses a triple smoothing moving average to help filter out market noise.
The Trix indicator works in similar way as compared to the EMA. however, the signals produced by the trix indicator is much smoother, this is because, it uses a triple smoothing moving average to filter off unwanted market noise. In addition, the trix is a momentum indicator, it indicates a buy signal when the trix crosses above the zero line and a sell signal when the trix crosses below the zero. In this way, false signal can be mitigated.
For the calculation of the trix indicator value, the exponential moving average of a price is first calculated using the formula below
EMA=(closing price × weight ) + (previous day EMA) ×(1-weight)
1st EMA(P) = EMA(P, N, 1)
Where
P= current price
N= number of period.
After obtaining value for the first EMA, its then smoothened to obtain the second smoothing exponential using the formula below
2nd EMA = EMA(1stEMA, P, N)
This double EMA is further smoothened to obtain the triple EMA which will be used for the calculation of the trix value.
3rd(EMA) = EMA(2nd EMA, P, N)
From the above equation, the trix value can finally be calculated using its formula
TRIX = EMA 3(P) - EMA 3(P-1) ÷ EMA 3(P-1)
Graphically, this calculation can be seen from the chart below
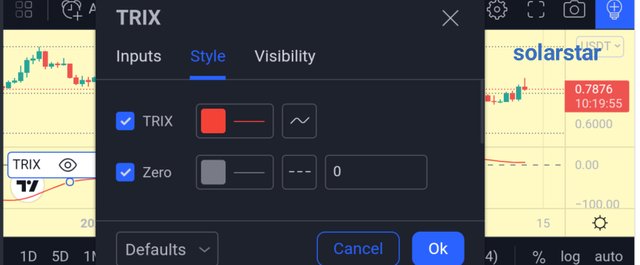
The configuration of the Trix indicator is pretty much similar to that of the EMA, the steps are highlighted below
• click on the settings icon of the of the trix indicator
• click on input to modify the time frame
• click on the style for a change in texture
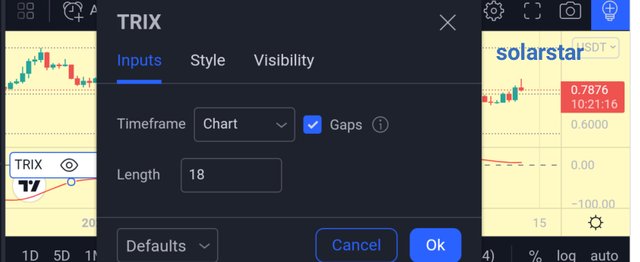
I think changing the default setting of this indicator, especially the time frame, will depend on the type of trade the trader intends to make. For example, a trader that wants to open a long term trade, should consider using a longer period. However, same cannot be said for short term trades or scalpers, as a short period tends to favour such trades. However, for those not completely acquainted with the indicator, the default settings can be maintained.
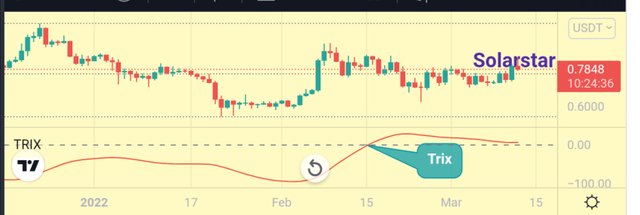
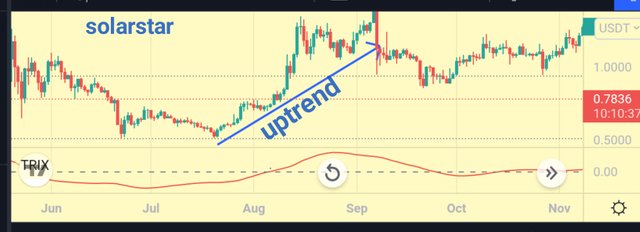
The usefulness and popularity of an indicator grows when its effective and consistently giving precise and accurate signals. Trix indicator, unfortunately does not offer this. However, in order to predict or determine a bullish trend so as to know the appropriate time to place a buy order, the trix line must rise above the zero level, giving a buy signal just as indicated below on the chart.
Conversely, for the determination of the trend reversal from bullish to bearish, the oscillator value must cross below the zero level to signal a sell order. Its indicated in the graph below
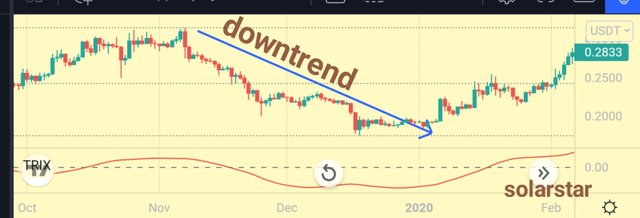
From the chart, we could observe that the trix indicator signalled a price reversal after the bearish trend started. Going further, the trix indicator is not very successful in the short term trade. However, the indicator can be mostly used for long term trade since they are not generally affected by small price movements.
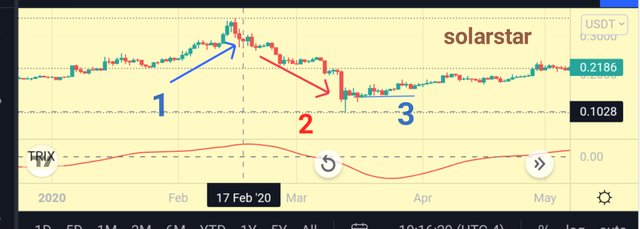
Just as seen from the chart above, in part 1, the indicator signalled a buy order some moments late after the commencement of the bullish trend. Same was followed for part 2 as the sell signal also came a bit late. However, in part 3, the indicator still remained on the horizontal level without giving a clear cut signal.
The combination of two technical tools is often done in order to increase the efficiency of the signals. In this case, when the trix indicator is being combined with the MACD, it can help act as a filter.
In this comparism, a 15- period trix represented by a moving average of 9 were employed against the MACD(12,26,9).
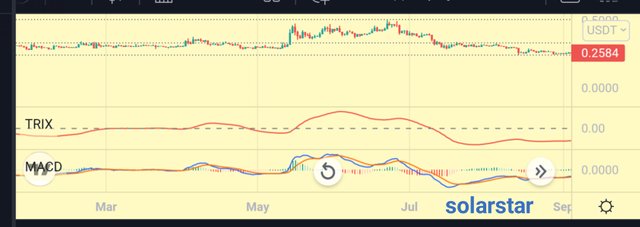
From the chart, as observed above, the trix indicator tends to have a much more smoother trend as compared to that of the MACD.
For actual trading, long position can be entered when the trix crosses the moving average upwards, short position can as well be placed when the trix crosses the moving average downwards.
The zero line cut off is the crust of the trix indicator that helps to detect a bullish as well as a bearish trend. When the trix line crosses above the zero level, a potential bullish trend is signalled. Conversely, when the trix line crosses below the zero level, a potential bullish trend is imminent.
Likewise, when this concept is used with another, like in the divergence technique, it tends to make the trix operationally very strong.

The chart above is a chart of xrpusdt on a 3 hour time frame. As observed, there was a bearish trend in price but the indicator indicated a bullish trend. This divergence can only confirm one thing, which is a potential price reversal from bearish to bullish. The trix line subsequently did crossed the zero level upwards indicating the reliability of this tools.
Most technical tools are most effective when used in combination with other tools so as to mitigate the rate of false signal. Such tools are intended to help filter off unwanted signals as well as increase the accuracy and effectiveness of the signal given.
For the trix indicator to work better, it is obvious that another tool of reputable standard is needed, hence, the employment of the Aroon indicator
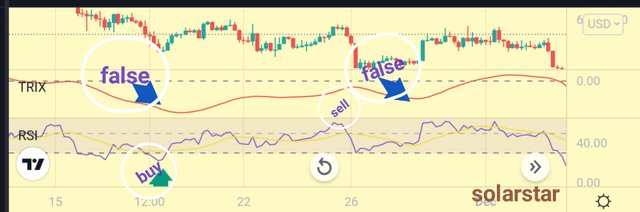
The graph above is a chart of xrpusdt, just as observed above, the RSI indicator helps to filter the false signal by the trix. The trix signal came some days late after the start of the uptrend, however, this was filtered by the RSI indicator as it was able to give the accurate signal. Same was noticed for the sell signal as trix gave a false signal, RSI was able to filter.
Just like every other technical indicator, the trix also has its own advantages and disadvantages. Generally, what makes an indicator preferable , is when its benefits outweighs the demerits.
PROS
The trix indicator has an excellent ability in filtering off market noise, hence, setting the pace reliability. This is done by eliminating the short term cycles in the chart which could be misleading.
Trix is leading indicator, hence, it can signal that an intending change in market trend is imminent with certainty.
It can be used in combination with other tools like the divergence in order to obtain a more accurate result.
This indicator is also very effective in determining the market reversals early enough so as to enable traders make accurate decisions.
CONS
The major disadvantage of the trix indicator is that it tends to lag behind prices. This means that signals only come after the price had already moved. Thus abnormally can traced down to the irregularity in the calculation process.
Another disadvantage worthy of note is the fact that this indicator cannot be solely depended upon for market signals, hence, its always advisable to combine it with another technical tool.
conclusion
The knowledge if the trix indicator is very important in crypto trading trading as it can give the trader a suitable alternative to other technical indicator. Its imperative to know how the indicator works before contemplating on using it.
In as much as we've done justice to the afore mentioned indicator, its pertinent to note that no single technical indicator is 100% efficient, hence, it should always juxtaposed with another tool for clarity of signal.