Technical Indicators - Crypto Academy / Season 4 Week 2- Homework Post for @reminiscence01 || by @small-ville


Hello everyone, welcome to season 4 week 2 of the crypto academy homework post. I will be talking about Technical Indicators based on the assignment by Professor @reminiscence01. Read and enjoy.
Question 1(a)
In your own words, explain Technical Indicators and why it is a good technical analysis tool
- What are Technical Indicators
Technical indicators are trading or investment predictive tools that are based on historical data gotten from Price movement, Trading Volume and populous interest. The Trading indicators provide signals for Technical Analysts or traders who depend on data gotten from mathematical calculations of price movement and other historical factors to predict future price movement.
Technical indicators are represented using graphical patterns that move inline or inversely proportional to the price movement. They are created with a unique feature that enables traders or Analysts to configure or manipulate them using basic setting features.
Various indicators are used to predict the market, but some of them are likely to give the wrong or mislead data because of basic factors, that is why it is advisable to use a combination of indicators so that analysts, traders or investors can receive credible data.
- Why Technical Indicators are good Technical analysis tool
Every Trading Analyst requires a credible data source before they can be able to interpret Price action, Market trend and Entry and Exit points of a Security or asset. That is why most trading analysts and investors depend on these Technical Indicators because of their ability to supply historical data based on the price action, demand and volume of an asset, which can be useful to predict the future Market action of that asset.
For Traders who want to invest in a security or an asset, they would need the right entry and possible exit point of that security, this is what the Technical indicator is good for because it provides data on the price trend which could be a Bearish or Bullish trend. This is a situation that would be favourable for traders or investors who want to buy or sell the security or asset.

Question 1(b)
Are technical indicators good for cryptocurrency analysis? Explain your answer
Cryptocurrencies are Valuable assets or securities which can be traded in the market, they also have resourceful historical data that can be used to analyse their Price action, Volume and Market demand. For traders who trade the cryptocurrency, they need efficient and resourceful data about the security which they are about to invest their money, That is why I strongly believe that Technical indicators are good Cryptocurrency Analysis Tools.
Bitcoin is the most valuable Crypto asset in the world with a Marketcap of over $800 Billion. Bitcoin is a volatile crypto asset that does not have a stable price and is not backed by a commodity, asset or security, for this reason, traders need resourceful data before they can invest their money into the asset, to do that they will need a very favourable entry and exit point to the Bitcoin Market so that they will not accumulate losses throughout their investment, This is where the Technical analysis tool comes into place because they provide the analyst with price trends based on historical data which could be Bearish or Bullish.
Cryptocurrency are digital assets that are volatile in nature, this means that it is a suitable market for Swing Traders who try to scalp of profit from the volatile price action. The Technical indicators offer the best tool to trade in a volatile market, which is the Bollinger Bands. The Bollinger Bands are used to trade the market during a high volatile period. The upper and lower bands act as support levels for the price trends. Other volatility indicators include, the Average True Range (ATR) and CVI (Cboe Volatility Index).
Nevertheless For traders to achieve maximum predictive outputs of the crypto market, Analysts need to combine the use of these Technical indicators to achieve better results.

Question 1(c)
Illustrate how to add indicators on the chart and also how to configure them. (Screenshot needed)
To execute this illustration i will be using the Trading view Charting Platform. Below are the step by step procedure.
- Step 1. Log on to the Trading view website and click on Chart
- Step 2. This will lead you to the next page where you will click on the Technical Indicator Icon
- Step 3. After Clicking on the Technical Indicator Icon an Info Box will pop up, this info Box will contain a list of all the available Technical Indicators that can be used in the Trading Chart. As a user, you have the choice to search or scroll down the list to choose the desired Indicator, in this illustration I chose the Moving Average over a 1-day Chart view of Bitcoin.
After clicking on the desired indicator it will automatically appear on the Chart
- Step 4. To modify the Moving average indicator click on the setting icon on the top left corner.
- Step 5. Click on any of the available tabs( Input, Style, Visibility) on the Info Box that would pop up over the display chart. In this illustration, I will be clicking on the style tab, this will give me options that include changing the colour and precision, of which I will be choosing to change the colour.
- Step 6. By clicking on the colour a dropbox of the colour palette will appear.
- Step 7. Click on your desired colour that is the best opposite to the colour of the display chart. This will automatically change the colour of the moving average.
This Modification will help Analysts identify the line of the Moving average, which is used to identify the price trend.

Question 2(a)
Explain the different categories of Technical indicators and give an example of each category. Also, show the indicators used as an example on your chart. (Screenshot needed)
There are four major categories of Technical indicators of which I will be explaining Below
- Trend Indicators
Trend based indicators are trading tools used to know the price trend of an asset by constantly providing historical price action of the asset. Trend indicators are very useful in predicting the market trend because they provide Analysts and investors data on when to enter and exit from a trade. Some of these Trend Indicator includes:-
(a) The Moving Average (MA)
(b) The Average Directional Index ( ADX)
(c) The Parabolic SAR
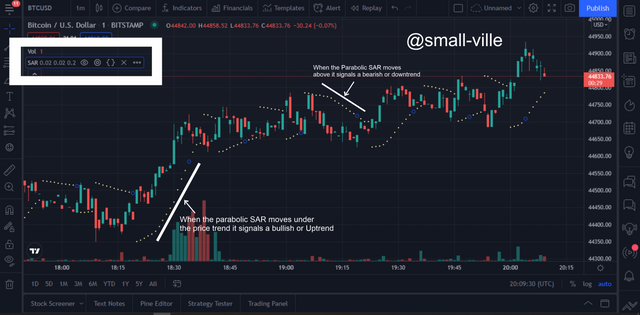
Below is a diagram of the Parabolic SAR which is used to predicts market trends. When the parabolic bar appears below the price trend, it signals an Uptrend and when it appears above it signals a downtrend. Traders and Analysts used this indicator to predict favourable entry and exit points in the market, but the parabolic indicator is less favourable for less volatile markets.
- Volume Indicators
Volume-based indicators provide information on the Trading volume of an asset or security in a specific market. The Volume indicators operate by providing historical data on the transaction between traders on a unit of volume within a period. Examples of Volume indicators include:-
(a) OBV indicator
(b) Volume RSI
(c) Volume price trend indicator
(d) Money flow index
Below is a diagram of the money flow index. Created by Gene Quong and Avrum Soudack, it is used to identify Overbought and Oversold Regions by using the Volume and Price information, it also suggests how strong a trend is.
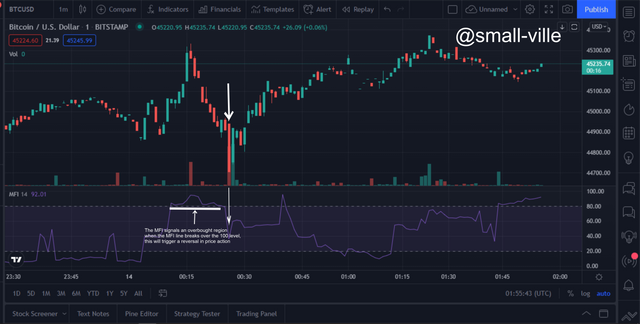
source
- Momentum Indicators
The momentum of an asset depends on Supply and Demand, therefore momentum indicators are tools used by Analysts to predict the force and direction of an asset or security. The momentum indicators show how strong a trend is and the direction it will take based on pressure from Supply and Demand, this makes it similar to trend indicators. Examples of the Momentum indicators include:-
(a) Relative Strength Index (RSI)
(b) Stochastic
(c) Moving Average Convergence Divergence (MACD)
Below is a diagram of the Moving Average Convergence Divergence Indicator. It consists of two moving average lines that overlap each other over periods thereby creating entry and exit triggers for traders.

source
- Volatility Indicators
Volatility simply means the degree of unexpected change in movement. In the trading world, there are types of traders called the Swing Trader. These types of traders look for quick profits in the market by predicting quick swings in price action. The Volatility Indicators are used to identify these quick price swings majorly for a highly Volatile market.
Examples of a Volatility Indicator include:-
(a) Average True Range (ATR)
(b) CVI (Cboe Volatility Index)
(c) Bollinger Bands
Below is a Diagram of the Bollinger Band Indicator, it consists of 3 lines ( Upper, Middle, Lower Bands). The contraction of these lines suggests a less volatile market and the expansion suggest a highly volatile market, also a contraction of these lines may signal a breakout in either direction of the price trend, thus making it an ideal indicator for Swing traders.
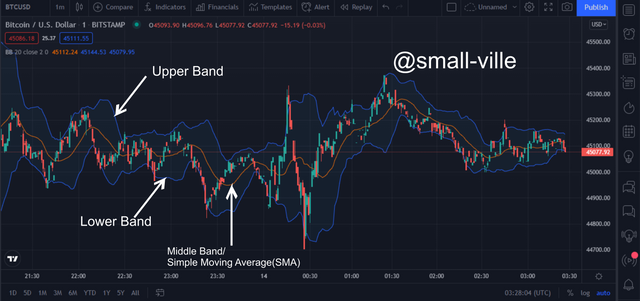
source

Question 2 (b)
Briefly explain the reason why indicators are not advisable to be used as a standalone tool for technical analysis
Technical Indicator are good analysis tools for Trading nevertheless, they individually have their specific uses of unique attributes, for example, a Simple Moving Average(SMA) can give you data on the direction of the market trend but it cannot give you data on the force of that trend which means that as a Swing trader using the SMA you can accumulate losses because there was a sudden change in the market trend due to high volatility. Also for an Investor using the Parabolic SAR which is used to determine a change in the direction of a price trend, the Indicator might at some point give false signals due to a straight price movement or less volatile market.

Question 2(c)
Explain how an investor can increase the success rate of a Technical indicator signal.)
Investors always look for the best accurate or successful analysis of the market that can be acquired while using Technical Indicators, to do that they have to combine Indicators the complements and supports each other to achieve the best possible outcome, but this is best ideal for Pro or Expert traders.
Below is an illustration of a chart where 3 Technical indicators which include:- The RSI, ADX and Bollinger Bands.
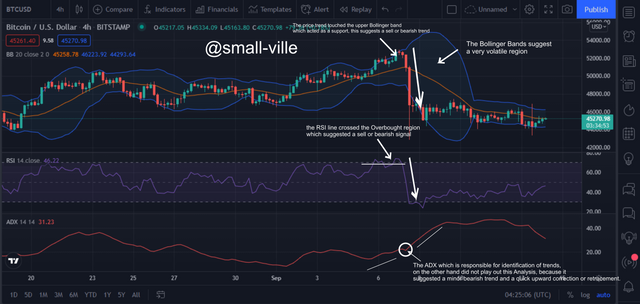
source
The above image shows a 4hour chart of the BTC in the trading view. The marked region is an area of interest that identified a bearish trend in the BTC market knocking the price down from $52,900 to $42,900. The Bollinger Bands and the RSI Indicators identified and played out the analysis, but this was not visible shown in the ADX Indicator which suggested a minor pullback and quick retracement towards an uptrend.
This is why it is Ideal to combine indicators so that traders can have the best success rate while using the Technical Indicators.

conclusion
Technical indicators are Trading, Investment and Analysis tools that are used to predict the future of Price trend, Volume or market demand using historical data of that security or asset. there are four major categories of Technical indicators which include Volatility, Price Trend, Momentum, Volume Indicators. These indicators can be used to analyse trades but it is much better to combine different indicators that complement each other to achieve a satisfying or successful result.


Hello @small-ville, I’m glad you participated in the 2nd week Season 4 of the Beginner’s class at the Steemit Crypto Academy. Your grades in this task are as follows:
Observations:
Please Relate your studies to cryptocurrencies industry.
Recommendation / Feedback:
You have submitted a quality content. Thank you for participating in this homework task.