Technical Indicators 2 - Crypto Academy / Season 4, Week 4- Homework Post for @reminiscence01.

Question 1(a)
Explain Leading and Lagging indicators in detail. Also, give examples of each of them.
Lagging Indicators
As the name implies Lagging Indicator means it strays behind something which is Price Movement. The lagging indicators provide data based on the already price action of the asset, this means that day Traders will find them less favourably because they portray database on price action but, long term traders will find them favourable because it helps traders have confirmation on the direction and Market pressure. They include:- , SROC( smoothed rate of change), Bollinger Bands and TRIX indicator, ATR( Average True Range).
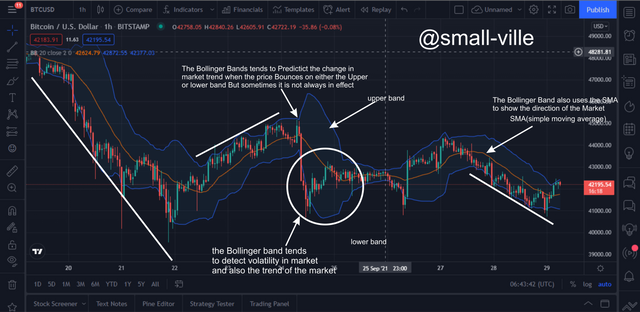
The Lagging Indicators generate false signals when the market is ranging or going sideways. that is why the Bollinger bands cannot be so actively used alone in a ranging or less volatile Market. Also because they lag behind price entry point becomes very hard to spot because of their trailing attribute.
Leading Indicators
Leading Indicators are Technical analysis tools used to predict the future outcome of the market by using historical price actions or data. These indicators help traders to have good exit and entry point because it predicts price before it takes a particular direction, but this could be very detrimental because other factors affect the price which could make price have a counter direction to the indicators prediction. they include Fibonacci retracement, William Percent Range (%R), KDJ**.
source
In a sideways trend, Leading indicators might be misleading because they will project even the most little change in data due to the price action, that is why it is ideal to merge them with other indicators to achieve better results.
Question 1(b)
With relevant screenshots from your chart, give a technical explanation of the market reaction on any of the examples given in question 1a. Do this for both leading and lagging indicators.
source
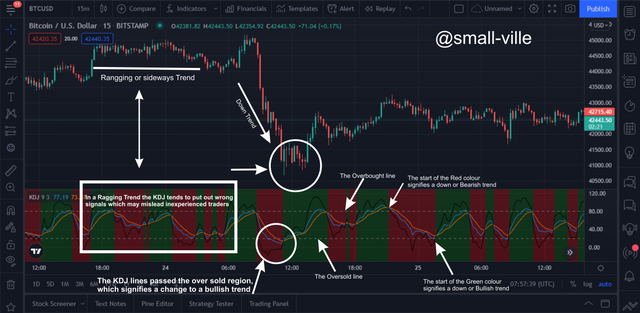
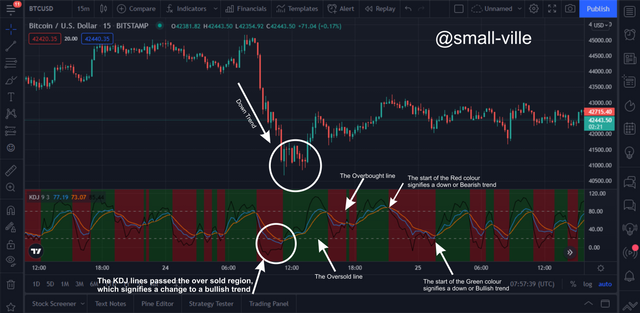
The indicator used above the KDJ indicator is used to spot the overbought and oversold regions of an asset. the Convergence of the %k %D lines suggests a change in the direction of the market while the crossing of the %J line over the overbought region suggest that the asset has been overvalued at that period which will then trigger an influx of sellers in the market thereby triggering a Bearish Trend. The KDJ also used the Red and Green colours to indicate a change in market direction. The red signifies a sell or Bearish Signal while the Green Signifies A Buy or Bullish Signal.
From the Image above it is clear the market was on a Bearish trend, the KDJ then signified that the asset was oversold when the %J line crossed the oversold Region, this caused a change in the direction of the market, also the start of the green line confirmed the change in direction.
Question 2(a)
What are the factors to consider when using an indicator?
- Have A Trading Strategy
A trader has to create or use a trading strategy before choosing an indicator that would march his strategy. For example, a day or swing trader would find a Bollinger Band favourable but a long term trader would find it less favourable. Having a good trading strategy would help the trader have a more focused view of the market when using indicators because it will help the trader filter all the noise in the market. - Identify The Market Trend
The Market moves in three different directions which are UpTrend, DownTrend and Ranging or sideways. Identification of these trends will help the trader to know which indicators to choose. If a market is moving in an Up or Down Trend then the trader should use Trend indicators while if the Market is Moving sideways it is best to use Volatility or Momentum based indicator to identify the strength of the reoccurring or previous trend. - Identify the Type of Indicator to Use
For a trader to choose an indicator he has to understand the type of indicator and know if it is right to use it at that period of trading. For example, if a trader wants to know the strength of a trend he has to use a lagging indicator which will provide a clear view of the previous actions of the price of the asset. Also is a trader wants to predict the price action or movement of an asset he/she would choose a leading indicator that will provide him data on the possible direction the Price will take. - A Cormfirmation Strategy
Every indicator has its Pros and Cons which means they are prone to give false signals or data, that is why it is of the essence to merge indicators that would have a corresponding result to the indicators in use by the traders. Every trader should make it a habit of using multiple Indicators so that they can have a much credible and trusted result due to similar results projected by other indicators.
Question 2(b)
Explain confluence in cryptocurrency trading. Pick a cryptocurrency pair of your choice and analyze the crypto pair using a confluence of any technical indicator and other technical analysis tools. (Screenshot of your chart is required ).
source
Since Traders need to confirm their analysis, they have to combine other indicators to have a certified result of their analysis.
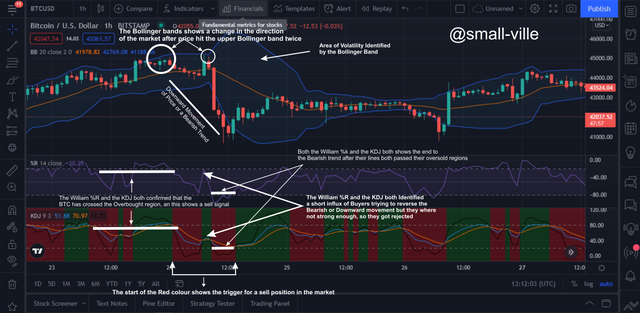
From the Image above, I used the Bollinger Bands, the KDJ and the Williams %R to get a confirmation on the movement of price on the BTC/USDT crypto pair. From the Image, it is seen that the price was on an uptrend but it hit the upper band of the Bollinger which signalled a change in the direction of price, also the William %k and the KDJ which identifies when an asset has been overbought or Oversold, both identified that the BTC has crossed the Overbought region which signalled a change to a down or Bearish trend. Also, the start of the Red colour of the KDJ signals a sell or Bearish signal.
During the price, movement the Buyer entered the market to try and change its direction but where rejected, this was identified when the price hit the upper Bollinger Band for the second time. this was also identified by the KDJ and the William %k when there was a little spike in their movement but they got pulled back by the sellers.
The Bollinger Band identified huge volatility which could not be identified by Both the William %R and the KDJ, Also price hit the lower band of the Bollinger but there was no reversal in price direction that is why it is ideal to merge the use of multiple indicators to achieve successful outcomes.
Question 3(a)
Explain how you can filter false signals from an indicator.
False signals is common in the Market, even Pro traders tend victims of false signals given by the indicators.
source
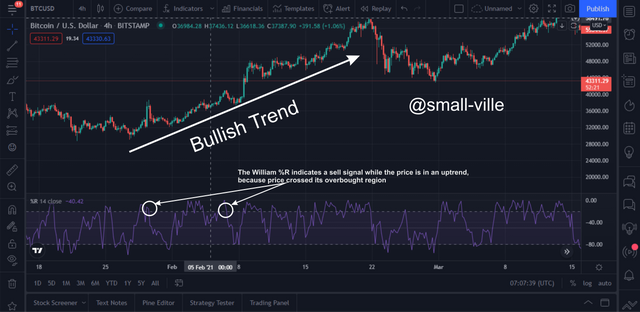
For example, the images above show the price of BTC has crossed the overbought region of the William %r indicator, but the price of BTC is currently on an uptrend, this shows that indicators are capable of producing false signals, that is why every trader must make sure that the indicator is having a corresponding outcome with the price movement.
source
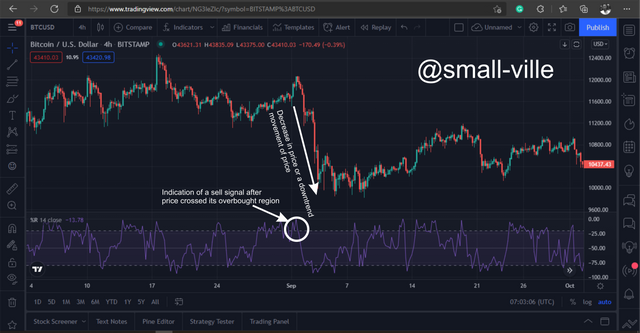
For example, the image above shows that price has crossed the overbought region of the William %r indicator which signifies a sell signal, also the price of BTC moved in a corresponding direction with the signal of the indicator.
Question 3(b)
Explain your understanding of divergences and how they can help in making a good trading decision.
What are divergences
Market or Price structure is key in the identification of key price movements in the market, that is why to spot a divergence in the market the trader has to understand price structure which involves price making movements of Higher Highs and Lower Lows and also the formation of shoulder and head movements.
Divergence is, therefore, the formation of a price structure of a leading indicator that moves in an opposite direction to the original Price structure of the assets. When this formation occurs it signals a potential Bearish or Bullish trend for the asset.
How can divergences help in making a good trading decision
Divergences can help traders spot when a particular trend either Up or Down is getting weak, this will prevent the trader from making an entry into a weak trend which will after a short time initiate a reversal in movement.
Also, Divergences will Traders know when to exit a trade because the divergences will help notify the trader when the trend has gotten weak so that they can pull out of the trade.
Question 3(c)
Using relevant screenshots and an indicator of your choice, explain bullish and bearish divergences on any cryptocurrency pair.
- Bearish divergences
Bearish Divergences occur when the price action of an asset has a different market structure signal that is different from the Signal of the Indicator in use.
source
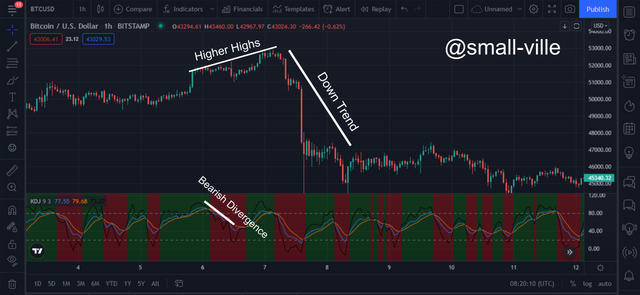
From the image above, we can see that the market created a Higher High price structure while the KDJ was signalling a Bearish Divergence, this indicated that the Bull trend was getting weak and that a potential Bearish trend is about to occur. From the chart, it is obvious that the Bearish trend was initiated shortly after the Bearish Divergence was identified.
- Bullish divergences
Bullish Divergences occur when the price action of an asset has a different market structure signal that is different from the Signal of the Indicator in use.
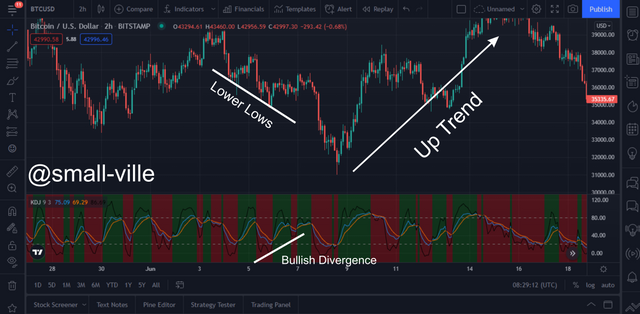
source
From the image above, we can see that the market created a Lower Low price structure while the KDJ was signalling a Bullish Divergence, this indicated that the Bear trend was getting weak and that a potential Bullish trend is about to occur. From the chart, we can see that the Bullish trend was initiated shortly after the Bullish Divergence was identified.
Conclusion
Lagging and Leading indicators all have a particular purpose to serve depending on the trading strategy used by the trader because some of them are best used for long term trades while others are best used for swing or scalping traders. The use of corresponding indicators is of the essence because it helps the trader arrive at a more concrete and successful analysis of any given asset. Also, it is ideal that traders should filter the noise in the market so as not to fall victim to false signals.
Thank you Professor @reminiscence01 for this amazing lecture.
Hello @small-ville, I’m glad you participated in the 4th week Season 4 of the Beginner’s class at the Steemit Crypto Academy. Your grades in this task are as follows:
Observations:
I'm not impressed with your explanation on lagging indicators. You could have explained in a simple term.
Recommendation / Feedback:
Thank you for completing your homework task.