STEEMIT CRYPTO ACADEMY SEASON 4 BEGINNER'S COURSE - TASK 10 || Candlestick Patterns || For professor @reminiscence01 By @sirdeone10k
INTRODUCTION
Greetings to you wonderful friends, I am very happy to write to you once again on this wonderful lecture with the topic candlestick patterns by Professor @reminiscence01. I am very excited to participate in this lecture. Stay tuned as I will be leading you through the lecture.
QUESTIONS
1. Explain the Japanese candlestick chart? (Original screenshot required).
2. In your own words, explain why the Japanese Candlestick chart is the most used in the financial market.
3. Describe a bullish and a bearish candle. Also, explain its anatomy. (Original screenshot required).
Question 1

Explain the Japanese candlestick chart? (Original screenshot required).

When you talk of Japanese candlestick, is simply an old system evolved in the 1700s by Mr. Munehisa Homma who is known as a great rice trader in Japanese at large. Another name for Japanese candlestick is candlestick chart. In this case, whenever someone mentioned the term Japanese candlestick he or she is also talking about candlestick chart.
Mr. Munehisa Homma found the candlestick chart through the feelings of the rice traders which is also used currently in stock analysis in other to decide the change of price aswell as the way market respond to it.
Japanese candlestick or candlestick chart is also a wonderful indicator in cryptocurrency trading system. This is because of it's role in the adjustment of price in all the future analysis of changes in price.
Candlestick chart in otherwords is derived or introduced through the exchange among the buyers and sellers for a particular benefit. Candlestick is also a chart used for graphical explaination of price movement in the financial market system.
Below is a picture/screenshot showing a Japanese candlestick chart.👇🏽
Question 2

In your own words, explain why the Japanese Candlestick chart is the most used in the financial market.

Going with my words or understanding, Japanese candlestick chart mostly or regularly offers an exact graphical representation of the price change in the market at any given time. It also identifies many price points of interaction among sellers and buyers in the system.
Another wonderful or interesting part of it ( Japanese candlestick chart) is that, it plays a vital role in offering complete information analysis aswell as digital aid in the cryptocurency.
The Japanese candlestick chart shows graphical aswell as the supply and play an effective role in determining the price moves of time in the system.

BULLISH CANDLE

Bullish candle is a well known candlestick pattern that form the uptrend signaling a turnabout and it shows that the buyers has really taken full charge of the market price while the seller fully lost the market.
Anatomy
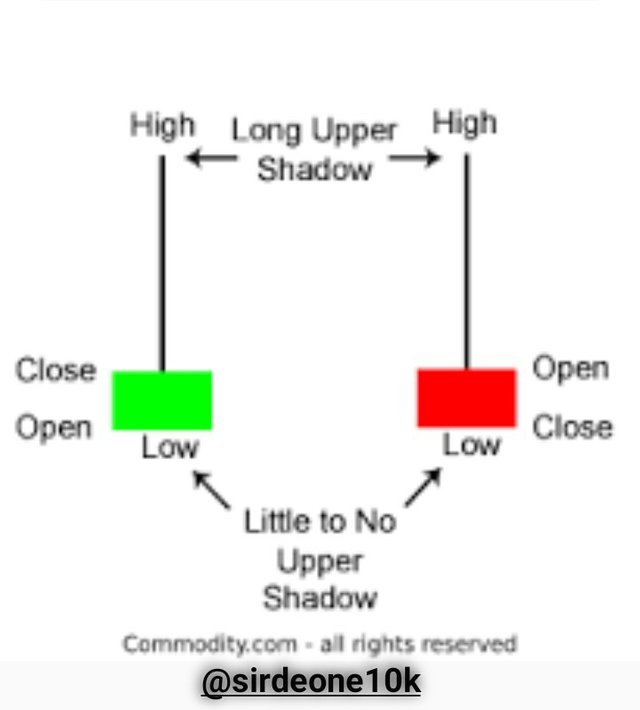
Candlestick has or involves four wonderful components and they are; Open, Close, High and Low. And all this wonderful components represent distinct point in the price movement.
Open
Opening price always tells us the stand-up price of the given Cryptocurrency.
Close
Closing price simply identified the end of the candle within a particular period of time and aswell as indicate the final recorded price.
High
The higher price is also included the candlestick and it shows the ultimate price recorded in a particular period of time.
Low
The low price is the lowest price which is recorded within a particular time frame.

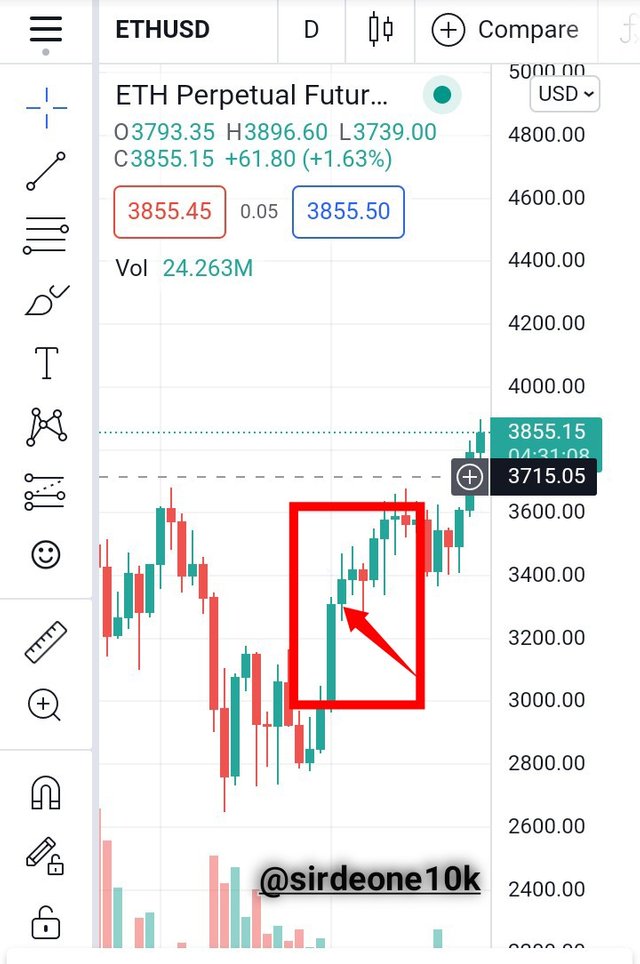
HERE IS AN EXAMPLE OF A BULLISH CANDLE

The chart below simply shows an uptrend movement of ETH/USD in the right time of the screenshot.👇🏽

BEARISH CANDLE

Bearish candle is simply a swamp candlestick pattern that forms or promote in the downtrend singnatin a reversal alongside contrary direction. It also shows that the sellers are in total charge of the market price while the buyers has finally lost the market.
Anatomy
In accordance with the formal typical anatomy of candlestick pattern (Previous candles), bearish candle usually opens quite above the previous candles and the duration of the barish swamp the preceding green candle. In regular cases, the barish candle closes under the preceding candles opening in the system.

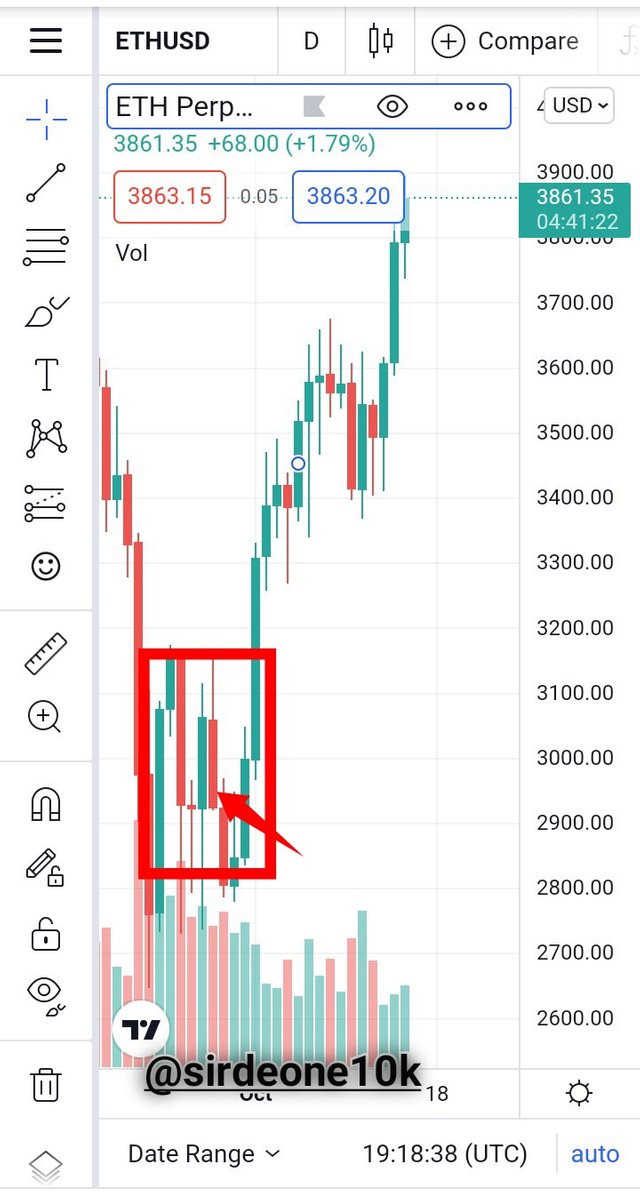
HERE IS AN EXAMPLE OF A BEARISH CANDLE

The chart below, it really shows the downtrend movement of ETH/USD just exactly at the time of the screenshot.👇🏽

CONCLUSION

It is perfectly understood by me now that the Japanese candlestick chart has been in existence for a very long time in the past, not only been in existence but all the traders has been making their regular financial transactions through its system. With the good help of bearish aswell as bullish candle, there is a full assurance for tracking the market chart.
Like I mentioned above, this lecture is really wonderful and educating, i really learnt alot from it. Thank you so much professor @reminiscence01 for the lecture.

Thank you friends for reading my post.
Special regards to:
