Trading Steem with Fractals and Multi-Timeframe Strategies

Greetings my fellow traders,
It's the third week of the Steemit engagement challenge for season 20 and I'm delighted to join this week's competition which is titled Trading Steem with Fractals and Multi-Timeframe Strategies.

| Question 1: Explain Market Fractals |
|---|
Explain what market fractals are and how they can be used to identify trend reversals. Provide an example of a bullish and bearish fractal using a STEEM/USDT trading pair.
When we talk about market fractals, we are referring to technical analysis tools or patterns that are usually used in the financial market to determine potential trend reversals. In the financial market, we have patterns in which anytime they appear we know that there is going to be a turning point in another direction from an uptrend to a downtrend and vice versa.
So when we see these patterns in the cryptocurrency market or any other financial market irrespective of the timeframe we are looking at, we already know the direction of the market. For a pattern to be called a fractal, it must involve 5 consecutive candles. We will discuss this in more detail as we progress.
A bullish fractal is a type of fractal that tells the traders that there is about to be a reversal from a downtrend to an uptrend. The structure is usually a lower point in the middle and higher lows by the sides i.e., two candles side by side with the one in the middle lower than them.
A bearish fractal is a type of fractal that tells the traders that there is about to be a reversal from an uptrend to a downtrend. The structure is usually a high point in the middle and lower highs by the sides i.e., two candles side by side with the one in the middle higher than them.
How Fractals Work in Trend Reversals
As I have said earlier, the fractals are patterns that are used to identify trend reversal in a financial market. So what this pattern does is tell us that the current trend of the market is coming to an end and there are possibilities of reversal.
In the case of the bullish fractals, you can identify it at the bottom of the trend i.e., it tells you that the downtrend movement is about to come to an end and the beginning of an uptrend is about to start. Similarly, in the case of the bearish fractals, you can identify it at the top of the trend i.e., it tells you that the uptrend movement is about to come to an end and the beginning of a downtrend is about to start.
Example of Bullish and Bearish Fractals Using STEEM/USDT Trading Pair
Bullish Fractals (Reversal to an uptrend)
Here in this section, I would like us to consider an example of the bullish fractal which is a reversal to the upward direction. We will be considering the chart below which is a pair of STEEMUSDT on a 1D timeframe.
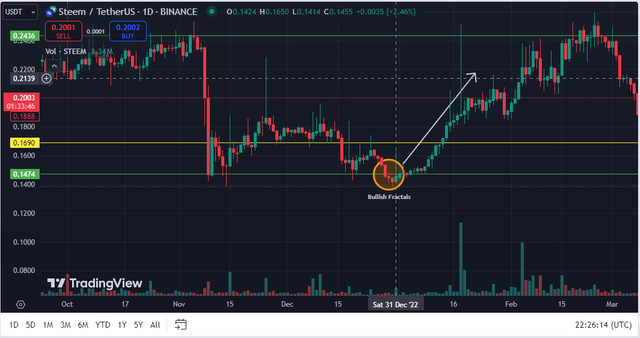
From the above screenshot, you will notice that the downtrend movement was coming to an end as the 5 candles forming fractals appeared at the bottom. After seeing that the middle candle or the third candle among them 5 is lower than the remaining I knew that the trend had come to an end and a possible reversal was expected.
So it is expected that anyone who wants to long the market does so immediately after the formation of the fractal candle as it confirms the trend reversal. However, an additional indicator will be needed to ensure that no false in the market.
Bearish Fractals (Reversal to a downtrend)
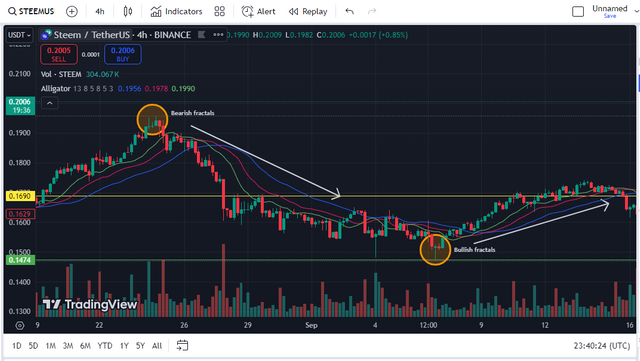
Here in this section, I would like us to consider an example of the bearish fractal which is a reversal to the downward direction. We will be considering the chart below which is a pair of STEEMUSDT on a 4H timeframe.
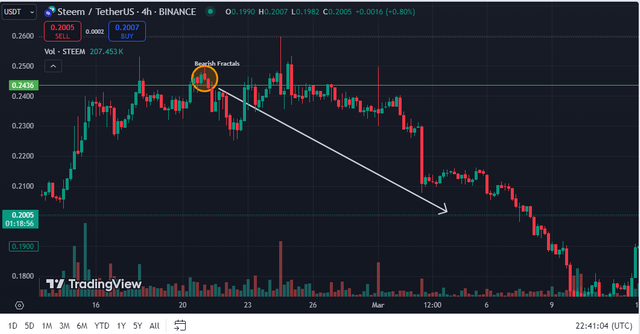
From the above screenshot, you will notice that the uptrend movement was coming to an end as the 5 candles forming fractals appeared at the top. After seeing that the middle candle or the third candle among them 5 is higher than the remaining I knew that the trend had come to an end and a possible reversal was expected.
So it is expected that anyone who wants to short the market does so immediately after the formation of the fractal candle as it confirms the trend reversal. However, an additional indicator will be needed to ensure that no false in the market
| Question 2: Combine Fractals with Other Indicators |
|---|
Discuss how fractals can be combined with other technical indicators like the RSI, moving averages, or Alligator to improve trend predictions. Show a practical example of using these tools together on a Steem chart.
Just as I have stated earlier, it is not good to use the fractals pattern alone to trade a crypto asset as the risk will be very much. To enable you to have a better signal about the market, you must learn to combine the fractal pattern and other technical indicators such as RSI, MA, or the Alligator indicator.
Here we are going to look at fractals with each of these indicators one after the other to see how they can help us identify the trend exhaustion and possible reversal point. So let's go ahead picking them one after the other.
Fractals with RSI
Relative Strength Index (RSI) is a momentum-based indicator that tells traders when an asset is overbought or oversold. It has a range from 0-100 and if the range is above 70 we term it overbought and below 30 is oversold.
Bullish Reversal: To determine a bullish reversal using this indicator and the fractal pattern, you will need to see the price below the 30 range which is a sign of oversold and that indicates that the trend is about to reverse.
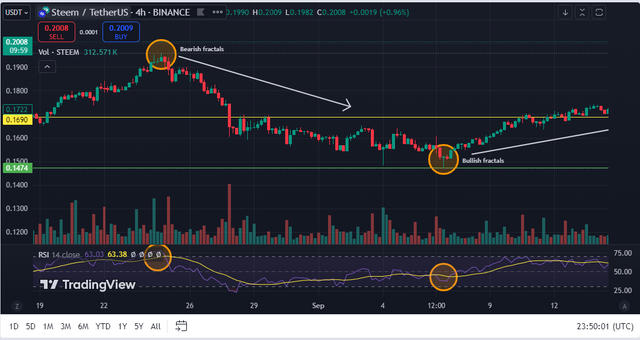
Bearish Reversal: To determine a bearish reversal using this indicator and the fractal pattern, you will need to see the price above the 70 range which is a sign of overbought and that indicates that the trend is about to reverse.
From the above screenshot, you will notice that the fractal pattern was formed during the periods of overbought and oversold in the market, and after that, we saw a market reversal in the opposite direction.
Fractals with MA
Moving Average (MA) is a trend-following indicator that shows you the direction of the market at any point and time. The indicator always acts as dynamic support or resistance to the price chart. If the indicator is seen above the price chart it implies that the trend is a downtrend and if it is seen below the price chart it implies that the trend is an uptrend.
Bullish Reversal: For bullish reversal, when see the fractal formed below the long moving average we will then expect a trend reversal to an upward direction.
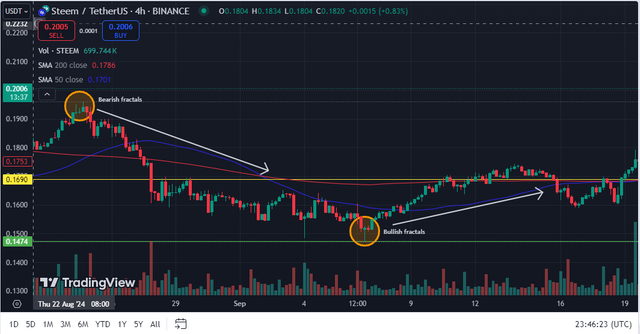
Bearish Reversal: For bearish reversal, when see the fractal formed above the long moving average we will then expect a trend reversal to a downward direction.
From the chart above, we saw that the bearish and bullish fractals were formed below and above the long-moving average of 200 which shows that the market moved upward after the bullish fractals and downward after the bearish fractals respectively.
Fractals with Alligator indicator
Alligator indicator is made up of 3 moving averages which are the jaw, teeth, and lips and these 3 moving averages help traders to identify the trend of the market and the strength of the trend as well.
Bullish Reversal: If you see a bullish fractal forming close to the lips (green line) and the jaw and teeth are also moving in the same direction acting as dynamic support then that could mean a strong buying signal.
Bearish Reversal: If you see a bullish fractal forming close to the lips (green line) and the jaw and teeth are also moving in the same direction acting as dynamic resistance then that could mean a strong selling signal.
In the case of the alligator indicator, as seen from the screenshot, you will notice that a bearish fractal is formed above the 3 MA lines, and a bullish fractal, is formed below the 3 MA lines. All of these clearly state the direction of the trend thereafter.
| Question 3: Using Fractals Across Multiple Time Frames |
|---|
Show how fractals can be used on different time frames (daily, weekly, or even hourly charts). Identify fractals on a daily and weekly Steem chart and explain how they interact to provide a comprehensive market outlook.
Fractal is a pattern that can be used or applied on different time frames of a chart. Fractals can help traders to trade short-term (hourly timeframe), medium-term (daily timeframe), or even long-term (weekly timeframe). Now let's consider using fractals in hourly, daily, and weekly timeframes.
Bullish Fractal on 1H timeframe: Considering the screenshot below, we can see that we have a bullish fractal formed at the bottom of a downtrend. After the formation, I waited for confirmation about the movement of the asset before entering the market.
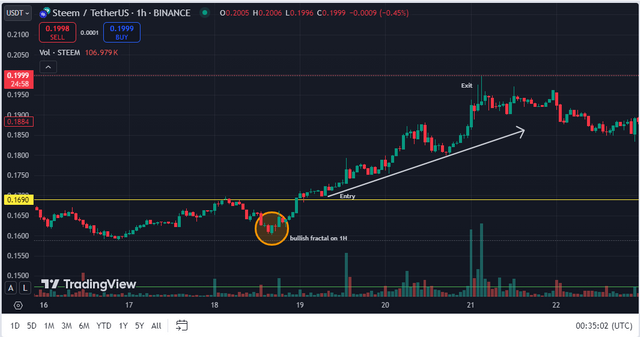
From the chart above, you will notice that the entry point I chose was after a little retracement. This is so that I don't get trapped in the market. When using only the fractal pattern to trade especially in the short term such as the hourly timeframe you must wait for confirmation before taking the trade.
The exit point of the trade also was kept at the next resistance level. Since it is a short-term trade, there is no point staying too long in the market. So the resistance point is the best point to exit the market as you may have already made some profit.
Bearish Fractal on 1D timeframe: Considering the screenshot below, you will notice that a bearish fractal was formed at the end of the upward movement which means that the trend is about to reverse in the opposite direction. Also, the entry here is for traders who are trading medium-term.
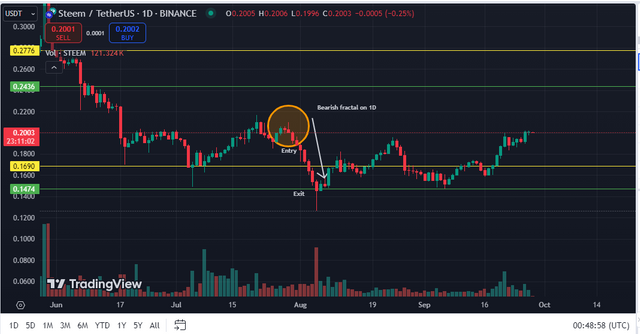
The entry point as you can see is after the fractal formation and the exit of the trade was at the next support level of the market. So using this time frame, you will have a broader picture of the market and you will also need to stay longer in the market as compared to those who use the hourly timeframe for their analysis i.e., the short-term traders.
Bearish Fractal on weekly timeframe: Considering the screenshot below, you will notice that a bearish fractal was formed at the end of the upward movement which means that the trend is about to reverse in the opposite direction. Since it's a weekly timeframe, traders who use this method stay long in the market.
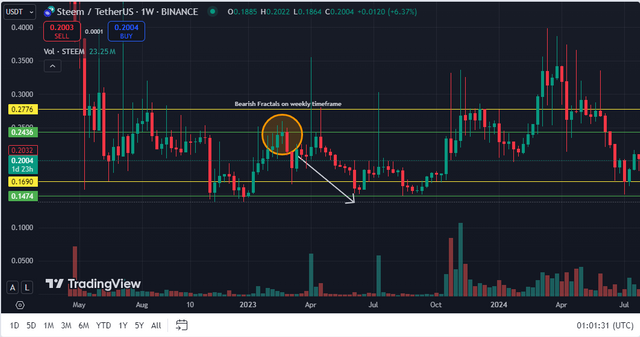
From the screenshot above you can see the movement of the asset thereafter the formation of the pattern. So traders who wish to trade in such a market must be ready to spend months in the market. Also, you can see from our arrow that the exit point is kept in the next support level of the asset.
Considering the analysis for the daily and weekly timeframe, we can say that both interact to provide traders with the needed information for their trades. The major support level in the daily timeframe is the same as the major support level in the weekly timeframe.
So as a trader making any decision, it is important you know these points and then consider them as they will serve as a block toward the movement of the asset except some other thing happens for that level to be broken.
So you can agree with me that the weekly and daily charts of STEEMUSDT here show that there is an interaction that will help traders to make good decisions about the market at any point and time.
| Question 4: Develop a Trading Strategy Based on Fractals |
|---|
Create a complete trading strategy using fractals for the Steem token. Specify entry and exit points, and stop-loss levels, and use recent fractals on a chart to support your strategy.
Here I will be going into a short-term trade i.e., an hourly trade since I wouldn't want to stay too long in the market. To start one must be sure to identify fractal patterns.
As I earlier explained at the beginning of this course the fractal pattern is made up of 5 candles and in the bullish fractal, the third candle is always lower than the rest you can see that from the screenshot below.
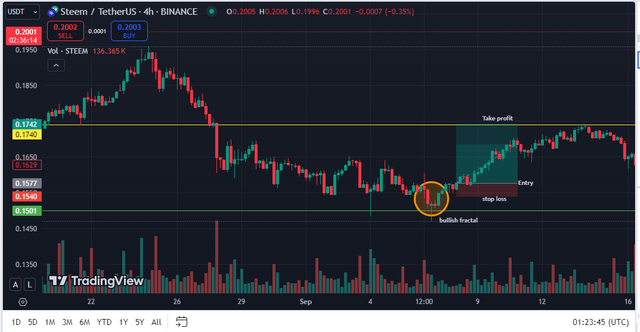
Having identified that this was a bullish fractal, I waited for the market to be confirmed after a little retracement. I brought my buy logo as you can see from the above screenshot where we have the entry after the little retracement, the take profit was at the next support level and the stop loss was immediately below the entry point.
Seeing the movement of the asset, it went as predicted since we had confirmed that the Bullish fractal we identified is correct and that is how you can use this strategy to trade your asset. So below let me share some key things that need to be taken into consideration when using this strategy.
Identify the fractal in the chart (Bullish or Bearish)
If you are not using the pattern with any other
indicator, you must wait and confirm that the reversal is correct after a retracement and that the price continues moving in the predicted direction.You take profit should always be your next support or resistance level if you are selling or buying.
Stop loss should be placed below your entry to minimize loss.
| Question 5: Analyze Steem’s Current Market Trend with Fractals |
|---|
Analyze Steem’s current market position using fractals. Where do you think the Steem token is in its fractal cycle (bullish or bearish)? What are the next possible moves? Support your analysis with other indicators such as RSI or moving averages.
Based on the current market of the Steem token, I have identified that the market is having a bullish fractal. My analysis here is done on a 4H timeframe and I also added the 50 MA to confirm my prediction.
From my analysis below, I noticed that the 50 MA is below the price chart acting as a dynamic support to it, and also the fractal identified showed that the trend is going in an upward direction because we always see a little downward move before the pattern appears.
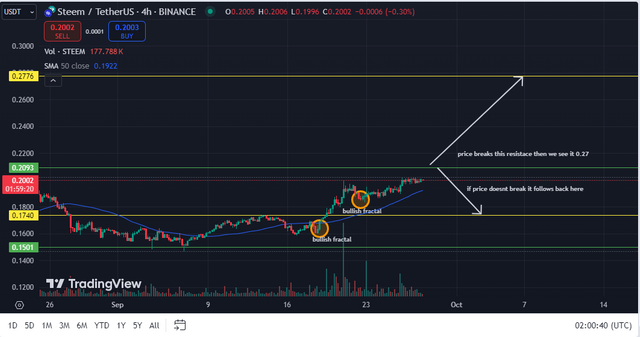
So in my opinion the Steem token is currently on its bullish fractal cycle which means we may be expecting upward movement of the price of Steem. Based on the analysis as seen in the chart above, we have two possibilities for the movement of Steem.
The price at the moment is close to a mini-resistance level that must not be ignored hence we have established that if the asset breaks the resistance level then we can see the price of Steem at about $0.27 which is a major resistance level.
In the same way, if the price of the asset doesn't break the mini-resistance level then we will expect to see it fall back to $0.17. From all indications i.e., the fractal analysis and the indicator the price is supposed to move upward so let's watch and see if the mini-resistance level will be broken.
Finally, I want to invite @suboohi, @josepha, and @ripon0630 to also join the contest and share with us their thoughts on Trading Steem with Fractals and Multi-Timeframe Strategies.
Note: All images except otherwise stated are mine and are taken from TradingView website.
Upvoted. Thank You for sending some of your rewards to @null. It will make Steem stronger.
Fractals are of great use for the determination of the turning points in the market. We can spot the tend reversals with the help of the fractals.
When a bullish fractal is formed then at that time we can enter our long entries because the next movement of the price is upward.
Further the integration of the other indicators helps us more to detect the confirm signals.
Best of luck for the contest.